PDF attached
China was very quiet in buying US agriculture goods for the week ending December 17.
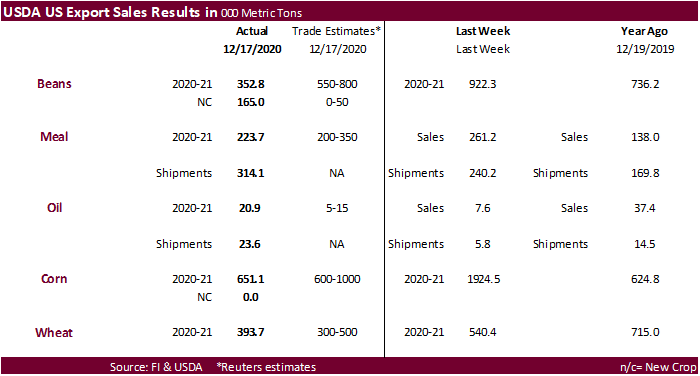
· US soybean export sales were reported at a marketing year low 352,800 tons. It included China but a chink of it was switched from unknown. (526,400 MT, including 396,000 MT switched from unknown destinations and decreases of 6,900 MT)
· Soybean oil sales were 20,900 tons and meal at 223,700 tons. Soybean meal shipments were a good 314,100 tons and 23,600 tons of soybean oil were shipped.
· US corn export sales were 651,100 tons.
· Pork sales were 16,300 tons.
· US all-wheat export sales were 393,700 tons and new-crop 24,000 tons.
This summary is based on reports from exporters for the period December 11-17, 2020.
Wheat: Net sales of 393,700 metric tons (MT) for 2020/2021 were down 27 percent from the previous week and 34 percent from the prior 4-week average. Increases primarily for Nigeria (102,000 MT), Mexico (70,200 MT, including decreases of 200 MT), Indonesia (60,000 MT), South Korea (57,000 MT, including 55,000 MT switched from unknown destinations), and Japan (52,900 MT), were offset by reductions primarily for unknown destinations (17,300 MT). For 2021/2022, total net sales of 24,000 MT were for Peru. Exports of 366,300 MT were up 54 percent from the previous week, but down 8 percent from the prior 4-week average. The destinations were primarily to Mexico (80,700 MT), China (63,000 MT, including 31,500 MT late–see below), South Korea (57,000 MT), Taiwan (49,100 MT), and Japan (30,300 MT).
Optional Origin Sales: For 2020/2021, the current outstanding balance of 10,000 MT, all Spain.
Late Reporting: For 2020/2021, exports totaling 43,100 MT were reported late for China (31,500 MT) and the Dominican Republic (11,600 MT).
Corn: Net sales of 651,100 MT for 2020/2021–a marketing-year low–were down 66 percent from the previous week and 59 percent from the prior 4-week average. Increases were primarily for unknown destinations (181,600 MT), Guatemala (99,800 MT, including decreases of 1,600 MT), Japan (87,200 MT, including 79,200 MT switched from unknown destinations and decreases of 300 MT), Egypt (60,000 MT), and Canada (42,600 MT). Exports of 835,700 MT were down 13 percent from the previous week and 8 percent from the prior 4-week average. The destinations were primarily to China (271,900 MT), Japan (260,800 MT), Mexico (178,500 MT, including 36,300 late–see below), Panama (30,700 MT, including 20,800 late–see below), and Taiwan (26,500 MT).
Optional Origin Sales: For 2020/2021, the current outstanding balance of 1,647,400 MT is for South Korea (903,000 MT), unknown destinations (224,000 MT), Taiwan (205,000 MT), Vietnam (130,000 MT), China (65,000 MT), Ukraine (62,400 MT), and Japan (58,000 MT).
Late Reporting: For 2020/2021, exports totaling 71,500 MT were reported late for Mexico (36,300 MT), Panama (20,800 MT), and Jamaica (14,400 MT).
Barley: No net sales were reported for the week. Exports of 1,000 MT were to Japan (700 MT) and Taiwan (300 MT).
Sorghum: Net sales of 64,300 MT for 2020/2021 were down 80 percent from the previous week and 75 percent from the prior 4-week average. Increases reported for China (64,400 MT, including 68,000 MT switched from unknown destinations and decreases of 6,500 MT), were offset by reductions for Mexico (100 MT). For 2021/2022, total net sales reductions of 68,000 MT were for unknown destinations. Exports of 130,600 MT were down 60 percent from the previous week and 22 percent from the prior 4-week average. The destination was China.
Rice: Net sales of 111,500 MT for 2020/2021 were down 33 percent from the previous week, but up 19 percent from the prior 4-week average. Increases primarily for South Korea (45,700 MT), Mexico (35,500 MT, including decreases of 1,200 MT), the Dominican Republic (8,600 MT, including decreases of 400 MT), the United Kingdom (8,200 MT), and Ghana (4,000 MT), were offset by reductions for Liberia (200 MT) and Haiti (200 MT). Exports of 78,600 MT were down 47 percent from the previous week and 30 percent from the prior 4-week average. The destinations were primarily to Japan (27,600 MT), Nicaragua (24,300 MT), Haiti (7,300 MT), Mexico (4,900 MT), and Jordan (3,500 MT).
Exports for Own Account: For 2020/2021, new exports for own account totaling 100 MT were to Canada. The current exports for own account outstanding balance is 100 MT, all Canada.
Soybeans: Net sales of 352,800 MT for 2020/2021–a marketing-year low–were down 62 percent from the previous week and 47 percent from the prior 4-week average. Increases primarily for China (526,400 MT, including 396,000 MT switched from unknown destinations and decreases of 6,900 MT), the Netherlands (139,000 MT, including 138,000 MT switched from unknown destinations and decreases of 6,400 MT), Egypt (95,700 MT, including 70,800 MT switched from unknown destinations and 13,800 MT switched from Canada), Japan (75,000 MT, including 67,300 MT switched from unknown destinations and decreases of 2,800 MT), and Spain (71,800 MT, including 65,000 MT switched from unknown destinations), were offset by reductions primarily for unknown destinations (791,300 MT). For 2021/2022, total net sales of 165,000 MT were for unknown destinations. Exports of 2,518,400 MT were down 3 percent from the previous week and 1 percent from the prior 4-week average. The destinations were primarily to China (1,374,600 MT, including 69,100 late–see below), Egypt (192,700 MT), Mexico (147,600 MT), the Netherlands (139,000 MT), and Japan (134,000 MT).
Optional Origin Sales: For 2020/2021, the current outstanding balance of 63,000 MT, all China.
Exports for Own Account: For 2020/2021, the current exports for own account outstanding balance is 74,000 MT, all Canada. Late Reporting: For 2020/2021, exports totaling 69,100 MT were reported late China. Export Adjustments: Accumulated exports of soybeans to the Netherlands were adjusted down 23,331 MT for week ending December 3, 2020. The correct destination for these shipments is Germany and is included in this week’s report.
Soybean Cake and Meal: Net sales of 223,700 MT for 2020/2021 resulting in increases primarily for the Philippines (51,300 MT), Guatemala (50,700 MT), Canada (35,200 MT, including decreases of 600 MT), Mexico (34,100 MT, including decreases of 9,400 MT), and Peru (18,000 MT), were offset by reductions primarily for El Salvador (6,000 MT), Thailand (3,200 MT), and Belgium (2,200 MT). Exports of 314,100 MT were up 31 percent from the previous week and 32 percent from the prior 4-week average. The destinations were primarily to the Philippines (91,400 MT), Bangladesh (49,500 MT), Honduras (36,300 MT), Venezuela (25,100 MT), and Mexico (22,800 MT).
Soybean Oil: Net sales of 20,900 MT for 2020/2021 primarily for Peru (11,500 MT), Venezuela (4,000 MT), unknown destinations (4,000 MT), South Korea (1,000 MT), and Colombia (1,000 MT), were offset by reductions for Canada (700 MT). Exports of 23,600 MT were primarily to South Korea (17,500 MT), Venezuela (5,500 MT), Canada (300 MT), and Mexico (200 MT).
Cotton: Net sales of 416,700 RB for 2020/2021 were down 1 percent from the previous week, but up 14 percent from the prior 4-week average. Increases primarily for China (185,600 RB, including decreases of 13,500 RB), Vietnam (108,400 RB), Pakistan (52,000 RB), El Salvador (17,200 RB), and Turkey (14,800 RB), were offset by reductions primarily for Mexico (10,500 RB). For 2021/2022, net sales of 67,100 RB were primarily for El Salvador (21,600 RB), Honduras (15,000 RB), China (13,200 RB), and Turkey (9,200 RB). Exports of 281,200 RB were up 12 percent from the previous week and 20 percent from the prior 4-week average. Exports were primarily to China (156,200 RB), Pakistan (30,900 RB), Vietnam (24,000 RB), Mexico (16,800 RB), and Turkey (14,300 RB). Net sales of Pima totaling 30,900 RB were up noticeably from the previous week and from the prior 4-week average. Increases were primarily for India (9,200 RB), China (8,700 RB), Pakistan (3,700 RB), Egypt (2,700 RB), and Vietnam (2,600 RB). Exports of 13,900 RB were down 40 percent from the previous week and 44 percent from the prior 4-week average. The destinations were primarily to India (5,600 RB), China (3,700 RB), Peru (2,000 RB), Vietnam (900 RB), and El Salvador (600 RB).
Exports for Own Account: For 2020/2021, exports for own account totaling 15,900 RB to China (14,600 RB), Bangladesh (1,000 RB), and Indonesia (300 RB) were applied to new or outstanding sales. The current exports for own account outstanding balance of 18,600 RB is for China (2,700 RB).
Hides and Skins: Net sales of 265,800 pieces for 2020 were up 37 percent from the previous week, but down 8 percent from the prior 4-week average. Increases primarily for China (168,900 whole cattle hides, including decreases of 6,900 pieces), Mexico (44,000 whole cattle hides, including decreases of 2,900 pieces), South Korea (30,000 whole cattle hides, including decreases of 3,000 pieces), and Brazil (11,400 whole cattle hides, including decreases of 300 pieces), were offset by reductions for Taiwan (700 pieces). Additionally, total net sales of 5,600 whole calf skins were for Italy and net sales reductions of 100 kip skins were for Belgium. For 2021, net sales of 131,300 pieces were reported for China (59,800 whole cattle hides), Mexico (52,800 whole cattle hides), South Korea (9,600 whole cattle hides), and Taiwan (9,100 whole cattle hides). Also, net sales reductions of 5,600 whole calf skins were reported for Italy. Exports of 360,600 pieces reported for 2020 were up 2 percent from the previous week and 4 percent from the prior 4-week average. Whole cattle hides exports were primarily to China (255,100 pieces), South Korea (51,700 pieces), Mexico (30,500 pieces), Brazil (8,900 pieces), and Taiwan (4,700 pieces). Additionally, exports of 4,500 kip skins were reported to China (1,900 kip skins), India (1,300 kip skins), and Belgium (1,300 kip skins).
Net sales of 25,200 wet blues for 2020 were down noticeably from the previous week and down 73 percent from the prior 4-week average. Increases primarily for Italy (13,300 unsplit, including decreases of 26,300 unsplit), China (5,800 unsplit), and Brazil (5,400 unsplit, including decreases of 300 unsplit), were offset by reductions primarily for Vietnam (100 unsplit). For 2021, net sales of 71,000 wet blues primarily for Italy (69,800 unsplit), Vietnam (1,600 unsplit), and Hong Kong (1,500 unsplit), were offset by reductions for Brazil (1,500 unsplit) and China (1,200 unsplit). Exports of 88,200 wet blues for 2020 were down 40 percent from the previous week and 16 percent from the prior 4-week average. The destinations were primarily to Italy (20,000 unsplit and 3,800 grain splits), China (19,700 unsplit), Vietnam (19,500 unsplit), Brazil (9,700 unsplit), and Thailand (9,500 unsplit). Net sales of 402,600 splits for Vietnam (360,000 pounds) and Italy (48,000 pounds), were offset by reductions for Taiwan (5,300 pounds). For 2021, net sales of 180,700 splits were reported for Vietnam (172,800 pounds) and China (7,900 pounds). Exports of 237,700 pounds were to Vietnam (200,000 pounds) and Taiwan (37,700 pounds).
Beef: Net sales of 6,000 MT reported for 2020 were down 40 percent from the previous week, but up noticeably from the prior 4-week average. Increases were primarily for Japan (2,000 MT, including decreases of 400 MT), South Korea (1,900 MT, including decreases of 700 MT), Mexico (600 MT, including decreases of 100 MT), Canada (400 MT, including decreases of 100 MT), and Hong Kong (400 MT, including decreases of 400 MT). For 2021, net sales of 7,200 MT were primarily for South Korea (3,100 MT), Hong Kong (2,100 MT), Japan (700 MT), Mexico (500 MT), and Taiwan (300 MT). Exports of 13,500 MT were down 30 percent from the previous week and 27 percent from the prior 4-week average. The destinations were primarily to South Korea (3,700 MT), Japan (3,300 MT), Mexico (1,900 MT), Hong Kong (1,500 MT), and Canada (800 MT).
Pork: Net sales of 16,300 MT reported for 2020 were down 59 percent from the previous week and 44 percent from the prior 4-week average. Increases primarily for Mexico (17,000 MT, including decreases of 1,000 MT), Japan (2,300 MT, including decreases of 2,000 MT), Canada (1,500 MT, including decreases of 500 MT), the Philippines (900 MT, including decreases of 200 MT), and Guatemala (900 MT), were offset by reductions primarily for China (6,100 MT) and South Korea (1,800 MT). For 2021, net sales of 23,400 MT were primarily for China (7,700 MT), South Korea (3,900 MT), Colombia (3,50 MT), Japan (1,400 MT), and the Philippines (1,400 MT). Exports of 40,500 MT were down 4 percent from the previous week, but up 2 percent from the prior 4-week average. The destinations were primarily to Mexico (14,400 MT), China (13,100 MT), Japan (3,200 MT), South Korea (2,600 MT), and Canada (1,700 MT).
U.S. EXPORT SALES FOR WEEK ENDING 12/17/2020
|
|
CURRENT MARKETING YEAR |
NEXT MARKETING YEAR |
||||||
|
COMMODITY |
NET SALES |
OUTSTANDING SALES |
WEEKLY EXPORTS |
ACCUMULATED EXPORTS |
NET SALES |
OUTSTANDING SALES |
||
|
CURRENT YEAR |
YEAR AGO |
CURRENT YEAR |
YEAR AGO |
|||||
|
|
THOUSAND METRIC TONS |
|||||||
|
WHEAT |
|
|
|
|
|
|
|
|
|
HRW |
172.4 |
1,660.9 |
1,489.2 |
156.4 |
5,407.7 |
5,312.1 |
0.0 |
22.0 |
|
SRW |
67.4 |
496.2 |
557.7 |
9.6 |
1,038.0 |
1,523.3 |
24.0 |
145.0 |
|
HRS |
77.4 |
1,595.7 |
1,385.5 |
76.9 |
3,922.5 |
3,820.7 |
0.0 |
45.0 |
|
WHITE |
78.5 |
2,632.7 |
1,103.9 |
95.1 |
2,699.4 |
2,581.9 |
0.0 |
20.0 |
|
DURUM |
-2.1 |
128.1 |
195.6 |
28.4 |
461.5 |
571.5 |
0.0 |
0.0 |
|
TOTAL |
393.7 |
6,513.5 |
4,731.9 |
366.3 |
13,529.0 |
13,809.4 |
24.0 |
232.0 |
|
BARLEY |
0.0 |
15.0 |
31.5 |
1.0 |
15.5 |
27.4 |
0.0 |
12.5 |
|
CORN |
651.1 |
29,342.1 |
9,895.6 |
835.7 |
12,888.9 |
7,927.6 |
0.0 |
757.0 |
|
SORGHUM |
64.3 |
3,305.9 |
593.5 |
130.6 |
1,738.0 |
493.4 |
-68.0 |
327.0 |
|
SOYBEANS |
352.8 |
19,256.1 |
9,316.9 |
2,518.4 |
34,902.2 |
19,768.5 |
165.0 |
496.0 |
|
SOY MEAL |
223.7 |
3,062.7 |
3,022.0 |
314.1 |
2,687.0 |
2,421.9 |
0.0 |
18.2 |
|
SOY OIL |
20.9 |
246.1 |
186.7 |
23.6 |
180.7 |
240.9 |
0.0 |
0.6 |
|
RICE |
|
|
|
|
|
|
|
|
|
L G RGH |
36.2 |
272.9 |
328.5 |
28.5 |
687.1 |
618.4 |
0.0 |
0.0 |
|
M S RGH |
0.0 |
17.3 |
15.4 |
1.0 |
11.6 |
15.4 |
0.0 |
0.0 |
|
L G BRN |
8.2 |
10.9 |
22.4 |
1.3 |
20.6 |
17.8 |
0.0 |
0.0 |
|
M&S BR |
44.6 |
61.3 |
52.2 |
0.4 |
33.9 |
6.8 |
0.0 |
0.0 |
|
L G MLD |
12.5 |
88.8 |
193.4 |
10.5 |
229.5 |
444.2 |
0.0 |
0.0 |
|
M S MLD |
10.1 |
181.5 |
150.6 |
37.0 |
187.0 |
239.0 |
0.0 |
0.0 |
|
TOTAL |
111.5 |
632.7 |
762.5 |
78.6 |
1,169.8 |
1,341.6 |
0.0 |
0.0 |
|
COTTON |
|
THOUSAND RUNNING BALES |
||||||
|
UPLAND |
416.7 |
6,118.9 |
7,527.3 |
281.2 |
4,987.8 |
3,700.9 |
67.1 |
780.8 |
|
PIMA |
30.9 |
223.9 |
172.5 |
13.9 |
314.5 |
160.8 |
0.0 |
0.7 |
Terry Reilly
Senior Commodity Analyst – Grain and Oilseeds
Futures International
One Lincoln Center
18 W 140 Butterfield Rd.
Oakbrook Terrace, Il. 60181
W: 312.604.1366
ICE IM: treilly1
Skype: fi.treilly

Trading of futures, options, swaps and other derivatives is risky and is not suitable for all persons. All of these investment products are leveraged, and you can lose more than your initial deposit. Each investment product is offered only to and from jurisdictions where solicitation and sale are lawful, and in accordance with applicable laws and regulations in such jurisdiction. The information provided here should not be relied upon as a substitute for independent research before making your investment decisions. Futures International, LLC is merely providing this information for your general information and the information does not take into account any particular individual’s investment objectives, financial situation, or needs. All investors should obtain advice based on their unique situation before making any investment decision. The contents of this communication and any attachments are for informational purposes only and under no circumstances should they be construed as an offer to buy or sell, or a solicitation to buy or sell any future, option, swap or other derivative. The sources for the information and any opinions in this communication are believed to be reliable, but Futures International, LLC does not warrant or guarantee the accuracy of such information or opinions. Futures International, LLC and its principals and employees may take positions different from any positions described in this communication. Past results are not necessarily indicative of future results.