PDF attached
USDA Export Sales
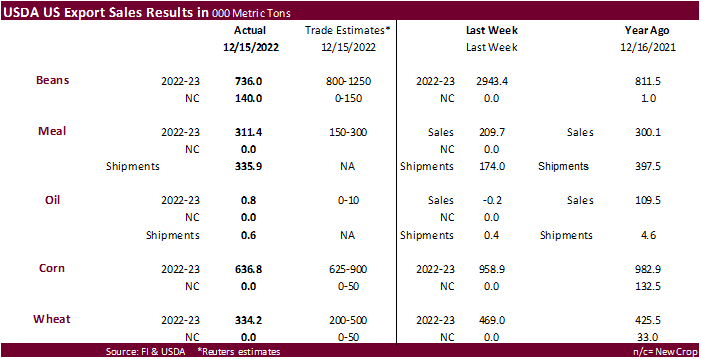
USDA export sales favors soybean meal over soybean oil. Grains were within expectations. USDA export sales for soybeans of 736,000 tons old crop and 140,000 tons new crop was down considerably from the previous week. 2022-23 sales for China were 550,700 tons, but that included 252,000 tons switched from unknown. Soybean meal sales improved to 311,400 tons, above expectations, and were primarily to North America and Central America destinations. Soybean meal shipments were good at 335,900 tons. Soybean oil sales were only 800 tons. Corn export sales of 636,800 tons were near the low end of expectations and included 484,300 tons for Mexico. All-wheat sales of 334,200 tons were within expectations but down from 469,000 tons previous week.
U.S. EXPORT SALES FOR WEEK ENDING 12/15/2022
|
|
CURRENT MARKETING YEAR |
NEXT MARKETING YEAR |
||||||
|
COMMODITY |
NET SALES |
OUTSTANDING SALES |
WEEKLY EXPORTS |
ACCUMULATED EXPORTS |
NET SALES |
OUTSTANDING SALES |
||
|
CURRENT YEAR |
YEAR AGO |
CURRENT YEAR |
YEAR AGO |
|||||
|
|
THOUSAND METRIC TONS |
|||||||
|
WHEAT |
|
|
|
|
|
|
|
|
|
HRW |
94.4 |
946.3 |
2,213.3 |
37.7 |
3,008.2 |
3,978.3 |
0.0 |
6.3 |
|
SRW |
18.2 |
595.9 |
727.0 |
15.8 |
1,713.6 |
1,555.3 |
0.0 |
13.6 |
|
HRS |
87.6 |
1,356.4 |
1,262.7 |
102.4 |
3,030.1 |
2,913.5 |
0.0 |
10.8 |
|
WHITE |
113.0 |
1,189.9 |
893.2 |
79.5 |
2,362.4 |
1,958.2 |
0.0 |
0.3 |
|
DURUM |
21.0 |
112.7 |
36.2 |
0.0 |
129.1 |
97.2 |
0.0 |
0.0 |
|
TOTAL |
334.2 |
4,201.1 |
5,132.4 |
235.3 |
10,243.5 |
10,502.6 |
0.0 |
31.0 |
|
BARLEY |
0.0 |
5.2 |
19.7 |
0.9 |
6.5 |
10.7 |
0.0 |
0.0 |
|
CORN |
636.8 |
12,417.0 |
26,748.1 |
958.7 |
8,222.6 |
12,746.3 |
0.0 |
969.0 |
|
SORGHUM |
0.6 |
184.6 |
3,737.6 |
1.2 |
176.4 |
1,364.6 |
0.0 |
0.0 |
|
SOYBEANS |
736.0 |
17,544.7 |
13,647.8 |
1,989.5 |
24,928.4 |
27,147.4 |
140.0 |
180.0 |
|
SOY MEAL |
311.4 |
3,590.9 |
3,282.4 |
335.9 |
2,265.3 |
2,743.0 |
0.0 |
18.3 |
|
SOY OIL |
0.8 |
18.4 |
290.2 |
0.6 |
12.9 |
138.3 |
0.0 |
0.6 |
|
RICE |
|
|
|
|
|
|
|
|
|
L G RGH |
20.0 |
168.1 |
167.3 |
9.2 |
144.8 |
579.1 |
0.0 |
0.0 |
|
M S RGH |
2.0 |
14.0 |
6.3 |
0.9 |
12.9 |
2.9 |
0.0 |
0.0 |
|
L G BRN |
0.4 |
7.7 |
3.8 |
0.3 |
7.1 |
26.6 |
0.0 |
0.0 |
|
M&S BR |
0.0 |
9.1 |
68.5 |
0.5 |
5.6 |
15.1 |
0.0 |
0.0 |
|
L G MLD |
4.3 |
57.9 |
80.1 |
45.7 |
262.0 |
342.8 |
0.0 |
0.0 |
|
M S MLD |
40.4 |
132.2 |
80.0 |
2.3 |
95.8 |
148.9 |
0.0 |
0.0 |
|
TOTAL |
67.2 |
389.0 |
406.0 |
58.8 |
528.2 |
1,115.3 |
0.0 |
0.0 |
|
COTTON |
|
THOUSAND RUNNING BALES |
||||||
|
UPLAND |
-87.8 |
5,031.0 |
7,488.2 |
110.4 |
3,633.5 |
2,769.7 |
1.0 |
1,199.6 |
|
PIMA |
1.5 |
68.0 |
234.7 |
8.1 |
47.1 |
130.6 |
0.0 |
1.1 |
This summary is based on reports from exporters for the period December 9-15, 2022.
Wheat: Net sales of 334,200 metric tons (MT) for 2022/2023 primarily for unknown destinations (86,000 MT), Japan (65,900 MT, including the decreases of 900 MT), Thailand (55,000 MT), Mexico (34,100 MT, including decreases of 100 MT), and the Philippines (29,000 MT), were offset by reductions primarily for the Dominican Republic (17,000 MT). Exports of 235,300 MT were primarily to South Korea (90,600 MT), Japan (65,800 MT), Mexico (39,800 MT), Honduras (20,000 MT), and Trinidad and Tobago (18,700 MT).
Corn: Net sales of 636,800 MT for 2022/2023 primarily for Mexico (484,300 MT, including decreases of 15,400 MT), Japan (42,900 MT, including 19,300 MT switched from unknown destinations and decreases of 600 MT), El Salvador (40,700 MT, including 7,000 MT switched from Guatemala), Honduras (24,100 MT, including decreases of 700 MT), and Taiwan (20,000 MT), were offset by reductions primarily for unknown destinations (16,300 MT), Guatemala (7,000 MT), and the Dominican Republic (4,000 MT). Exports of 958,700 MT were primarily to China (415,300 MT), Mexico (359,700 MT), Japan (88,200 MT), Colombia (52,900 MT), and Nicaragua (15,500 MT).
Barley: No net sales were reported for the week. Exports of 900 MT were to Japan.
Sorghum: Total net sales of 600 MT for 2022/2023 were for Mexico. Exports of 1,200 MT were to Mexico.
Rice: Net sales of 67,200 MT for 2022/2023 were primarily for Japan (39,000 MT), Mexico (10,400 MT, including decreases of 100 MT), Honduras (9,000 MT), Iraq (4,000 MT), and Jordan (2,000 MT). Exports of 58,800 MT were primarily to Iraq (44,000 MT), Honduras (9,000 MT), Mexico (1,600 MT), Canada (1,600 MT), and South Korea (1,000 MT).
Soybeans: Net sales of 736,000 MT for 2022/2023 primarily for China (550,700 MT, including 252,000 MT switched from unknown destinations and decreases of 9,700 MT), Spain (83,100 MT, including 71,000 MT switched from unknown destinations), unknown destinations (35,300 MT), Japan (33,100 MT, including 30,000 MT switched from unknown destinations and decreases of 1,900 MT), and Mexico (14,300 MT, including decreases of 80,800 MT), were offset by reductions for Portugal (15,800 MT), Colombia (2,100 MT), and Israel (2,000 MT). Total net sales of 140,000 MT for 2023/2024 were for unknown destinations. Exports of 1,989,500 MT were primarily to China (1,480,400 MT), Mexico (177,100 MT), Spain (149,100 MT), Japan (66,300 MT), and Israel (27,500 MT).
Optional Origin Sales: For 2022/2023, the current outstanding balance of 300 MT, all South Korea.
Export for Own Account: For 2022/2023, the current exports for own account outstanding balance is 1,500 MT, all Canada.
Soybean Cake and Meal: Net sales of 311,400 MT for 2022/2023 primarily for Venezuela (56,300 MT, including 20,000 MT switched from unknown destinations and decreases of 600 MT), Mexico (37,800 MT), Ecuador (36,000 MT), Canada (33,800 MT, including decreases of 300 MT), and the United Kingdom (30,000 MT), were offset by reductions primarily for Denmark (15,000 MT) and El Salvador (5,300 MT). Exports of 335,900 MT were primarily to Vietnam (54,000 MT), the Philippines (49,100 MT), Chile (48,000 MT), Venezuela (34,800 MT), and Mexico (33,200 MT).
Soybean Oil: Total net sales of 800 MT for 2022/2023 were for Canada. Exports of 600 MT were to Canada.
Cotton: Net sales reductions of 87,800 RB for 2022/2023 resulting in increases for Vietnam (37,200 RB, including 3,500 RB switched from Taiwan, 1,300 RB switched from China, and 300 RB switched from Japan), India (9,000 RB), Pakistan (6,800 RB), Japan (5,900 RB), and Indonesia (5,600 RB, including 200 RB switched from Japan), were more than offset by reductions primarily for China (144,400 RB). Net sales of 1,000 RB for 2023/2024 were reported for Bangladesh (600 RB) and Mexico (400 RB). Exports of 110,400 RB were primarily to China (29,900 RB), Pakistan (28,200 RB), Mexico (11,900 RB), Guatemala (6,600 RB), and Bangladesh (6,500 RB). Net sales of Pima totaling 1,500 RB were reported for Vietnam (900 RB), Thailand (400 RB), China (100 RB), and Japan (100 RB). Exports of 8,100 RB were primarily to India (3,500 RB), Peru (1,700 RB), China (1,000 RB), Egypt (900 RB), and Vietnam (400 RB).
Optional Origin Sales: For 2022/2023, the current outstanding balance of 9,300 RB, all Malaysia.
Export for Own Account: For 2022/2023, new exports for own account totaling 10,700 RB were to China. Exports for own account totaling 3,400 RB to Pakistan (2,200 RB) and Vietnam (1,200 RB) were applied to new or outstanding sales. The current exports for own account outstanding balance of 125,400 RB are for China (88,000 RB), Vietnam (22,700 RB), Pakistan (12,800 RB), India (1,500 RB), and Indonesia (400 RB).
Hides and Skins: Net sales of 325,300 pieces for 2022 primarily for China (269,600 whole cattle hides, including decreases of 16,000 pieces), South Korea (30,700 whole cattle hides, including decreases of 1,500 pieces), Mexico (24,200 whole cattle hides, including decreases of 2,600 pieces), Turkey (6,800 whole cattle hides), and Colombia (2,200 whole cattle hides), were offset by reductions primarily for Vietnam (1,900 pieces), India (1,800 pieces), and Taiwan (1,800 pieces). Total net sales reductions of 2,100 calf skins were for China. In addition, net sales reductions of 1,700 kip skins were for China (1,300 kip skins) and Belgium (400 kip skins). Net sales of 214,200 pieces for 2023 were primarily for China (149,800 whole cattle hides). In addition, total net sales of 2,200 calf skins were for China. Exports of 437,000 whole cattle hides exports were primarily to China (295,300 pieces), South Korea (50,400 pieces), Mexico (39,900 pieces), Thailand (14,700 pieces), and Brazil (11,500 pieces). In addition, exports of 3,800 kip skins were to Belgium (2,500 pieces) and China (1,300 pieces).
Net sales of 172,800 wet blues for 2022 primarily for Italy (140,500 unsplit, including decreases of 100 unsplit), Thailand (15,700 unsplit), Vietnam (7,200 unsplit), Hong Kong (4,000 unsplit), and South Korea (3,600 grain splits), were offset by reductions for India (2,000 grain splits) and China (300 unsplit). Net sales reductions of 4,900 wet blues for 2023 resulting in increases for China (8,200 unsplit), Thailand (7,000 unsplit), and India (2,000 grain splits), were more than offset by reductions for Italy (14,100 unsplit), Hong Kong (4,000 unsplit), Taiwan (1,200 unsplit), and the Dominican Republic (800 unsplit). Exports of 98,500 wet blues were primarily to Italy (48,700 unsplit), China (17,600 unsplit), Vietnam (14,400 unsplit), Thailand (6,500 unsplit), and South Korea (3,600 grain splits). Net sales of 251,600 splits were reported for Vietnam (207,600 pounds, including decreases of 4,300 pounds) and China (44,000 pounds). Net sales reductions of 4,200 splits for 2023 resulting in increases for South Korea (1,600 pounds), were more than offset by reductions for Vietnam (5,800 pounds). Exports of 157,000 splits were to Vietnam.
Beef: Net sales of 4,500 MT for 2022 primarily for Japan (3,500 MT, including decreases of 400 MT), South Korea (600 MT, including decreases of 1,200 MT), Mexico (500 MT, including decreases of 200 MT), Guatemala (100 MT), and Singapore (100 MT), were offset by reductions primarily for Hong Kong (400 MT) and the Philippines (200 MT). Net sales of 7,200 MT for 2023 were primarily for Japan (2,600 MT), China (2,000 MT), Mexico (800 MT), Hong Kong (700 MT), and Taiwan (500 MT). Exports of 17,700 MT were primarily to South Korea (5,400 MT), Japan (5,300 MT), Mexico (1,900 MT), China (1,700 MT), and Canada (1,100 MT).
Pork: Net sales of 58,700 MT for 2022 primarily for Mexico (33,400 MT, including decreases of 300 MT), Japan (9,900 MT, including decreases of 700 MT), Canada (4,600 MT, including decreases of 300 MT), Australia (4,000 MT), and South Korea (3,200 MT, including decreases of 1,200 MT), were offset by reductions for China (2,100 MT). Net sales of 16,100 MT for 2023 were primarily for China (4,800 MT), South Korea (3,200 MT), Mexico (2,500 MT), Japan (2,200 MT), and Canada (1,200 MT). Exports of 32,400 MT were primarily to Mexico (15,700 MT), China (4,200 MT), Japan (3,900 MT), South Korea (2,700 MT), and Canada (1,600 MT).
December 22, 2022 1 FOREIGN AGRICULTURAL SERVICE/USDA
Terry Reilly
Senior Commodity Analyst – Grain and Oilseeds
Futures International
One Lincoln Center
18 W 140 Butterfield Rd.
Oakbrook Terrace, Il. 60181
W: 312.604.1366
ICE IM: treilly1
Skype: fi.treilly

Trading of futures, options, swaps and other derivatives is risky and is not suitable for all persons. All of these investment products are leveraged, and you can lose more than your initial deposit. Each investment product is offered only to and from jurisdictions where solicitation and sale are lawful, and in accordance with applicable laws and regulations in such jurisdiction. The information provided here should not be relied upon as a substitute for independent research before making your investment decisions. Futures International, LLC is merely providing this information for your general information and the information does not take into account any particular individual’s investment objectives, financial situation, or needs. All investors should obtain advice based on their unique situation before making any investment decision. The contents of this communication and any attachments are for informational purposes only and under no circumstances should they be construed as an offer to buy or sell, or a solicitation to buy or sell any future, option, swap or other derivative. The sources for the information and any opinions in this communication are believed to be reliable, but Futures International, LLC does not warrant or guarantee the accuracy of such information or opinions. Futures International, LLC and its principals and employees may take positions different from any positions described in this communication. Past results are not necessarily indicative of future results.