PDF attached
This morning Reuters reported Russia is considering imposing a grain export quota and wheat export tax.
USDA export sales
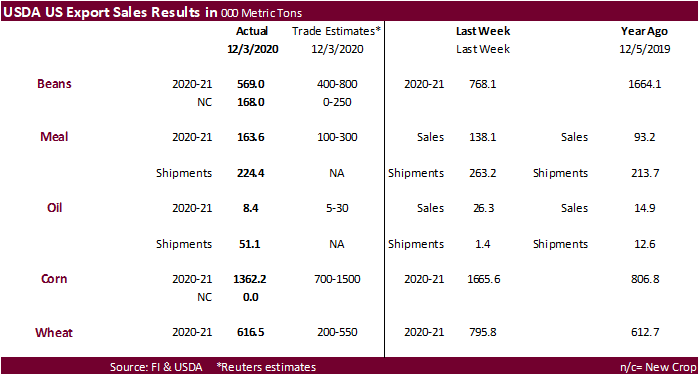
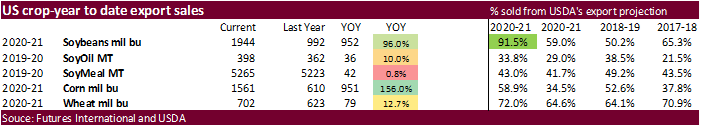
- USDA soybean export sales were a low 569,000 tons, down from 768,100 tons previous week and 1.664 million tons year ago. China booked 685,400 tons but 459,000 tons of that was switched from unknown.
- Soybean meal sales were also low at 163,600 tons (shipments 224,400 tons) and soybean oil sales were only 8,400 tons, down from 26,300 tons previous week. SBO shipments were very good at 51,100 tons and included 34,600 for South Korea and 10,600 tons for China.
- USDA corn export sales were 1.362 million tons, within expectations and down from 1.666 million previous week. Corn sales included 141,200 tons for China and 422,200 tons for unknown.
- USDA sorghum export sales came in at 123,000 tons and included 67,900 tons for China.
- Pork sales were 26,500 tons and included 6,300 tons for China.
- USDA all-wheat export sales of 616,500 tons were down slightly from 795,800 tons previous week. China booked 68,300 tons of wheat.
U.S. EXPORT SALES FOR WEEK ENDING 12/3/2020
|
|
CURRENT MARKETING YEAR |
NEXT MARKETING YEAR |
||||||
|
COMMODITY |
NET SALES |
OUTSTANDING SALES |
WEEKLY EXPORTS |
ACCUMULATED EXPORTS |
NET SALES |
OUTSTANDING SALES |
||
|
CURRENT YEAR |
YEAR |
CURRENT YEAR |
YEAR |
|||||
|
|
THOUSAND METRIC TONS |
|||||||
|
WHEAT |
|
|
|
|
|
|
|
|
|
HRW |
257.2 |
1,595.7 |
1,284.3 |
192.0 |
5,141.4 |
4,921.7 |
0.0 |
22.0 |
|
SRW |
29.3 |
400.7 |
525.4 |
22.3 |
1,022.8 |
1,455.0 |
0.0 |
100.0 |
|
HRS |
127.5 |
1,475.3 |
1,302.8 |
172.9 |
3,767.7 |
3,468.7 |
0.0 |
45.0 |
|
WHITE |
181.7 |
2,559.4 |
935.6 |
125.4 |
2,559.3 |
2,384.9 |
0.0 |
20.0 |
|
DURUM |
20.9 |
153.1 |
139.0 |
40.1 |
433.1 |
540.7 |
0.0 |
0.0 |
|
TOTAL |
616.5 |
6,184.2 |
4,187.1 |
552.6 |
12,924.2 |
12,771.0 |
0.0 |
187.0 |
|
BARLEY |
0.0 |
28.9 |
32.6 |
1.5 |
13.9 |
26.1 |
0.0 |
0.0 |
|
CORN |
1,362.2 |
28,567.5 |
8,613.3 |
715.0 |
11,087.8 |
6,875.8 |
0.0 |
747.0 |
|
SORGHUM |
123.0 |
3,376.8 |
701.1 |
1.9 |
1,277.4 |
258.4 |
0.0 |
327.0 |
|
SOYBEANS |
569.0 |
23,088.9 |
9,563.3 |
2,691.3 |
29,817.7 |
17,431.2 |
168.0 |
237.0 |
|
SOY MEAL |
163.6 |
3,132.1 |
3,243.5 |
224.4 |
2,132.7 |
1,979.1 |
0.0 |
18.1 |
|
SOY OIL |
8.4 |
247.0 |
152.0 |
51.1 |
151.4 |
210.2 |
0.0 |
0.6 |
|
RICE |
|
|
|
|
|
|
|
|
|
L G RGH |
19.0 |
262.7 |
335.1 |
2.1 |
533.3 |
566.0 |
0.0 |
0.0 |
|
M S RGH |
0.0 |
18.5 |
15.8 |
0.9 |
10.4 |
15.0 |
0.0 |
0.0 |
|
L G BRN |
0.1 |
10.2 |
24.0 |
0.3 |
12.0 |
15.7 |
0.0 |
0.0 |
|
M&S BR |
0.1 |
16.0 |
56.9 |
0.2 |
33.5 |
2.0 |
0.0 |
0.0 |
|
L G MLD |
42.5 |
79.1 |
223.4 |
11.5 |
209.3 |
383.2 |
0.0 |
0.0 |
|
M S MLD |
4.3 |
196.3 |
189.3 |
3.6 |
143.4 |
178.5 |
0.0 |
0.0 |
|
TOTAL |
66.0 |
582.8 |
844.5 |
18.7 |
941.8 |
1,160.3 |
0.0 |
0.0 |
|
COTTON |
|
THOUSAND RUNNING BALES |
||||||
|
UPLAND |
403.0 |
5,813.7 |
7,558.1 |
323.2 |
4,455.3 |
3,285.6 |
48.0 |
699.9 |
|
PIMA |
13.0 |
222.5 |
159.0 |
26.4 |
277.4 |
140.7 |
0.0 |
0.7 |
This summary is based on reports from exporters for the period November 27-December 3, 2020.
Wheat: Net sales of 616,500 metric tons (MT) for 2020/2021 were up 38 percent from the previous week and 42 percent from the prior 4-week average. Increases primarily for Mexico (107,300 MT), unknown destinations (104,000 MT), Japan (88,700 MT, including decreases of 200 MT), Thailand (86,500 MT), and China (68,300 MT), were offset by reductions primarily for Algeria (2,400 MT). Exports of 552,600 MT were up 22 percent from the previous week and 56 percent from the prior 4-week average. The destinations were primarily to Japan (90,700 MT), Mexico (73,300 MT), China (68,300 MT), the Philippines (66,000 MT), and Thailand (54,800 MT).
Optional Origin Sales: For 2020/2021, the current outstanding balance of 10,000 MT, all Spain.
Corn: Net sales of 1,362,200 MT for 2020/2021 were down 1 percent from the previous week, but up 7 percent from the prior 4-week average. Increases primarily for unknown destinations (422,200 MT), Mexico (408,100 MT, including decreases of 21,800 MT), China (141,200 MT), Chile (90,000 MT), and South Korea (66,600 MT), were offset by reductions primarily for El Salvador (15,800 MT). Exports of 715,000 MT were down 33 percent from the previous week and 19 percent from the prior 4-week average. The destinations were primarily to China (271,300 MT), Mexico (261,200 MT), Saudi Arabia (71,500 MT), Costa Rica (58,900 MT), and Taiwan (21,900 MT).
Optional Origin Sales: For 2020/2021, new optional origin sales of 65,000 MT were reported for South Korea. The current outstanding balance of 1,548,400 MT is for South Korea (834,000 MT), unknown destinations (224,000 MT), Taiwan (205,000 MT), Vietnam (130,000 MT), China (65,000 MT), Japan (58,000 MT), and Ukraine (32,400 MT).
Barley: No net sales were reported for the week. Exports of 1,500 MT were to Japan.
Sorghum: Net sales of 123,000 MT for 2020/2021 were down 49 percent from the previous week and 45 percent from the prior 4-week average. Increases were primarily for China (67,900 MT, including decreases of 100 MT) and unknown destinations (55,000 MT). Exports of 1,900 MT were down 99 percent from the previous week and from the prior 4-week average. The destination was China.
Rice: Net sales of 66,000 MT for 2020/2021 were down 8 percent from the previous week, but up 15 percent from the prior 4-week average. Increases were primarily for Haiti (38,000 MT), Mexico (20,000 MT), Jordan (2,000 MT), Saudi Arabia (1,800 MT), and Canada (1,500 MT). Exports of 18,700 MT were down 87 percent from the previous week and 83 percent from the prior 4-week average. The destinations were primarily to Haiti (7,200 MT), Mexico (3,400 MT), Saudi Arabia (2,200 MT), Canada (2,100 MT), and Jordan (1,400 MT).
Export Adjustments: Accumulated exports of medium brown rice to South Korea were adjusted down 1,040 MT for weekend October 8th. This shipment was reported in error.
Soybeans: Net sales of 569,000 MT for 2020/2021 were up 40 percent from the previous week, but down 42 percent from the prior 4-week average. Increases primarily for China (685,400 MT, including 459,000 switched from unknown destinations and decreases of 6,500 MT), Mexico (178,600 MT, including decreases of 700 MT), Thailand (103,800 MT, including 70,000 MT switched from unknown destinations), the Netherlands (95,200 MT, including 84,000 MT switched from unknown destinations), and Egypt (86,100 MT, including 55,000 MT switched from unknown destinations, 27,700 MT switched from Canada, and decreases of 200 MT), were offset by reductions primarily for unknown destinations (715,200 MT). For 2021/2022, net sales of 168,000 MT were for China (126,000 MT) and unknown destinations (42,000 MT). Exports of 2,691,300 MT were up 8 percent from the previous week and 2 percent from the prior 4-week average. The destinations were primarily to China (1,899,100 MT, including 134,800 MT late – see below), Egypt (256,100 MT), the Netherlands (115,200 MT), Thailand (109,000 MT), and Tunisia (63,200 MT).
Optional Origin Sales: For 2020/2021, the current outstanding balance of 63,000 MT, all China.
Exports for Own Account: For 2020/2021, new exports for own account totaling 25,300 MT were to Canada. The current exports for own account outstanding balance is 109,600 MT, all Canada.
Late Reporting: For 2020/2021, exports totaling 134,800 MT were reported late. These exports were for China.
Soybean Cake and Meal: Net sales of 163,600 MT for 2020/2021, resulting in increases primarily for Morocco (43,000 MT), Colombia (22,000 MT), Canada (17,700 MT, including decreases of 100 MT), Mexico (16,500 MT), and Venezuela (14,000 MT), were offset by reductions primarily for Trinidad and Tobago (500 MT). Exports of 224,400 MT were primarily to the Philippines (75,000 MT), Bangladesh (49,500 MT), Peru (31,400 MT), Canada (30,500 MT), and Mexico (16,900 MT).
Soybean Oil: Net sales of 8,400 MT for 2020/2021, primarily for South Korea (11,600 MT, including 1,600 MT switched from China), Belgium (100 MT), and Mexico (100 MT), were offset by reductions for Guatemala (2,000 MT), Canada (800 MT), China (400 MT), and Honduras (100 MT). Exports of 51,100 MT were primarily to the South Korea (34,600 MT), China (10,600 MT), Guatemala (4,500 MT), Honduras (900 MT), and Canada (400) MT).
Cotton: Net sales of 403,000 RB for 2020/2021 were up 45 percent from the previous week and 61 percent from the prior 4-week average. Increases primarily for China (159,100 RB, including 3,000 RB switched from Hong Kong), Pakistan (75,900 RB), Vietnam (35,800 RB, including 2,000 RB switched from China), Indonesia (26,800 RB), and Thailand (21,600 RB, including 3,000 RB switched from Vietnam, 1,900 RB switched from Indonesia, 700 RB switched from Japan, and decreases of 600 RB), were offset by reductions for Hong Kong (2,000 RB). For 2021/2022, net sales of 48,000 RB reported for Pakistan (44,000 RB), Vietnam (6,600 RB), Mexico (6,500 RB), Costa Rica (2,400 RB), and Turkey (1,800 RB), were offset by reductions for China (13,200 RB). Exports of 323,200 RB were up 79 percent from the previous week and 38 percent from the prior 4-week average. Exports were primarily to China (167,100 RB), Pakistan (52,300 RB), Vietnam (36,800 RB), Mexico (17,000 RB), and Bangladesh (9,600 RB). Net sales of Pima totaling 13,000 RB were up 66 percent from the previous week, but down 13 percent from the prior 4-week average. Increases primarily for Vietnam (6,800 RB), India (2,300 RB), Egypt (2,000 RB), Thailand (900 RB, including 400 RB switched from Malaysia), and Austria (900 RB, switched from Switzerland), were offset by reductions for Switzerland (900 RB). Exports of 26,400 RB were down 5 percent from the previous week, but up 17 percent from the prior 4-week average. The destinations were primarily to India (7,900 RB), China (6,000 RB), Pakistan (2,800 RB), Italy (1,900 RB), and Bangladesh (1,500 RB).
Exports for Own Account: For 2020/2021, new exports for own account totaling 8,500 RB were to China. Exports for own account totaling 20,900 RB to China (20,800 RB) and Vietnam (100 RB) were applied to new or outstanding sales. The current exports for own account outstanding balance of 29,500 RB is for China (28,200 RB), Bangladesh (1,000 RB), and Indonesia (300 RB).
Hides and Skins: Net sales of 332,800 pieces for 2020 were up 25 percent from the previous week and 3 percent from the prior 4-week average. Increases primarily for China (180,800 whole cattle hides, including decreases of 25,600 pieces), South Korea (75,700 whole cattle hides, including decreases of 1,300 pieces), Mexico (43,400 whole cattle hides, including decreases of 1,900 pieces), Thailand (30,700 whole cattle hides, including decreases of 100 pieces), and Brazil (5,100 whole cattle hides, including decreases of 1,400 pieces), were offset by reductions for Indonesia (400 pieces). Additionally, total net sales reductions of 12,000 calf skins were for Italy. Net sales of 7,700 kip skins were reported for Belgium (5,600 kip skins) and Italy (2,100 kip skins). For 2021, net sales of 87,400 pieces were primarily for China (35,600 whole cattle hides), Indonesia (22,900 whole cattle hides), and Taiwan (19,000 whole cattle hides). Additionally, total net sales of 9,500 calf skins were reported for Italy. Net sales of 11,200 kip skins were reported for Belgium. Exports of 368,300 pieces reported for 2020 were up 19 percent from the previous week and 2 percent from the prior 4-week average. Whole cattle hides exports were primarily to China (266,500 pieces), South Korea (44,100 pieces), Mexico (35,100 pieces), Brazil (6,300 pieces), and Indonesia (3,800 pieces).
Net sales of 99,500 wet blues for 2020 were down 56 percent from the previous week, but up 3 percent from the prior 4-week average. Increases were primarily for China (61,400 unsplit and 4,900 grain splits), Vietnam (11,900 unsplit, including decreases of 100 unsplit), Taiwan (4,800 unsplit and 200 grain splits), Mexico (3,400 unsplit and 1,200 grain splits), and Thailand (4,400 unsplit, including decreases of 400 unsplit). Exports of 104,700 wet blues for 2020 were down 6 percent from the previous week and 8 percent from the prior 4-week average. The destinations were primarily to Vietnam (38,000 unsplit), China (24,600 unsplit and 200 grain splits), Thailand (14,400 unsplit), Italy (8,000 unsplit and 3,800 grain splits), and South Korea (5,200 grain splits). Net sales of 86,100 splits were reported for China (86,000 pounds) and Vietnam (100 pounds). Exports of 159,700 pounds were to Vietnam (118,700 pounds) and China (41,000 pounds).
Beef: Net sales of 3,000 MT reported for 2020 were down 78 percent from the previous week and 80 percent from the prior 4-week average. Increases primarily for Japan (3,300 MT, including decreases of 400 MT), Mexico (1,700 MT, including decreases of 100 MT), Canada (1,300 MT), China (800 MT, including decreases of 300 MT), and Indonesia (400 MT), were offset by reductions primarily for South Korea (4,600 MT) and Hong Kong (1,000 MT). For 2021, net sales of 12,000 MT were primarily for South Korea (7,200 MT), Japan (1,600 MT), Hong Kong (1,200 MT), China (1,000 MT), and Mexico (900 MT). Exports of 18,200 MT were up 10 percent from the previous week, but unchanged from the prior 4-week average. The destinations were primarily to Japan (5,100 MT), South Korea (4,400 MT), Mexico (2,600 MT), China (1,800 MT), and Hong Kong (1,400 MT).
Pork: Net sales of 26,500 MT reported for 2020 were down 15 percent from the previous week and 13 percent from the prior 4-week average. Increases primarily for Mexico (10,400 MT, including decreases of 900 MT), China (6,300 MT, including decreases of 1,900 MT), Japan (5,500 MT, including decreases of 200 MT), South Korea (900 MT, including decreases of 1,200 MT), and Australia (900 MT, including decreases of 400 MT), were offset by reductions primarily for Nicaragua (200 MT). For 2021, net sales of 6,400 MT were primarily for South Korea (1,700 MT), Japan (1,200 MT), Colombia (900 MT), the Dominican Republic (700 MT), and China (500 MT). Exports of 42,000 MT were up 23 percent from the previous week and 11 percent from the prior 4-week average. The destinations were primarily to China (13,300 MT), Mexico (13,200 MT), Japan (5,200 MT), South Korea (3,100 MT), and Canada (2,200 MT).
Terry Reilly
Senior Commodity Analyst – Grain and Oilseeds
Futures International
One Lincoln Center
18 W 140 Butterfield Rd.
Oakbrook Terrace, Il. 60181
W: 312.604.1366
ICE IM: treilly1
Skype: fi.treilly

Trading of futures, options, swaps and other derivatives is risky and is not suitable for all persons. All of these investment products are leveraged, and you can lose more than your initial deposit. Each investment product is offered only to and from jurisdictions where solicitation and sale are lawful, and in accordance with applicable laws and regulations in such jurisdiction. The information provided here should not be relied upon as a substitute for independent research before making your investment decisions. Futures International, LLC is merely providing this information for your general information and the information does not take into account any particular individual’s investment objectives, financial situation, or needs. All investors should obtain advice based on their unique situation before making any investment decision. The contents of this communication and any attachments are for informational purposes only and under no circumstances should they be construed as an offer to buy or sell, or a solicitation to buy or sell any future, option, swap or other derivative. The sources for the information and any opinions in this communication are believed to be reliable, but Futures International, LLC does not warrant or guarantee the accuracy of such information or opinions. Futures International, LLC and its principals and employees may take positions different from any positions described in this communication. Past results are not necessarily indicative of future results.