PDF attached
US Initial Jobless Claims Nov-28: 712K (exp 775K; R prev 787K)
– Continuing Claims Nov-21: 5520K (exp 5800K; R prev 6089K)
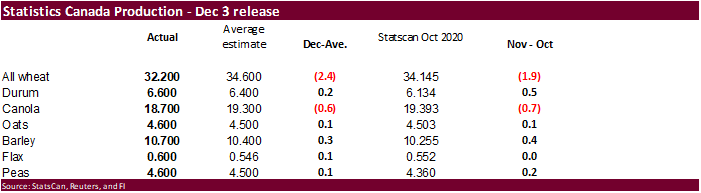
Wheat may find support from a lower than expected Canadian production forecast.
USDA export sales were on the lower end of expectations for the soybean complex, withing for corn and wheat. Sorghum sales of 238,600 tons were very good with China taking most of it. Pork sales were 31,300 tons.
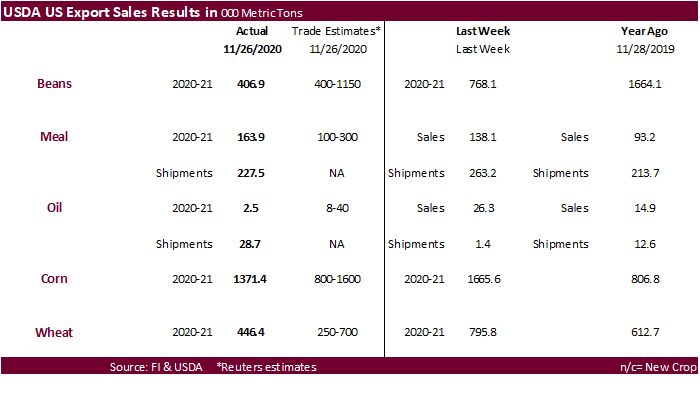
This summary is based on reports from exporters for the period November 20-26, 2020.
Wheat: Net sales of 446,400 metric tons (MT) for 2020/2021 were down 44 percent from the previous week and 5 percent from the prior 4-week average. Increases primarily for Mexico (89,400 MT), Taiwan (83,100 MT), South Korea (81,300 MT, including decreases of 1,500 MT), Indonesia (68,200 MT, including decreases of 900 MT), and unknown destinations (47,000 MT), were offset by reductions primarily for Venezuela (11,000 MT) and the Dominican Republic (6,800 MT). Exports of 451,500 MT were up 32 percent from the previous week and 40 percent from the prior 4-week average. The destinations were primarily to the Philippines (120,800 MT), China (63,000 MT), Indonesia (60,600 MT), Mexico (57,500 MT), and Honduras (34,300 MT). Optional Origin Sales: For 2020/2021, the current outstanding balance of 10,000 MT, all Spain.
Corn: Net sales of 1,371,400 MT for 2020/2021 were down 18 percent from the previous week and 14 percent from the prior 4-week average. Increases primarily for Mexico (656,900 MT, including 30,000 MT switched from unknown destinations and decreases of 9,700 MT), unknown destinations (351,400 MT), China (154,800 MT), Japan (138,800 MT, including 32,100 MT switched from unknown destinations), and South Korea (62,600 MT), were offset by reductions primarily for Colombia (90,000 MT) and Guatemala (13,100 MT). Exports of 1,072,300 MT–a marketing-year high–were up 23 percent from the previous week and 35 percent from the prior 4-week average. The destinations were primarily to China (475,800 MT), Mexico (312,300 MT), Japan (82,300 MT), Guatemala (59,500 MT), and Honduras (49,700 MT).
Optional Origin Sales: For 2020/2021, new optional origin sales of 60,000 MT were reported for unknown destinations. Decreases totaling 31,300 MT were reported for Ukraine (27,700 MT) and unknown destinations (3,600 MT). The current outstanding balance of 1,483,400 MT is for South Korea (769,000 MT), unknown destinations (224,000 MT), Taiwan (205,000 MT), Vietnam (130,000 MT), China (65,000 MT), Japan (58,000 MT), and Ukraine (32,400 MT).
Barley: No net sales or exports were reported for the week.
Sorghum: Net sales of 238,600 MT for 2020/2021 were down 33 percent from the previous week and 6 percent from the prior 4-week average. Increases primarily for China (276,600 MT, including 106,000 MT switched from unknown destinations and decreases of 77,600 MT), were offset by reductions for unknown destinations (38,000 MT). Exports of 213,700 MT were up 77 percent from the previous week and 58 percent from the prior 4-week average. The destination was China.
Rice: Net sales of 71,700 MT for 2020/2021 were up 3 percent from the previous week and 54 percent from the prior 4-week average. Increases were primarily for Mexico (36,700 MT), Haiti (14,600 MT, including decreases of 300 MT), Costa Rica (11,000 MT), Japan (4,500 MT), and Canada (1,700 MT). Exports of 138,600 MT were down 5 percent from the previous week, but up 42 percent from the prior 4-week average. The destinations were primarily to Mexico (71,800 MT), Haiti (45,000 MT), Japan (13,300 MT), Canada (3,200 MT), and South Korea (1,500 MT).
Soybeans: Net sales of 406,900 MT for 2020/2021–a marketing-year low–were down 47 percent from the previous week and 68 percent from the prior 4-week average. Increases primarily for China (476,900 MT, including 396,000 MT switched from unknown destinations and decreases of 132,900 MT), Thailand (82,400 MT, including 68,000 MT switched from unknown destinations), Vietnam (78,100 MT, including 70,000 MT switched from unknown destinations), Spain (66,900 MT, including 65,000 MT switched from unknown destinations), and the Netherlands (66,000 MT, including 60,000 MT switched from unknown destinations), were offset by reductions primarily for unknown destinations (539,100 MT). Exports of 2,492,600 MT were up 3 percent from the previous week, but down 6 percent from the prior 4-week average. The destinations were primarily to China (2,012,200 MT), Vietnam (84,700 MT), Thailand (79,700 MT), Mexico (75,500 MT), and Spain (66,900 MT).
Optional Origin Sales: For 2020/2021, the current outstanding balance of 63,000 MT, all China.
Exports for Own Account: For 2020/2021, new exports for own account totaling 29,400 MT were to Canada. The current exports for own account outstanding balance is 84,300 MT, all Canada.
Soybean Cake and Meal: Net sales of 163,800 MT for 2020/2021, resulting in increases primarily for Mexico (56,100 MT), Bangladesh (45,000 MT), the Philippines (45,000 MT), Ecuador (36,400 MT, including 30,000 MT switched from unknown destinations and decreases of 1,100 MT), and Guatemala (20,900 MT, including 21,000 MT switched from El Salvador, 200 MT switched from Honduras, and decreases of 500 MT), were offset by reductions primarily for unknown destinations (27,000 MT), Canada (25,400 MT), and El Salvador (11,000 MT). Exports of 227,500 MT were primarily to Colombia (40,600 MT), Guatemala (39,900 MT), Ecuador (32,000 MT), Mexico (30,900 MT), and Canada (25,900 MT).
Soybean Oil: Net sales of 2,500 MT for 2020/2021, resulting in increases primarily for Costa Rica (2,000 MT), Nicaragua (1,100 MT), Mexico (500 MT), and the Dominican Republic (500 MT), were offset by reductions for Canada (1,700 MT). Exports of 28,700 MT for 2020/2021 were primarily to the Dominican Republic (17,000 MT), Jamaica (4,000 MT), Venezuela (4,000 MT), and Mexico (2,500 MT).
Cotton: Net sales of 277,900 RB for 2020/2021 were down 22 percent from the previous week, but up 33 percent from the prior 4-week average. Increases were primarily for China (130,800 RB), Vietnam (46,000 RB, including 4,600 RB switched from China and decreases of 5,800 RB), Pakistan (44,500 RB), Turkey (12,500 RB), and Indonesia (11,100 RB). For 2021/2022, net sales of 21,800 RB were for Vietnam (15,400 RB) and Mexico (6,400 RB). Exports of 180,800 RB were down 1 percent from the previous week and 29 percent from the prior 4-week average. Exports were primarily to China (80,300 RB), Vietnam (27,500 RB), Pakistan (17,000 RB), Bangladesh (12,000 RB), and Mexico (11,700 RB). Net sales of Pima totaling 7,900 RB were down 71 percent from the previous week and 54 percent from the prior 4-week average. Increases were primarily for Peru (3,500 RB), Vietnam (1,800 RB), Honduras (1,200 RB), and Bangladesh (900 RB). Exports of 27,600 RB–a marketing-year high–were up 27 percent from the previous week and 31 percent from the prior 4-week average. The destinations were primarily to India (12,400 RB), China (7,400 RB), Pakistan (4,100 RB), Vietnam (1,600 RB), and Thailand (1,000 RB).
Exports for Own Account: For 2020/2021, new exports for own account totaling 13,000 RB were to China. Exports for own account totaling 2,900 RB to China (2,200 RB) and Vietnam (700 RB) were applied to new or outstanding sales. The current exports for own account outstanding balance of 41,900 RB is for China (40,500 RB), Bangladesh (1,000 RB), Indonesia (300 RB), and Vietnam (100 RB).
Hides and Skins: Net sales of 267,400 pieces for 2020 were down 27 percent from the previous week and 25 percent from the prior 4-week average. Increases primarily for China (150,500 whole cattle hides, including decreases of 15,700 pieces), Mexico (42,400 whole cattle hides, including decreases of 1,100 pieces), South Korea (32,800 whole cattle hides, including decreases of 1,100 pieces), Brazil (20,000 whole cattle hides), and Thailand (10,600 whole cattle hides), were offset by reductions for Indonesia (100 pieces). For 2021, total net sales of 3,600 pieces were reported for China. Exports of 309,000 pieces reported for 2020 were down 13 percent from the previous week and 18 percent from the prior 4-week average. Whole cattle hides exports were primarily to China (248,900 pieces), Mexico (24,400 pieces), South Korea (22,200 pieces), Taiwan (4,000 pieces), and Brazil (3,400 pieces).
Net sales of 223,800 wet blues for 2020 were up noticeably from the previous week and from the prior 4-week average. Increases primarily for Vietnam (131,000 unsplit, including decreases of 800 unsplit), China (67,100 unsplit, including decreases of 200 unsplit), Brazil (28,900 unsplit), Italy (1,200 unsplit), and Hong Kong (100 unsplit), were offset by reductions primarily for Taiwan (4,300 unsplit). For 2021, net sales of 40,800 wet blues were reported for Italy (40,000 unsplit) and Vietnam (800 unsplit). Additionally, net sales of 5,100 grain splits reported for Germany (6,000 grain splits) and China (4,000 grain splits), were offset by reductions for India (4,900 grain splits). Exports of 111,200 wet blues for 2020 were up noticeably from the previous week, but down 19 percent from the prior 4-week average. The destinations were primarily to Vietnam (47,500 unsplit), China (46,300 unsplit), Thailand (8,700 unsplit), Mexico (3,600 unsplit and 700 grain splits), and Taiwan (1,900 unsplit). Net sales reductions of 20,700 splits resulting in increases for Taiwan (2,400 pounds) and China (300 pounds, including decreases of 8,000 pounds), were more than offset by reductions for Vietnam (23,300 pounds). For 2021, net sales reductions of 56,300 splits were for Vietnam (24,100 pounds) and China (32,200 pounds). Exports of 368,700 pounds were to Vietnam (202,100 pounds), China (124,200 pounds), and Taiwan (42,400 pounds).
Beef: Net sales of 13,700 MT reported for 2020 were down noticeably from the previous week and down 16 percent from the prior 4-week average. Increases primarily for Japan (7,200 MT, including decreases of 500 MT), South Korea (3,800 MT, including decreases of 400 MT), Mexico (1,000 MT, including decreases of 100 MT), China (800 MT, including decreases of 100 MT), and Canada (400 MT), were offset by reductions primarily for Hong Kong (300 MT) and Colombia (100 MT). For 2021, net sales of 3,200 MT were primarily for South Korea (1,600 MT), Hong Kong (500 MT), Japan (400 MT), and Taiwan (400 MT). Exports of 16,600 MT were down 18 percent from the previous week and 15 percent from the prior 4-week average. The destinations were primarily to South Korea (4,000 MT), Japan (3,900 MT), China (2,100 MT), Mexico (2,000 MT), and Hong Kong (1,200 MT).
Pork: Net sales of 31,300 MT reported for 2020 were up 66 percent from the previous week, but down 6 percent from the prior 4-week average. Increases primarily for Mexico (12,900 MT, including decreases of 1,000 MT), China (7,400 MT, including decreases of 1,300 MT), Japan (4,200 MT, including decreases of 300 MT), Canada (1,700 MT, including decreases of 400 MT), and South Korea (1,500 MT, including decreases of 300 MT), were offset by reductions for Vietnam (100 MT) and Costa Rica (100 MT). For 2021, net sales of 4,200 MT were primarily for China (1,400 MT), Colombia (700 MT), Australia (600 MT), Canada (400 MT), and Mexico (300 MT). Exports of 34,100 MT were down 17 percent from the previous week and 12 percent from the prior 4-week average. The destinations were primarily to Mexico (11,500 MT), China (9,000 MT), Japan (4,700 MT), South Korea (3,000 MT), and Canada (2,000 MT).
U.S. EXPORT SALES FOR WEEK ENDING 11/26/2020
|
|
CURRENT MARKETING YEAR |
NEXT MARKETING YEAR |
||||||
|
COMMODITY |
NET SALES |
OUTSTANDING SALES |
WEEKLY EXPORTS |
ACCUMULATED EXPORTS |
NET SALES |
OUTSTANDING SALES |
||
|
CURRENT YEAR |
YEAR AGO |
CURRENT YEAR |
YEAR AGO |
|||||
|
|
THOUSAND METRIC TONS |
|||||||
|
WHEAT |
|
|
|
|
|
|
|
|
|
HRW |
110.6 |
1,530.5 |
1,318.8 |
112.9 |
4,949.4 |
4,778.4 |
0.0 |
22.0 |
|
SRW |
6.5 |
393.6 |
526.0 |
32.6 |
1,000.5 |
1,420.7 |
0.0 |
100.0 |
|
HRS |
163.5 |
1,520.8 |
1,185.3 |
153.1 |
3,594.9 |
3,366.9 |
0.0 |
45.0 |
|
WHITE |
147.5 |
2,503.1 |
868.9 |
129.7 |
2,433.9 |
2,314.4 |
0.0 |
20.0 |
|
DURUM |
18.2 |
172.4 |
175.0 |
23.2 |
393.0 |
501.1 |
0.0 |
0.0 |
|
TOTAL |
446.4 |
6,120.3 |
4,073.9 |
451.5 |
12,371.6 |
12,381.5 |
0.0 |
187.0 |
|
BARLEY |
0.0 |
30.4 |
33.9 |
0.0 |
12.4 |
25.2 |
0.0 |
0.0 |
|
CORN |
1,371.4 |
27,920.3 |
8,271.1 |
1,072.3 |
10,372.9 |
6,344.4 |
0.0 |
747.0 |
|
SORGHUM |
238.6 |
3,255.7 |
683.9 |
213.7 |
1,275.5 |
242.3 |
0.0 |
327.0 |
|
SOYBEANS |
406.9 |
25,211.2 |
9,956.3 |
2,492.6 |
27,126.4 |
15,987.9 |
0.0 |
69.0 |
|
SOY MEAL |
163.8 |
3,192.9 |
3,180.1 |
227.5 |
1,908.4 |
1,803.8 |
0.0 |
18.1 |
|
SOY OIL |
2.5 |
289.7 |
137.5 |
28.7 |
100.3 |
194.8 |
0.0 |
0.6 |
|
RICE |
|
|
|
|
|
|
|
|
|
L G RGH |
49.2 |
245.8 |
389.0 |
70.6 |
531.2 |
496.4 |
0.0 |
0.0 |
|
M S RGH |
0.0 |
19.4 |
16.4 |
0.2 |
9.5 |
14.4 |
0.0 |
0.0 |
|
L G BRN |
0.2 |
10.4 |
13.7 |
0.4 |
11.7 |
15.4 |
0.0 |
0.0 |
|
M&S BR |
0.2 |
16.1 |
56.9 |
1.7 |
34.3 |
1.9 |
0.0 |
0.0 |
|
L G MLD |
16.5 |
48.1 |
213.1 |
48.3 |
197.8 |
375.4 |
0.0 |
0.0 |
|
M S MLD |
5.7 |
195.6 |
190.7 |
17.5 |
139.8 |
172.8 |
0.0 |
0.0 |
|
TOTAL |
71.7 |
535.5 |
879.7 |
138.6 |
924.2 |
1,076.4 |
0.0 |
0.0 |
|
COTTON |
|
THOUSAND RUNNING BALES |
||||||
|
UPLAND |
277.9 |
5,733.9 |
7,467.3 |
180.8 |
4,132.1 |
3,099.3 |
21.8 |
651.9 |
|
PIMA |
7.9 |
235.9 |
161.2 |
27.6 |
251.1 |
132.7 |
0.0 |
0.7 |
Terry Reilly
Senior Commodity Analyst – Grain and Oilseeds
Futures International
One Lincoln Center
18 W 140 Butterfield Rd.
Oakbrook Terrace, Il. 60181
W: 312.604.1366
ICE IM: treilly1
Skype: fi.treilly

Trading of futures, options, swaps and other derivatives is risky and is not suitable for all persons. All of these investment products are leveraged, and you can lose more than your initial deposit. Each investment product is offered only to and from jurisdictions where solicitation and sale are lawful, and in accordance with applicable laws and regulations in such jurisdiction. The information provided here should not be relied upon as a substitute for independent research before making your investment decisions. Futures International, LLC is merely providing this information for your general information and the information does not take into account any particular individual’s investment objectives, financial situation, or needs. All investors should obtain advice based on their unique situation before making any investment decision. The contents of this communication and any attachments are for informational purposes only and under no circumstances should they be construed as an offer to buy or sell, or a solicitation to buy or sell any future, option, swap or other derivative. The sources for the information and any opinions in this communication are believed to be reliable, but Futures International, LLC does not warrant or guarantee the accuracy of such information or opinions. Futures International, LLC and its principals and employees may take positions different from any positions described in this communication. Past results are not necessarily indicative of future results.