No PDF. Not all USDA data is updating.
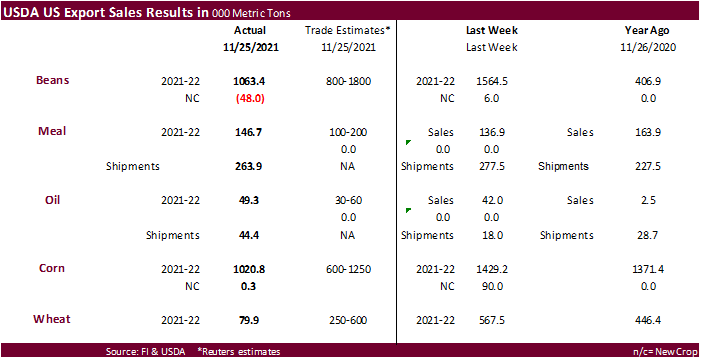
USDA export sales overall were disappointing, with a couple exceptions. USDA export sales were a marketing year low for all-wheat at 79,900 tons with a few minor reductions. This was a surprise. Soybean sales were ok at 1.063 million tons. Most of the Chinese sales of 657,100 tons were switched from unknown (462,000 switched). Soybean meal sales amounted to 146,700 tons, within expectations and shipments were good at 263,900 tons. Soybean oil sales of 49,300 tons were within expectations. Corn sales of 1.021 million tons were within expectations and Mexico (423,800 MT, including decreases of10,200 MT), Canada (198,200 MT, including decreases of 1,100 MT), and Japan (118,400 MT switched from unknown destinations). Sorghum sales were 284,700 tons (China 337,700 MT, including 118,300 MT switched from unknown destinations). Pork sales were 41,400 tons (China 12,400 tons).
This summary is based on reports from exporters for the period November 19-25, 2021.
Wheat: Net sales of 79,900 metric tons (MT) for 2021/2022–a marketing-year low–were down 86 percent from the previous week and 80 percent from the prior 4-week average. Increases primarily for Colombia (38,400 MT), Mexico (16,800 MT, including decreases of 2,300 MT), Malaysia (9,000 MT, including 10,400 MT switched from the Philippines and decreases of 1,800 MT), El Salvador (7,000 MT), and Guatemala (4,300 MT), were offset by reductions for Peru (1,400 MT), the Philippines (600 MT), and Indonesia (200 MT). Total net sales of 26,000 MT for 2022/2023 were for Colombia. Exports of 371,400 MT were up 87 percent from the previous week and 66 percent from the prior 4-week average. The destinations were primarily to the Philippines (184,400 MT), Taiwan (52,100 MT), Mexico (48,400 MT), Malaysia (28,400 MT), and Honduras (21,000 MT).
Corn: Net sales of 1,020,800 MT for 2021/2022 were down 29 percent from the previous week and 12 percent from the prior 4-week average. Increases primarily for Mexico (423,800 MT, including decreases of 10,200 MT), Canada (198,200 MT, including decreases of 1,100 MT), Japan (118,400 MT switched from unknown destinations), Colombia (88,900 MT, including 52,500 MT switched from unknown destinations and decreases of 53,500 MT), and Costa Rica (76,500 MT, including 9,300 MT switched from Guatemala and decreases of 4,100 MT), were offset by reductions for unknown destinations (4,200 MT). Total net sales of 300 MT for 2022/2023 were for Costa Rica. Exports of 938,400 MT were up 1 percent from the previous week and 5 percent from the prior 4-week average. The destinations were primarily to Mexico (382,400 MT), China (138,000 MT), Japan (118,500 MT), Colombia (110,800 MT), and Canada (49,000 MT).
Optional Origin Sales: For 2021/2022, the current outstanding balance of 498,700 MT is for unknown destinations (429,000 MT), Italy (60,700 MT), and Saudi Arabia (9,000 MT).
Barley: No net sales were reported for the week. Exports of 1,000 MT were unchanged the previous week, but up noticeably from the prior 4-week average. The destination was to Japan.
Sorghum: Net sales of 284,700 MT for 2021/2022 resulting in increases for China (337,700 MT, including 118,300 MT switched from unknown destinations), were offset by reductions for unknown destinations (53,000 MT). Exports of 186,900 MT were down 13 percent from the previous week, but up noticeably from the prior 4-week average. The destinations were to China (186,700 MT) and Mexico (200 MT).
Rice: Net sales of 32,900 MT for 2021/2022 were down 56 percent from the previous week and 47 percent from the prior 4-week average. Increases primarily for El Salvador (8,000 MT), Mexico (7,300 MT), Iraq (7,100 MT), Haiti (2,100 MT), and Saudi Arabia (2,100 MT), were offset by reductions for Costa Rica (1,500 MT). Exports of 105,000 MT–a marketing-year high–were up 6 percent from the previous week and 65 percent from the prior 4-week average. The destinations were primarily to Iraq (44,000 MT), Israel (19,200 MT), Costa Rica (10,300 MT), Haiti (9,100 MT), and El Salvador (7,800 MT).
Exports for Own Account: For 2021/2022, new exports for own account totaling 100 MT were to Canada. The current exports for own account outstanding balance is 100 MT, all Canada.
Soybeans: Net sales of 1,063,400 MT for 2021/2022 were down 32 percent from the previous week and 29 percent from the prior 4-week average. Increases primarily for China (657,100 MT, including 462,000 MT switched from unknown destinations and decreases of 3,200 MT), Egypt (68,000 MT, including 66,000 MT switched from unknown destinations and decreases of 4,900 MT), Thailand (67,600 MT, including 66,000 MT switched from unknown destinations), Germany (66,900 MT), and Bangladesh (62,000 MT, including 60,000 MT switched from unknown destinations), were offset by reductions primarily for unknown destinations (43,000 MT) and Turkey (9,800 MT). Total net sales reductions of 48,000 MT for 2022/2023 were for unknown destinations. Exports of 2,327,100 MT were up 3 percent from the previous week, but down 14 percent from the prior 4-week average. The destinations were primarily to China (1,410,200 MT), Egypt (311,400 MT), Taiwan (97,700 MT), Mexico (94,500 MT), and Thailand (71,200 MT).
Export for Own Account: For 2021/2022, new exports for own account totaling 59,400 MT were for Canada. The current exports for own account outstanding balance is 100,600 MT, all Canada.
Export Adjustments: Accumulated exports of soybeans to the Netherlands were adjusted down 66,910 MT for week ending November 11th. The correct destination for this shipment is Germany.
Soybean Cake and Meal: Net sales of 146,700 MT for 2021/2022 were up 7 percent from the previous week, but down 29 percent from the prior 4-week average. Increases primarily for Guatemala (50,000 MT, including decreases of 800 MT), unknown destinations (28,000 MT), Mexico (24,800 MT, including decreases of 3,500 MT), the Dominican Republic (24,000 MT), and Canada (7,400 MT), were offset by reductions for Thailand (4,600 MT), Belgium (2,100 MT), Colombia (1,200 MT), and the Leeward Windward Islands (100 MT). Net sales reductions of 1,000 MT for 2022/2023 were for Japan (600 MT) and the Netherlands (400 MT). Exports of 263,900 MT were down 5 percent from the previous week, but up 19 percent from the prior 4-week average. The destinations were primarily to the Philippines (92,200 MT), Thailand (45,400 MT), Colombia (26,800 MT), Mexico (26,400 MT), and Canada (22,200 MT).
Soybean Oil: Net sales of 49,300 MT for 2021/2022 were up 17 percent from the previous week and 50 percent from the prior 4-week average. Increases primarily for India (30,000 MT), Algeria (22,000 MT switched from unknown destinations), Mexico (19,200 MT), Guatemala (18,000 MT), and the Dominican Republic (600 MT), were offset by reductions for unknown destinations (22,000 MT) and Morocco (19,000 MT). Exports of 44,400 MT were up noticeably from the previous week and from the prior 4-week average. The destinations were to Algeria (22,000 MT), South Korea (19,000 MT), Mexico (2,900 MT), and Canada (500 MT).
Cotton: Net sales of 374,900 RB for 2021/2022 were up 90 percent from the previous week and up noticeably from the prior 4-week average. Increases primarily for Vietnam (147,100 RB, including 1,600 RB switched from China, 200 RB switched from Japan, and decreases of 200 RB), China (123,600 RB), Turkey (55,000 RB), Pakistan (36,600 RB), and South Korea (2,300 RB, including 1,800 RB switched from Vietnam), were offset by reductions for Malaysia (200 RB). Exports of 71,400 RB were down 27 percent from the previous week and 29 percent from the prior 4-week average. The destinations were primarily to China (23,700 RB), Mexico (14,800 RB), Vietnam (9,000 RB), Turkey (6,000 RB), and Pakistan (5,800 RB). Net sales of Pima totaling 6,400 RB–a marketing-year low–were down 65 percent from the previous week and 67 percent from the prior 4-week average. Increases primarily for China (2,600 RB), Thailand (1,300 RB), India (1,000 RB), Vietnam (900 RB), and Egypt (400 RB), were offset by reductions for Bangladesh (900 RB). Exports of 2,300 RB were down 63 percent from the previous week and 69 percent from the prior 4-week average. The destinations were to India (1,000 RB), Turkey (400 RB), Pakistan (400 RB), Thailand (400 RB), and Peru (100 RB).
Optional Origin Sales: For 2021/2022, the current outstanding balance of 8,800 RB is for Pakistan.
Exports for Own Account: For 2021/2022, the current exports for own account outstanding balance of 100 RB is for Vietnam.
Hides and Skins: Net sales of 334,500 pieces for 2021 were down 25 percent from the previous week and 35 percent from the prior 4-week average. Increases primarily for China (178,000 whole cattle hides, including decreases of 7,700 pieces), Mexico (58,800 whole cattle hides, including decreases of 1,300 pieces), Thailand (45,800 whole cattle hides, including decreases of 500 pieces), South Korea (42,600 whole cattle hides, including decreases of 1,500 pieces), and Cambodia (5,300 whole cattle hides), were offset by reductions primarily for Vietnam (2,000 pieces) and Canada (1,800 pieces). Net sales of 68,600 pieces for 2022 were primarily for China (44,500 whole cattle hides), Mexico (10,900 whole cattle hides), Italy (6,500 whole cattle hides), and Vietnam (3,600 whole cattle hides). Exports of 374,000 pieces were up 5 percent from the previous week, but down 2 percent from the prior 4-week average. Whole cattle hide exports were primarily to China (267,700 pieces), South Korea (47,700 pieces), Mexico (22,400 pieces), Thailand (15,000 pieces), and Indonesia (8,400 pieces).
Net sales of 146,400 wet blues for 2021 were up noticeably from the previous week and up 89 percent from the prior 4-week average. Increases reported for Vietnam (77,900 unsplit, including decreases of 100 pieces), China (53,900 unsplit, including decreases of 100 unsplit), Italy (11,200 grain splits, 1,500 unsplit, and decreases of 100 unsplit), Mexico (2,600 unsplit), and Hong Kong (1,000 unsplit), were offset by reductions for Brazil (1,200 unsplit), Japan (400 grain splits), and Thailand (100 unsplit). Net sales of 17,800 wet blues for 2022 were reported for China (5,600 unsplit), Brazil (4,200 unsplit), Italy (4,000 unsplit), and Hong Kong (4,000 unsplit). Exports of 134,100 wet blues were up 28 percent from the previous week and 13 percent from the prior 4-week average. The destinations were primarily to Italy (45,100 unsplit and 5,500 grain splits), Vietnam (36,400 unsplit), China (26,800 unsplit), Thailand (13,000 unsplit), and Japan (3,600 grain splits). Net sales of 340,500 splits were reported for China (209,900 splits, including decreases of 100 splits) and Vietnam (130,600 splits). Total net sales reductions of 117,700 splits for 2022 were for Vietnam. Exports of 201,000 pounds were to Vietnam (160,000 pounds) and China (41,000 pounds).
Beef: Net sales of 21,600 MT for 2021 were up 12 percent from the previous week and 5 percent from the prior 4-week average. Increases primarily for South Korea (10,700 MT, including decreases of 3,100 MT), China (3,300 MT, including decreases of 300 MT), Japan (2,900 MT, including decreases of 800 MT), Mexico (2,000 MT), and Chile (900 MT), were offset by reductions for Italy (100 MT) and Thailand (100 MT). Net sales of 10,400 MT for 2022 primarily for South Korea (7,000 MT), Japan (2,200 MT), Vietnam (300 MT), Taiwan (300 MT), and Hong Kong (200 MT), were offset by reductions for China (100 MT). Exports of 16,500 MT were down 9 percent from the previous week and 6 percent from the prior 4-week average. The destinations were primarily to South Korea (4,500 MT), Japan (4,000 MT), China (3,000 MT), Taiwan (1,500 MT), and Mexico (1,200 MT).
Pork: Net sales of 41,400 MT for 2021 were up noticeably from the previous week and up 48 percent from the prior 4-week average. Increases were primarily for Mexico (19,600 MT, including decreases of 600 MT), China (12,400 MT, including decreases of 300 MT), Japan (3,700 MT, including decreases of 100 MT), South Korea (1,600 MT, including decreases of 200 MT), and Colombia (1,100 MT, including decreases of 100 MT). Net sales of 4,100 MT for 2022 were primarily for South Korea (1,500 MT), Canada (1,300 MT), Chile (400 MT), Colombia (300 MT), and Mexico (200 MT). Exports of 36,500 MT were up 26 percent from the previous week and 13 percent from the prior 4-week average. The destinations were primarily to Mexico (19,800 MT), Japan (4,700 MT), South Korea (3,200 MT), China (3,100 MT), and Colombia (1,900 MT).
December 2, 2021 1 FOREIGN AGRICULTURAL SERVICE/USDA
Terry Reilly
Senior Commodity Analyst – Grain and Oilseeds
Futures International
One Lincoln Center
18 W 140 Butterfield Rd.
Oakbrook Terrace, Il. 60181
W: 312.604.1366
ICE IM: treilly1
Skype: fi.treilly

Trading of futures, options, swaps and other derivatives is risky and is not suitable for all persons. All of these investment products are leveraged, and you can lose more than your initial deposit. Each investment product is offered only to and from jurisdictions where solicitation and sale are lawful, and in accordance with applicable laws and regulations in such jurisdiction. The information provided here should not be relied upon as a substitute for independent research before making your investment decisions. Futures International, LLC is merely providing this information for your general information and the information does not take into account any particular individual’s investment objectives, financial situation, or needs. All investors should obtain advice based on their unique situation before making any investment decision. The contents of this communication and any attachments are for informational purposes only and under no circumstances should they be construed as an offer to buy or sell, or a solicitation to buy or sell any future, option, swap or other derivative. The sources for the information and any opinions in this communication are believed to be reliable, but Futures International, LLC does not warrant or guarantee the accuracy of such information or opinions. Futures International, LLC and its principals and employees may take positions different from any positions described in this communication. Past results are not necessarily indicative of future results.