PDF attached
USDA Export Sales
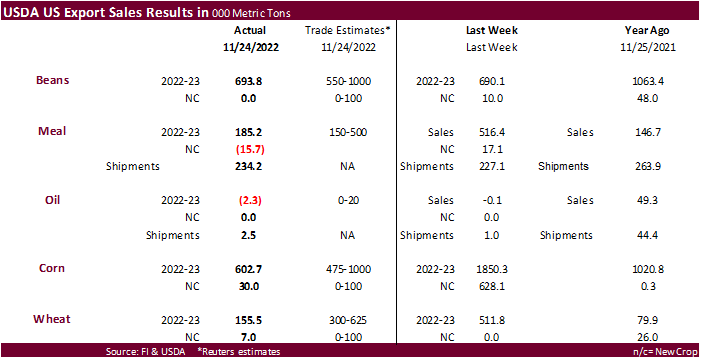
USDA export sales for all-wheat and SBO came in below expectations. Soybeans, soybean meal and corn were at the low end of a range of trade expectations. It was another week of large reductions for the unknown category for soybeans of 702,900 tons.
Soybean sales showed sales of 693,800 tons for 2022-23 that included China 927,400 tons, including524,000 MT switched from unknown destinations and decreases of 70,200. The Netherlands included 177,900 tons, including 209,500 tons switched from unknown destinations and decreases of 1,000. Iraq included 44,100 tons, including 42,000 tons switched from the Netherlands.
Soybean meal sales were 185,200 tons, well below 516,400 tons previous week, and shipments were 234,200 tons. Soybean oil sales were net reductions of 2,300 tons and shipments only 2,500 tons.
Corn export sales were 602,700 tons for 2022-23, primarily for Mexico (387,100 MT, including decreases of 2,700 MT), unknown destinations (78,500 MT), Hong Kong (34,000 MT), and Japan (27,700 MT, including 25,100 MT switched from unknown destinations).
All-wheat export sales of 155,500 tons were primarily for Algeria (58,300 MT, including decreases 1,700 MT),Mexico (32,800 MT, including decreases of 2,000 MT), Japan (26,700 MT), Nigeria (25,000 MT), and South Korea (6,100 MT).
Net pork sales of 20,100 tons for 2022 were primarily for Mexico (11,800 MT, including decreases of 400 MT), Japan (4,000 MT, including decreases of 200 MT), South Korea (1,800 MT, including decreases of 100 MT). Pork sales have been very good this quarter.
U.S. EXPORT SALES FOR WEEK ENDING 11/24/2022
|
|
CURRENT MARKETING YEAR |
NEXT MARKETING YEAR |
||||||
|
COMMODITY |
NET SALES |
OUTSTANDING SALES |
WEEKLY EXPORTS |
ACCUMULATED EXPORTS |
NET SALES |
OUTSTANDING SALES |
||
|
CURRENT YEAR |
YEAR AGO |
CURRENT YEAR |
YEAR AGO |
|||||
|
|
THOUSAND METRIC TONS |
|||||||
|
WHEAT |
|
|
|
|
|
|
|
|
|
HRW |
37.5 |
837.4 |
1,979.3 |
91.9 |
2,800.4 |
3,709.5 |
0.0 |
6.3 |
|
SRW |
9.6 |
529.1 |
601.3 |
5.0 |
1,683.0 |
1,478.7 |
7.0 |
13.6 |
|
HRS |
18.9 |
1,370.7 |
1,113.7 |
128.0 |
2,768.5 |
2,729.3 |
0.0 |
10.8 |
|
WHITE |
31.2 |
1,096.5 |
748.0 |
27.6 |
2,146.3 |
1,810.1 |
0.0 |
0.3 |
|
DURUM |
58.3 |
123.2 |
52.4 |
18.8 |
96.5 |
96.8 |
0.0 |
0.0 |
|
TOTAL |
155.5 |
3,956.8 |
4,494.6 |
271.2 |
9,494.8 |
9,824.5 |
7.0 |
31.0 |
|
BARLEY |
0.0 |
6.6 |
21.6 |
0.8 |
5.0 |
8.5 |
0.0 |
0.0 |
|
CORN |
602.7 |
12,579.1 |
25,783.6 |
344.5 |
5,773.3 |
9,646.7 |
30.0 |
969.0 |
|
SORGHUM |
5.1 |
254.8 |
3,278.9 |
1.8 |
102.1 |
754.3 |
0.0 |
0.0 |
|
SOYBEANS |
693.8 |
18,232.3 |
16,096.7 |
2,117.0 |
19,065.8 |
21,070.4 |
0.0 |
10.0 |
|
SOY MEAL |
185.2 |
3,614.5 |
3,576.3 |
234.2 |
1,494.5 |
1,851.1 |
-15.7 |
3.3 |
|
SOY OIL |
-2.3 |
18.8 |
211.7 |
2.5 |
11.5 |
91.4 |
0.0 |
0.6 |
|
RICE |
|
|
|
|
|
|
|
|
|
L G RGH |
4.0 |
115.6 |
165.6 |
12.6 |
134.1 |
494.7 |
0.0 |
0.0 |
|
M S RGH |
0.0 |
12.2 |
6.5 |
0.3 |
9.7 |
2.6 |
0.0 |
0.0 |
|
L G BRN |
0.1 |
6.7 |
1.8 |
0.4 |
6.3 |
24.7 |
0.0 |
0.0 |
|
M&S BR |
0.0 |
9.9 |
68.5 |
0.2 |
4.5 |
14.8 |
0.0 |
0.0 |
|
L G MLD |
7.8 |
107.5 |
66.0 |
8.5 |
207.0 |
306.2 |
0.0 |
0.0 |
|
M S MLD |
13.3 |
69.5 |
80.4 |
1.5 |
87.3 |
108.9 |
0.0 |
0.0 |
|
TOTAL |
25.3 |
321.5 |
388.7 |
23.5 |
448.8 |
951.8 |
0.0 |
0.0 |
|
COTTON |
|
THOUSAND RUNNING BALES |
||||||
|
UPLAND |
16.5 |
5,460.9 |
6,952.6 |
139.5 |
3,240.1 |
2,392.7 |
11.0 |
1,144.1 |
|
PIMA |
1.8 |
82.6 |
242.2 |
1.3 |
29.2 |
109.0 |
0.0 |
0.9 |
This summary is based on reports from exporters for the period November 18-24, 2022.
Wheat: Net sales of 155,500 metric tons (MT) for 2022/2023 primarily for Algeria (58,300 MT, including decreases 1,700 MT), Mexico (32,800 MT, including decreases of 2,000 MT), Japan (26,700 MT), Nigeria (25,000 MT), and South Korea (6,100 MT), were offset by reductions for Barbados (2,100 MT), Spain (900 MT), and Leeward and Winward Islands (100 MT). Total net sales of 7,000 MT for 2023/2024 were for Mexico. Exports of 271,200 MT were primarily to Taiwan (84,800 MT), Mexico (73,600 MT), South Korea (39,400 MT), Spain (19,100 MT), and Algeria (18,800 MT).
Corn: Net sales of 602,700 MT for 2022/2023 were primarily for Mexico (387,100 MT, including decreases of 2,700 MT), unknown destinations (78,500 MT), Hong Kong (34,000 MT), Japan (27,700 MT, including 25,100 MT switched from unknown destinations), and Colombia (27,200 MT). Total net sales of 30,000 MT for 2023/2024 were for Mexico. Exports of 344,500 MT were primarily to Mexico (193,100 MT), China (77,100 MT), Japan (25,100 MT), Canada (17,800 MT), and Honduras (8,300 MT).
Barley: No net sales were reported for the week. Exports of 800 MT were to Japan.
Sorghum: Total net sales of 5,100 MT for 2022/2023 were for Mexico. Exports of 1,800 MT were to Mexico.
Rice: Net sales of 25,300 MT for 2022/2023 were primarily for Japan (13,000 MT), Haiti (7,100 MT, including decreases of 100 MT), Honduras (3,900 MT), Belgium (300 MT), and Canada (200 MT, including decreases of 800 MT). Exports of 23,500 MT were primarily to Colombia (11,400 MT), Haiti (7,100 MT), Canada (1,900 MT), Mexico (1,700 MT), and Saudi Arabia (500 MT).
Soybeans: Net sales of 693,800 MT for 2022/2023 primarily for China (927,400 MT, including 524,000 MT switched from unknown destinations and decreases of 70,200 MT), the Netherlands (177,900 MT, including 209,500 MT switched from unknown destinations and decreases of 1,000 MT), the United Kingdom (66,000 MT, including 60,000 MT switched from unknown destinations), Mexico (56,200 MT, including decreases of 2,900 MT), and Iraq (44,100 MT, including 42,000 MT switched from the Netherlands), were offset by reductions primarily for unknown destinations (702,900 MT). Exports of 2,117,000 MT were primarily to China (1,510,400 MT), the Netherlands (219,900 MT), Spain (95,100 MT), the United Kingdom (66,000 MT), and Mexico (55,800 MT).
Optional Origin Sales: For 2022/2023, the current outstanding balance of 300 MT, all South Korea.
Export for Own Account: For 2022/2023, new exports for own account totaling 25,000 MT were to Canada. Exports for own account totaling 66,000 MT to Canada were applied to new or outstanding sales. The current exports for own account outstanding balance is 6,300 MT, all Canada.
Soybean Cake and Meal: Net sales of 185,200 MT for 2022/2023 primarily for Colombia (83,000 MT), Denmark (45,000 MT), Canada (24,700 MT), Mexico (18,000 MT), and Ecuador (8,000 MT), were offset by reductions for the Philippines (16,400 MT) and Guatemala (2,600 MT). Total net sales reductions of 15,700 MT for 2023/2024 were for Canada. Exports of 234,200 MT were primarily to Vietnam (53,300 MT), Mexico (49,300 MT), Colombia (48,100 MT), Ecuador (36,400 MT), and Canada (18,100 MT).
Soybean Oil: Net sales reductions of 2,300 MT for 2022/2023 resulting in increases for Canada (100 MT), were more than offset by reductions for Mexico (2,400 MT). Exports of 2,500 MT were to Mexico (2,200 MT) and Canada (300 MT).
Cotton: Net sales of 16,500 RB for 2022/2023 primarily for India (5,700 RB), Indonesia (4,200 RB, including decreases of 500 RB), Pakistan (3,500 RB, including decreases of 2,200 RB), Peru (2,600 RB), and Vietnam (2,200 RB), were offset by reductions primarily for Turkey (8,500 RB). Total net sales of 11,000 RB for 2023/2024 were for Turkey. Exports of 139,500 RB were primarily to China (38,300 RB), Pakistan (31,900 RB), Bangladesh (15,200 RB), Turkey (8,400 RB), and Mexico (8,100 RB). Net sales of Pima totaling 1,800 RB were primarily for China (1,800 RB, including 400 RB switched from Germany) and Thailand (400 RB), were offset by reductions for Germany (400 RB). Exports of 1,300 RB were primarily to China (500 RB) and Taiwan (400 RB).
Optional Origin Sales: For 2022/2023, the current outstanding balance of 9,300 RB, all Malaysia.
Export for Own Account: For 2022/2023, new exports for own account totaling 6,600 RB were to China. The current exports for own account outstanding balance of 105,700 RB are for China (61,800 RB), Vietnam (23,900 RB), Pakistan (18,100 RB), India (1,500 RB), and Indonesia (400 RB).
Hides and Skins: Net sales of 472,000 pieces for 2022 reported for China (338,200 whole cattle hides, including decreases of 10,600 pieces), Mexico (94,400 whole cattle hides, including decreases of 2,700 pieces), South Korea (24,200 whole cattle hides, including decreases of 6,600 pieces), Brazil (9,800 whole cattle hides, including decreases of 100 pieces), and Colombia (3,400 whole cattle hides), were offset by reductions for Indonesia (1,200 pieces), Thailand (800 pieces), and Turkey (100 pieces). Net sales of 2,900 calf skins reported for Italy (7,200 calf skins), were offset by reductions for China (4,300 calf skins). In addition, net sales of 1,100 kip skins reported for China (1,300 kip skins), were offset by reductions for Belgium (200 kip skins). Net sales of 46,300 pieces for 2023 reported for China (45,100 whole cattle hides) and South Korea (4,000 whole cattle hides), were offset by reductions for Brazil (2,800 pieces). Exports of 424,000 whole cattle hides exports were primarily to China (301,300 pieces), Mexico (38,500 pieces), South Korea (26,700 pieces), Thailand (22,800 pieces), and Indonesia (14,300 pieces). In addition, exports of 1,300 kip skins were to Belgium.
Net sales of 19,900 wet blues for 2022 primarily for China (12,500 unsplit, including decreases of 100 unsplit), Thailand (3,400 unsplit), Vietnam (2,400 unsplit), Italy (1,700 unsplit, including decreases of 2,000 unsplit), and India (900 unsplit), were offset by reductions for Brazil (1,000 unsplit). Net sales of 7,000 wet blues for 2023 were reported for Thailand (4,000 unsplit), Italy (2,000 unsplit), and Brazil (1,000 unsplit). Exports of 167,100 wet blues were primarily to China (74,500 unsplit), Italy (30,000 unsplit and 1,800 grain splits), Vietnam (26,100 unsplit), Thailand (24,300 unsplit), and Taiwan (4,700 unsplit). No net sales of splits were reported for week. Exports of 56,000 splits were to China.
Beef: Net sales of 15,400 MT for 2022 primarily for China (7,200 MT, including decreases of 100 MT), Japan (2,600 MT, including decreases of 500 MT), Canada (1,900 MT, including decreases of 100 MT), South Korea (1,700 MT, including decreases of 400 MT), and Mexico (800 MT, including decreases of 100 MT), were offset by reductions for Brazil (100 MT). Net sales of 2,000 MT for 2023 were reported for Mexico (900 MT), Japan (500 MT), China (300 MT), Taiwan (200 MT), and Guatemala (100 MT). Exports of 15,800 MT were primarily to Japan (4,200 MT), South Korea (4,000 MT), China (3,000 MT), Mexico (1,400 MT), and Canada (800 MT).
Pork: Net sales of 20,100 MT for 2022 were primarily for Mexico (11,800 MT, including decreases of 400 MT), Japan (4,000 MT, including decreases of 200 MT), South Korea (1,800 MT, including decreases of 100 MT), the Dominican Republic (900 MT, including decreases of 100 MT), and Canada (500 MT, including decreases of 400 MT). Net sales of 3,800 MT for 2023 were primarily for Canada (1,200 MT), Colombia (1,000 MT), China (500 MT), Honduras (300 MT), and South Korea (200 MT). Exports of 29,700 MT were primarily to Mexico (14,900 MT), China (4,100 MT), Japan (3,000 MT), South Korea (1,900 MT), and Canada (1,800 MT).
Terry Reilly
Senior Commodity Analyst – Grain and Oilseeds
Futures International
One Lincoln Center
18 W 140 Butterfield Rd.
Oakbrook Terrace, Il. 60181
W: 312.604.1366
ICE IM: treilly1
Skype: fi.treilly

Trading of futures, options, swaps and other derivatives is risky and is not suitable for all persons. All of these investment products are leveraged, and you can lose more than your initial deposit. Each investment product is offered only to and from jurisdictions where solicitation and sale are lawful, and in accordance with applicable laws and regulations in such jurisdiction. The information provided here should not be relied upon as a substitute for independent research before making your investment decisions. Futures International, LLC is merely providing this information for your general information and the information does not take into account any particular individual’s investment objectives, financial situation, or needs. All investors should obtain advice based on their unique situation before making any investment decision. The contents of this communication and any attachments are for informational purposes only and under no circumstances should they be construed as an offer to buy or sell, or a solicitation to buy or sell any future, option, swap or other derivative. The sources for the information and any opinions in this communication are believed to be reliable, but Futures International, LLC does not warrant or guarantee the accuracy of such information or opinions. Futures International, LLC and its principals and employees may take positions different from any positions described in this communication. Past results are not necessarily indicative of future results.