PDF attached
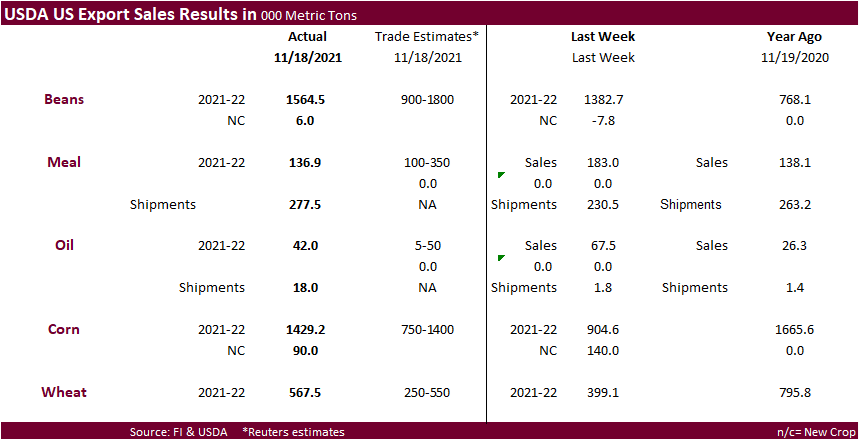
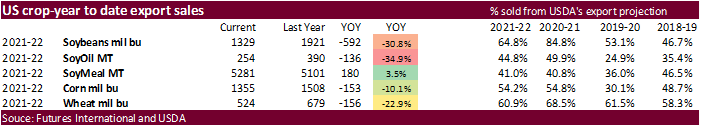
USDA export sales were good all around.
Opening Calls:
Soybeans 15-25 lower
Soybean meal $4-$7 lower
Soybean oil 75-125 points lower
Corn 6-10 lower
Wheat 10-20 cents lower bias Chicago to the downside
The US equity markets are rolling over in part to renewed concerns over a new South African Covid-19 variant. Major Asian stock indexes were down about 0.5-2.5%. FTSE was off 3.0%. WTI crude oil is down about $4.30 and USD is down 50 points. The outside markets are suggesting a sharply lower open for CBOT agriculture markets, although some money inflow from equities onto some commodity markets could limit losses. There is still concern over the quality of the Australian wheat crop. Over the last couple days we saw a few import tenders, notably Egypt buying SBO and Turkey buying nearly 400,000 tons of wheat. USDA export sales were good all around.
U.S. EXPORT SALES FOR WEEK ENDING 11/18/2021
FAX 202-690-3275
|
|
CURRENT MARKETING YEAR |
NEXT MARKETING YEAR |
||||||
|
COMMODITY |
NET SALES |
OUTSTANDING SALES |
WEEKLY EXPORTS |
ACCUMULATED EXPORTS |
NET SALES |
OUTSTANDING SALES |
||
|
CURRENT YEAR |
YEAR AGO |
CURRENT YEAR |
YEAR AGO |
|||||
|
|
THOUSAND METRIC TONS |
|||||||
|
WHEAT |
|
|
|
|
|
|
|
|
|
HRW |
304.6 |
2,028.4 |
1,530.5 |
111.6 |
3,611.9 |
4,949.4 |
0.0 |
0.0 |
|
SRW |
34.5 |
602.0 |
393.6 |
7.1 |
1,455.6 |
1,000.5 |
0.0 |
22.5 |
|
HRS |
133.8 |
1,280.2 |
1,520.8 |
37.6 |
2,556.8 |
3,594.9 |
0.0 |
0.0 |
|
WHITE |
75.0 |
823.0 |
2,503.1 |
23.5 |
1,733.4 |
2,433.9 |
0.0 |
0.0 |
|
DURUM |
19.5 |
52.5 |
172.4 |
19.4 |
96.7 |
393.0 |
0.0 |
0.0 |
|
TOTAL |
567.5 |
4,786.1 |
6,120.3 |
199.2 |
9,454.4 |
12,371.6 |
0.0 |
22.5 |
|
BARLEY |
0.0 |
22.6 |
30.4 |
0.0 |
7.4 |
12.4 |
0.0 |
0.0 |
|
CORN |
1,429.2 |
25,701.2 |
27,920.3 |
929.0 |
8,708.2 |
10,372.9 |
90.0 |
564.9 |
|
SORGHUM |
146.9 |
3,181.1 |
3,255.7 |
215.4 |
567.4 |
1,275.5 |
0.0 |
0.0 |
|
SOYBEANS |
1,564.5 |
17,360.4 |
25,211.2 |
2,253.0 |
18,810.2 |
27,059.5 |
6.0 |
48.0 |
|
SOY MEAL |
136.9 |
3,693.5 |
3,192.9 |
277.5 |
1,587.2 |
1,908.4 |
-0.8 |
35.4 |
|
SOY OIL |
42.0 |
206.8 |
289.7 |
18.0 |
47.0 |
100.3 |
0.0 |
0.0 |
|
RICE |
|
|
|
|
|
|
|
|
|
L G RGH |
26.1 |
171.1 |
245.8 |
85.3 |
474.6 |
531.2 |
0.0 |
0.0 |
|
M S RGH |
0.0 |
6.5 |
19.4 |
0.0 |
2.6 |
9.5 |
0.0 |
0.0 |
|
L G BRN |
0.1 |
9.1 |
10.4 |
0.5 |
17.1 |
11.7 |
0.0 |
0.0 |
|
M&S BR |
0.1 |
68.5 |
16.1 |
0.1 |
14.6 |
33.3 |
0.0 |
0.0 |
|
L G MLD |
27.4 |
108.2 |
48.1 |
10.5 |
251.3 |
197.8 |
0.0 |
0.0 |
|
M S MLD |
20.5 |
97.4 |
195.6 |
2.6 |
106.2 |
139.8 |
0.0 |
0.0 |
|
TOTAL |
74.2 |
460.8 |
535.5 |
99.1 |
866.3 |
923.2 |
0.0 |
0.0 |
|
COTTON |
|
THOUSAND RUNNING BALES |
||||||
|
UPLAND |
196.9 |
6,649.1 |
5,733.9 |
97.1 |
2,321.3 |
4,127.1 |
46.2 |
921.9 |
|
PIMA |
18.1 |
238.1 |
235.9 |
6.3 |
106.6 |
251.1 |
1.3 |
3.1 |
This summary is based on reports from exporters for the period November 12-18, 2021.
Wheat: Net sales of 567,500 metric tons (MT) for 2021/2022 were up 42 percent from the previous week and 70 percent from the prior4-week average. Increases primarily for Japan (154,200 MT), Nigeria (102,100 MT), Mexico (82,000 MT, including decreases of 17,700 MT), the Philippines (50,800 MT), and Taiwan (48,000 MT), were offset by reductions primarily for Peru (5,000 MT), Jamaica (2,000 MT), and Belize (1,200 MT). Exports of 199,200 MT were down 36 percent from the previous week and 10 percent from the prior 4-week average. The destinations were primarily to Mexico (60,100 MT), South Korea (50,700 MT), Japan (32,800 MT), Spain (19,200 MT), and the Philippines (13,800 MT).
Late Reporting: For 2021/2022, net sales and exports totaling 200 MT of durum wheat were reported late for Japan.
Export Adjustments: Accumulated exports of durum wheat to Italy were adjusted down 19,236 MT for week ending November 4th. This shipment was reported in error.
Corn: Net sales of 1,429,200 MT for 2021/2022–a marketing-year high–were up 58 percent from the previous week and 40 percent from the prior 4-week average. Increases were primarily for Mexico (629,600 MT, including decreases of 2,600 MT), Canada (306,900 MT, including decreases of 14,500 MT), Japan (120,900 MT, including 93,600 MT switched from unknown destinations), China (77,500 MT, including 68,000 MT switched from unknown destinations), and Saudi Arabia (73,400 MT, including 68,000 MT switched from unknown destinations). Total net sales of 90,000 MT for 2022/2023 were for Mexico. Exports of 929,000 MT were down 20 percent from the previous week, but up 12 percent from the prior 4-week average. The destinations were primarily to Mexico (285,400 MT), China (281,500 MT), Japan (93,600 MT), Colombia (79,400 MT), and Saudi Arabia (73,400 MT).
Optional Origin Sales: For 2021/2022, the current outstanding balance of 498,700 MT is for unknown destinations (429,000 MT), Italy (60,700 MT), and Saudi Arabia (9,000 MT).
Barley: No net sales or exports were reported for the week.
Sorghum: Net sales of 146,900 MT for 2021/2022 resulting in increases for China (149,900 MT, including 68,000 MT switched from unknown destinations and decreases of 1,000 MT), were offset by reductions for unknown destinations (3,000 MT). Exports of 215,400 MT–a marketing-year high–were up noticeably from the previous week and from the prior 4-week average. The destinations were to China (214,800 MT) and Mexico (600 MT).
Rice: Net sales of 74,200 MT for 2021/2022 were down 27 percent from the previous week, but up 48 percent from the prior 4-week average. Increases were primarily for Haiti (25,200 MT, including decreases of 100 MT), Mexico (24,600 MT), Israel (19,000 MT), Canada (1,900 MT), and El Salvador (1,100 MT). Exports of 99,100 MT–a marketing-year high–were up 13 percent from the previous week and 82 percent from the prior 4-week average. The destinations were primarily to Mexico (39,900 MT), Nicaragua (24,400 MT), Guatemala (12,700 MT), El Salvador (8,900 MT), and Haiti (7,200 MT).
Exports for Own Account: For 2021/2022, the current exports for own account outstanding balance is 100 MT, all Canada.
Soybeans: Net sales of 1,564,500 MT for 2021/2022 were up 13 percent from the previous week and from the prior 4-week average. Increases primarily for China (882,500 MT, including 461,000 MT switched from unknown destinations and decreases of 24,500 MT), Mexico (168,200 MT, including decreases of 1,100 MT), Thailand (148,600 MT, including 70,000 MT switched from unknown destinations and 66,000 MT switched from the Netherlands), Egypt (117,300 MT, including decreases of 700 MT), and Indonesia (98,300 MT, including 68,000 MT switched from unknown destinations), were offset by reductions primarily for unknown destinations (56,400 MT) and the Netherlands (47,500 MT). Total net sales of 6,000 MT for 2022/2023 were for unknown destinations. Exports of 2,253,000 MT were down 4 percent from the previous week and 18 percent from the prior 4-week average. The destinations were primarily to China (1,410,700 MT), Thailand (152,100 MT), Pakistan (128,200 MT), Mexico (112,700 MT), and the Netherlands (84,500 MT).
Export for Own Account: For 2021/2022, new exports for own account totaling 29,900 MT were for Canada. The current exports for own account outstanding balance is 41,200 MT, all Canada.
Soybean Cake and Meal: Net sales of 136,900 MT for 2021/2022 were down 25 percent from the previous week and 36 percent from the prior 4-week average. Increases primarily for Mexico (65,900 MT, including decreases of 3,400 MT), the Philippines (45,000 MT, including decreases of 3,200 MT), Colombia (44,600 MT, including 29,000 MT switched from unknown destinations and decreases of 20,400 MT), Panama (23,300 MT, including decreases of 400 MT), and Canada (10,800 MT, including decreases of 800 MT), were offset by reductions primarily for unknown destinations (55,000 MT) and Romania (27,000 MT). Net sales reductions of 800 MT for 2022/2023 were for Japan (600 MT) and the Netherlands (200 MT). Exports of 277,500 MT were up 20 percent from the previous week and 40 percent from the prior 4-week average. The destinations were primarily to the Philippines (87,100 MT), Ecuador (72,400 MT), Mexico (29,400 MT), Japan (28,900 MT), and Canada (28,500 MT).
Soybean Oil: Net sales of 42,000 MT for 2021/2022 were down 38 percent from the previous week, but up 62 percent from the prior 4-week average. Increases primarily for India (30,000 MT), the Dominican Republic (7,000 MT, including 6,300 MT switched from Guatemala and decreases of 3,100 MT), Colombia (4,000 MT), Jamaica (3,500 MT), and Mexico (3,000 MT), were offset by reductions for Guatemala (6,000 MT). Exports of 18,000 MT were up noticeably from the previous week and from the prior 4-week average. The destinations were primarily to the Dominican Republic (10,800 MT), Mexico (2,300 MT), Guatemala (1,600 MT), Nicaragua (1,500 MT), and El Salvador (1,200 MT).
Cotton: Net sales of 196,900 RB for 2021/2022 were up 44 percent from the previous week and 3 percent from the prior 4-week average. Increases primarily for China (58,500 RB), Vietnam (44,500 RB, including 400 RB switched from South Korea, 100 RB switched from Japan, and decreases of 500 RB), Pakistan (34,200 RB), Turkey (20,100 RB), and Bangladesh (16,700 RB), were offset by reductions for South Korea (500 RB) and El Salvador (300 RB). Net sales of 46,200 RB for 2022/2023 were reported for Bangladesh (19,800 RB), Turkey (13,200 RB), China (8,800 RB), and Pakistan (4,400 RB). Exports of 97,100 RB were up 25 percent from the previous week and 5 percent from the prior 4-week average. The destinations were primarily to China (35,100 RB), Mexico (20,900 RB), Vietnam (13,300 RB), South Korea (4,100 RB), and Bangladesh (3,700 RB). Net sales of Pima totaling 18,100 RB were down 12 percent from the previous week, but up 7 percent from the prior 4-week average. Increases were primarily for China (10,100 RB), Peru (2,700 RB), Thailand (2,000 RB), India (1,100 RB), and Vietnam (900 RB). Total, net sales of Pima totaling 1,300 RB for 2022/2023 were for Egypt. Exports of 6,300 RB were down 4 percent from the previous week and 3 percent from the prior 4-week average. The destinations were to India (2,900 RB), China (2,000 RB), Peru (900 RB), Bahrain (300 RB), and Italy (100 RB).
Optional Origin Sales: For 2021/2022, the current outstanding balance of 8,800 RB is for Pakistan.
Exports for Own Account: For 2021/2022, the current exports for own account outstanding balance of 100 RB is for Vietnam.
Hides and Skins: Net sales of 443,100 pieces for 2021 were down 14 percent from the previous week and 19 percent from the prior 4-week average. Increases primarily for China (312,000 whole cattle hides, including decreases of 14,700 pieces), South Korea (53,800 whole cattle hides, including decreases of 400 pieces), Thailand (21,900 whole cattle hides, including decreases of 1,100 pieces), Mexico (18,200 whole cattle hides, including decreases of 600 pieces), and Taiwan (17,600 whole cattle hides, including decreases of 100 pieces), were offset by reductions for Brazil (100 pieces). Net sales of 46,700 pieces for 2022 primarily for China (28,200 whole cattle hides), Thailand (9,800 whole cattle hides), and Italy (7,000 whole cattle hides), were offset by reductions for Mexico (2,000 whole cattle hides). Exports of 357,700 pieces were down 10 percent from the previous week and 9 percent from the prior 4-week average. Whole cattle hide exports were primarily to China (233,200 pieces), Thailand (39,100 pieces), South Korea (28,600 pieces), Mexico (28,100 pieces), and Indonesia (11,300 pieces).
Net sales of 30,500 wet blues for 2021 were down 79 percent from the previous week and 75 percent from the prior 4-week average. Increases reported for China (13,100 unsplit), Vietnam (12,000 unsplit), and the Dominican Republic (6,400 unsplit), were offset by reductions primarily for Thailand (400 unsplit) and Italy (300 unsplit and 100 grain splits). Net sales of 108,100 wet blues for 2022 were reported for Vietnam (40,200 unsplit), Italy (16,000 unsplit and 18,500 grain splits), China (28,000 unsplit), Brazil (3,000 unsplit), and Taiwan (2,400 unsplit). Exports of 104,600 wet blues were down 27 percent from the previous week and 16 percent from the prior 4-week average. The destinations were primarily to Italy (27,100 unsplit and 5,400 grain splits), Vietnam (29,900 unsplit), China (23,300 unsplit), Thailand (9,000 unsplit), and Taiwan (7,100 unsplit). Net sales of 87,400 splits were primarily for Vietnam (83,100 splits). Total net sales reductions of 82,400 splits for 2022 were for Vietnam. Exports of 360,200 pounds were to Vietnam (280,000 pounds) and China (80,200 pounds).
Beef: Net sales of 19,300 MT for 2021 were down 24 percent from the previous week and 6 percent from the prior 4-week average. Increases primarily for South Korea (4,600 MT, including decreases of 500 MT), China (4,400 MT, including decreases of 200 MT), Canada (2,800 MT), Mexico (2,800 MT, including decreases of 100 MT), and Japan (2,100 MT, including decreases of 500 MT), were offset by reductions for Belgium (100 MT). Net sales of 5,800 MT for 2022 were primarily for South Korea (3,300 MT), Canada (900 MT), Japan (700 MT), Taiwan (400 MT), and China (200 MT). Exports of 18,200 MT were unchanged from the previous week and up 6 percent from the prior 4-week average. The destinations were primarily to South Korea (4,800 MT), Japan (4,500 MT), China (3,600 MT), Mexico (1,500 MT), and Taiwan (1,400 MT).
Pork: Net sales of 17,500 MT for 2021 were down 30 percent from the previous week and 43 percent from the prior 4-week average. Increases primarily for Mexico (11,300 MT, including decreases of 600 MT), Japan (2,400 MT, including decreases of 400 MT), South Korea (1,600 MT, including decreases of 500 MT), Colombia (1,100 MT), and Canada (400 MT, including decreases of 400 MT), were offset by reductions for Nicaragua (300 MT), China (200 MT), and Costa Rica (100 MT). Net sales of 15,600 MT for 2022 were primarily for Japan (8,300 MT), South Korea (3,700 MT), and Canada (2,700 MT). Exports of 28,900 MT were down 17 percent from the previous week and 13 percent from the prior 4-week average. The destinations were primarily to Mexico (11,900 MT), China (4,300 MT), Japan (3,500 MT), South Korea (2,700 MT), and Colombia (1,700 MT).
Terry Reilly
Senior Commodity Analyst – Grain and Oilseeds
Futures International
One Lincoln Center
18 W 140 Butterfield Rd.
Oakbrook Terrace, Il. 60181
W: 312.604.1366
ICE IM: treilly1
Skype: fi.treilly

Trading of futures, options, swaps and other derivatives is risky and is not suitable for all persons. All of these investment products are leveraged, and you can lose more than your initial deposit. Each investment product is offered only to and from jurisdictions where solicitation and sale are lawful, and in accordance with applicable laws and regulations in such jurisdiction. The information provided here should not be relied upon as a substitute for independent research before making your investment decisions. Futures International, LLC is merely providing this information for your general information and the information does not take into account any particular individual’s investment objectives, financial situation, or needs. All investors should obtain advice based on their unique situation before making any investment decision. The contents of this communication and any attachments are for informational purposes only and under no circumstances should they be construed as an offer to buy or sell, or a solicitation to buy or sell any future, option, swap or other derivative. The sources for the information and any opinions in this communication are believed to be reliable, but Futures International, LLC does not warrant or guarantee the accuracy of such information or opinions. Futures International, LLC and its principals and employees may take positions different from any positions described in this communication. Past results are not necessarily indicative of future results.