PDF attached
USDA Export Sales
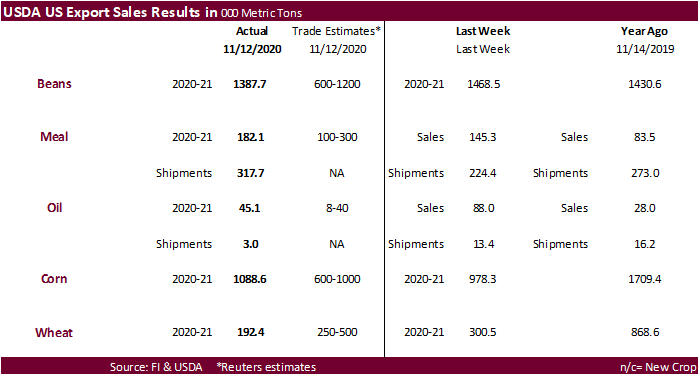
- Soybean export sales of 1.388 million tons were a marketing year low and included 1.061 million tons for China. Product sales included 182,100 tons for soybean meal and 45,100 tons for soybean oil. The soybean oil sales were perceived to be supportive. It included 25,500 tons for South Korea and 19,400 tons for the Dominican Republic.
- Wheat sales of 192,400 tons were below expectations.
- Corn export sales of 1.089 million tons were slightly above expectations and included China for 174,700 tons.
- Sorghum sales were good at 117,900 tons. China was in there for 131,200 tons but included 68,000 tons switched from unknown.
- Pork sales of 28,900 tons and China was a small part of that amount.
Export Sales Highlights
- Wheat: Net sales of 192,400 metric tons (MT) for 2020/2021–a marketing-year low–were down 36 percent from the previous week and 62 percent from the prior 4-week average. Increases primarily for China (125,000 MT), Mexico (28,700 MT, including decreases of 500 MT), and Japan (25,400 MT), were offset by reductions for the Philippines (1,100 MT), Panama (800 MT), and the United Arab Emirates (100 MT). Exports of 270,500 MT were down 24 percent from the previous week and 17 percent from the prior 4-week average. The destinations were primarily to the Philippines (78,900 MT), Japan (57,000 MT), Taiwan (52,000 MT), South Korea (34,700 MT), and Panama (24,400 MT). Optional Origin Sales: For 2020/2021, the current outstanding balance of 10,000 MT, all Spain.
- Corn: Net sales of 1,088,600 MT for 2020/2021 were up 11 percent from the previous week, but down 43 percent from the prior 4-week average. Increases primarily for Mexico (244,300 MT, including decreases of 2,300 MT), Japan (203,400 MT, including 57,000 MT switched from unknown destinations and decreases of 51,100 MT), China (174,700 MT), Colombia (171,700 MT, including decreases of 600 MT), and Taiwan (138,000 MT, including 65,000 MT switched from unknown destinations), were offset by reductions primarily for unknown destinations (162,000 MT), Guatemala (28,300 MT), and France (20,000 MT). Exports of 844,600 MT were up 16 percent from the previous week and 9 percent from the prior 4-week average. The destinations were primarily to China (278,700 MT), Mexico (205,200 MT), Japan (159,400 MT), Venezuela (67,500 MT late – see below), and Peru (52,100 MT). Optional Origin Sales: For 2020/2021, new optional origin sales of 68,000 MT were reported for South Korea. Decreases totaling 130,000 MT were reported for Vietnam. The current outstanding balance of 1,320,600 MT is for South Korea (505,000 MT), Taiwan (205,000 MT), Japan (188,000 MT), unknown destinations (167,600 MT), Vietnam (130,000 MT), China (65,000 MT), and Ukraine (60,000 MT). Late Reporting: For 2020/2021, net sales and exports totaling 67,500 MT were reported late. These sales and exports were reported for Venezuela.
- Barley: No net sales or exports were reported for the week.
- Sorghum: Net sales of 117,900 MT for 2020/2021 resulting in increases for China (131,200 MT, including 68,000 MT switched from unknown destinations) and Eritrea (30,600 MT, switched from unknown destinations), were offset by reductions for unknown destinations (30,000 MT) and Japan (13,900 MT). For 2021/2022, total net sales of 68,000 MT were reported for unknown destinations. Exports of 254,900 MT were to China (199,200 MT), Eritrea (30,600 MT), and Japan (25,100 MT).
- Rice: Net sales of 56,300 MT for 2020/2021 were up 77 percent from the previous week, but down 7 percent from the prior 4-week average. Increases were primarily for Mexico (40,400 MT), Haiti (6,200 MT, including decreases of 1,000 MT), Jordan (4,700 MT), Canada (1,800 MT), and Saudi Arabia (1,300 MT). Exports of 85,500 MT were up 17 percent from the previous week and 14 percent from the prior 4-week average. The destinations were primarily to Nicaragua (24,200 MT), Honduras (22,400 MT), Haiti (21,400 MT), Mexico (9,700 MT), and Canada (3,400 MT). Exports for Own Account: For 2020/2021, new exports for own account totaling 100 MT were to Canada. The current exports for own account outstanding balance is 100 MT, all Canada.
- Soybeans: Net sales of 1,387,700 MT for 2020/2021–a marketing-year low–were down 6 percent from the previous week and 18 percent from the prior 4-week average. Increases primarily for China (1,060,800 MT, including 528,000 MT switched from unknown destinations and decreases of 8,000 MT), Mexico (155,900 MT, including decreases of 600 MT), Spain (144,700 MT, including 122,300 MT switched from unknown destinations MT), Taiwan (83,400 MT, including decreases of 300 MT), and Indonesia (77,700 MT, including 16,500 MT switched from Taiwan and decreases of 200 MT), were offset by reductions for unknown destinations (436,600 MT). Exports of 2,558,500 MT were down 20 percent from the previous week and 6 percent from the prior 4-week average. The destinations were primarily to China (1,844,900 MT), Egypt (169,900 MT), Mexico (126,700 MT), Spain (124,700 MT), and Taiwan (59,700 MT). Optional Origin Sales: For 2020/2021, options were exercised to export 63,000 MT to China from the United States. The current outstanding balance of 63,000 MT, all China. Exports for Own Account: For 2020/2021, new exports for own account of 54,700 MT were reported for Canada. Exports for own account of 57,300 MT for Canada were applied to new or outstanding sales. The current exports for own account outstanding balance is 29,800 MT, all Canada.
- Soybean Cake and Meal: Net sales of 182,100 MT for 2020/2021, resulting in increases primarily for Mexico (63,100 MT, including decreases of 4,200 MT), Venezuela (33,700 MT, late – see below), Ecuador (27,800 MT, including 30,000 MT switched from unknown destinations and decreases of 2,800 MT), Denmark (27,500 MT, including 25,000 MT switched from unknown destinations), and Colombia (27,100 MT, including decreases of 17,700 MT), were offset by reductions primarily for unknown destinations (55,000 MT). Exports of 317,700 MT were primarily to Ecuador (56,500 MT), the Philippines (48,000 MT), Colombia (43,500 MT), Mexico (40,400 MT), and Venezuela (33,700 MT, late – see below). Late Reporting: For 2020/2021, net sales and exports totaling 33,700 MT were reported late. These sales and exports were reported for Venezuela.
- Soybean Oil: Net sales of 45,100 MT for 2020/2021, resulting in increases primarily for South Korea (25,500 MT), the Dominican Republic (19,400 MT), Canada (2,900 MT), and Guatemala (400 MT, including decreases of 100 MT), were offset by reductions for Mexico (3,200 MT). Exports of 2,900 MT were primarily to Mexico (2,200 MT) and Canada (500 MT).
- Cotton: Net sales of 131,400 RB for 2020/2021 were down 45 percent from the previous week and 40 percent from the prior 4-week average. Increases primarily for Vietnam (64,000 RB, including 4,700 RB switched from China and 2,100 RB switched from Japan), Pakistan (33,100 RB), Turkey (22,500 RB), Indonesia (13,100 RB, including 2,900 RB switched from Japan and decreases of 300 RB), and Malaysia (5,500 RB), were offset by reductions primarily for China (24,200 RB) and Japan (5,000 RB). Exports of 277,300 RB were down 5 percent from the previous week, but up 13 percent from the prior 4-week average. Exports were primarily to China (134,700 RB), Pakistan (34,800 RB), Vietnam (33,700 RB), Turkey (17,600 RB), and Mexico (13,900 RB). Net sales of Pima totaling 4,600 RB–a marketing-year low–were down 77 percent from the previous week and 82 percent from the prior 4-week average. Increases were primarily for Turkey (1,600 RB), Thailand (1,200 RB), El Salvador (600 RB), Peru (500 RB), and Taiwan (400 RB). Exports of 19,100 RB were down 12 percent from the previous week, but up 14 percent from the prior 4-week average. The destinations were primarily to China (4,600 RB), Vietnam (3,200 RB), India (3,200 RB), Peru (2,700 RB), and Bangladesh (2,300 RB). Exports for Own Account: For 2020/2021, new exports for own account of 4,500 RB were reported for China. The current exports for own account outstanding balance of 11,700 RB is for China (10,400 RB), Bangladesh (1,000 RB), and Indonesia (300 RB).
- Hides and Skins: Net sales of 273,300 pieces for 2020 were down 29 percent from the previous week and 35 percent from the prior 4-week average. Increases primarily for China (131,100 whole cattle hides, including decreases of 26,300 pieces), South Korea (67,500 whole cattle hides, including decreases of 7,900 pieces), Mexico (23,300 whole cattle hides, including decreases of 8,000 pieces), Thailand (19,500 whole cattle hides), and Taiwan (14,700 whole cattle hides, including decreases of 900 pieces), were offset by reductions for Indonesia (100 pieces). Additionally, total net sales reductions of 300 calf skins were for Italy. Net sales of 2,900 kip skins reported for China (2,600 kip skins) and Italy (900 kip skins, including decreases of 100 kip skins), were offset by reductions for Belgium (600 kip skins). Exports of 471,200 pieces reported for 2020 were up 55 percent from the previous week and 23 percent from the prior 4-week average. Whole cattle hides exports were primarily to China (368,800 pieces), Mexico (43,000 pieces), South Korea (22,400 pieces), Taiwan (9,600 pieces), and Brazil (8,000 pieces). Exports of 1,800 calf skins were to Italy. In addition, exports of 9,800 kip skins were to Belgium (7,800 kip skins) and Italy (2,000 kip skins).
- Net sales of 82,000 wet blues for 2020 were up noticeably from the previous week and 1 percent from the prior 4-week average. Increases were primarily for Vietnam (46,000 unsplit, including decreases of 4,100 unsplit), China (19,800 unsplit, including decreases of 7,500 unsplit), Thailand (7,700 unsplit, including decreases of 300 unsplit), Taiwan (5,000 unsplit), and Mexico (3,400 unsplit). Exports of 131,300 wet blues for 2020 were down 17 percent from the previous week and 22 percent from the prior 4-week average. The destinations were primarily to Vietnam (44,400 unsplit and 1,800 grain splits), China (46,000 unsplit), Thailand (28,200 unsplit), Brazil (5,700 grain splits), and Taiwan (3,000 unsplit). Net sales of 778,100 splits were primarily for Vietnam (725,800 pounds, including decreases of 11,200 pounds). For 2021, net sales reductions of 78,400 splits resulting in increases for China (30,600 pounds), were more than offset by reductions for Vietnam (109,000 pounds). Total exports of 449,900 pounds were to Vietnam.
- Beef: Net sales of 46,400 MT reported for 2020–a marketing-year–were up noticeably from the previous week and from the prior 4-week average. Increases were primarily for South Korea (17,300 MT, including decreases of 800 MT), Mexico (10,600 MT, including decreases of 200 MT), Japan (7,000 MT, including decreases of 700 MT), Hong Kong (3,200 MT, including decreases of 200 MT), and Taiwan (2,500 MT, including decreases of 100 MT). For 2021, net sales of 14,100 MT were primarily for South Korea (8,500 MT), Japan (2,900 MT), and Hong Kong (900 MT). Exports of 22,300 MT–a marketing-year high–were up 58 percent from the previous week and 27 percent from the prior 4-week average. The destinations were primarily to South Korea (6,200 MT), Japan (5,900 MT), Mexico (2,600 MT), China (2,200 MT), and Hong Kong (1,700 MT).
- Pork: Net sales of 28,900 MT reported for 2020 were down 32 percent from the previous week and 18 percent from the prior 4-week average. Increases primarily for Mexico (8,700 MT, including decreases of 600 MT), Canada (5,100 MT, including decreases of 400 MT), South Korea (5,000 MT, including decreases of 800 MT), Japan (3,900 MT, including decreases of 700 MT), and China (2,100 MT, including decreases of 1,400 MT), were offset by reductions primarily for Vietnam (100 MT). For 2021, net sales of 2,300 MT were primarily for China (900 MT), South Korea (700 MT), and the Philippines (200 MT). Exports of 38,800 MT were up 2 percent from the previous week and 4 percent from the prior 4-week average. The destinations were primarily to China (13,100 MT), Mexico (12,000 MT), Japan (4,900 MT), South Korea (2,200 MT), and Canada (1,800 MT).
U.S. EXPORT SALES FOR WEEK ENDING 11/12/2020
|
|
CURRENT MARKETING YEAR |
NEXT MARKETING YEAR |
||||||
|
COMMODITY |
NET SALES |
OUTSTANDING SALES |
WEEKLY EXPORTS |
ACCUMULATED EXPORTS |
NET SALES |
OUTSTANDING SALES |
||
|
CURRENT YEAR |
YEAR AGO |
CURRENT YEAR |
YEAR AGO |
|||||
|
|
THOUSAND METRIC TONS |
|||||||
|
WHEAT |
|
|
|
|
|
|
|
|
|
HRW |
27.5 |
1,567.2 |
1,187.9 |
60.9 |
4,646.2 |
4,606.5 |
0.0 |
22.0 |
|
SRW |
2.1 |
412.9 |
509.6 |
10.1 |
954.8 |
1,365.9 |
0.0 |
100.0 |
|
HRS |
9.1 |
1,459.7 |
1,173.0 |
103.2 |
3,377.8 |
3,116.9 |
0.0 |
45.0 |
|
WHITE |
152.7 |
2,031.5 |
782.6 |
94.4 |
2,256.2 |
2,203.2 |
0.0 |
20.0 |
|
DURUM |
1.0 |
201.9 |
257.0 |
1.8 |
341.9 |
412.2 |
0.0 |
0.0 |
|
TOTAL |
192.4 |
5,673.0 |
3,910.0 |
270.5 |
11,576.8 |
11,704.6 |
0.0 |
187.0 |
|
BARLEY |
0.0 |
31.0 |
35.0 |
0.0 |
11.8 |
23.6 |
0.0 |
0.0 |
|
CORN |
1,088.6 |
26,826.7 |
8,048.4 |
844.6 |
8,429.4 |
5,214.3 |
0.0 |
747.0 |
|
SORGHUM |
117.9 |
2,995.9 |
717.3 |
254.9 |
940.9 |
101.1 |
68.0 |
327.0 |
|
SOYBEANS |
1,387.7 |
28,940.9 |
11,352.4 |
2,558.5 |
22,347.1 |
12,244.0 |
0.0 |
69.0 |
|
SOY MEAL |
182.1 |
3,381.5 |
3,333.9 |
317.7 |
1,417.7 |
1,375.8 |
0.0 |
18.1 |
|
SOY OIL |
45.1 |
291.0 |
187.4 |
2.9 |
70.1 |
119.3 |
0.0 |
0.0 |
|
RICE |
|
|
|
|
|
|
|
|
|
L G RGH |
39.9 |
391.3 |
378.0 |
54.2 |
332.9 |
452.9 |
0.0 |
0.0 |
|
M S RGH |
0.0 |
19.6 |
17.7 |
0.7 |
9.3 |
13.1 |
0.0 |
0.0 |
|
L G BRN |
0.1 |
10.7 |
13.9 |
0.2 |
11.2 |
14.5 |
0.0 |
0.0 |
|
M&S BR |
0.1 |
19.7 |
56.0 |
0.1 |
31.0 |
1.7 |
0.0 |
0.0 |
|
L G MLD |
9.9 |
79.8 |
138.8 |
26.6 |
143.6 |
333.5 |
0.0 |
0.0 |
|
M S MLD |
6.3 |
157.2 |
187.1 |
3.7 |
112.1 |
159.0 |
0.0 |
0.0 |
|
TOTAL |
56.3 |
678.4 |
791.5 |
85.5 |
640.1 |
974.7 |
0.0 |
0.0 |
|
COTTON |
|
THOUSAND RUNNING BALES |
||||||
|
UPLAND |
131.4 |
5,465.1 |
7,373.3 |
277.3 |
3,768.3 |
2,748.1 |
0.0 |
591.6 |
|
PIMA |
4.6 |
250.5 |
165.9 |
19.1 |
201.7 |
114.3 |
0.0 |
0.7 |
Terry Reilly
Senior Commodity Analyst – Grain and Oilseeds
Futures International
One Lincoln Center
18 W 140 Butterfield Rd.
Oakbrook Terrace, Il. 60181
W: 312.604.1366
ICE IM: treilly1
Skype: fi.treilly

Trading of futures, options, swaps and other derivatives is risky and is not suitable for all persons. All of these investment products are leveraged, and you can lose more than your initial deposit. Each investment product is offered only to and from jurisdictions where solicitation and sale are lawful, and in accordance with applicable laws and regulations in such jurisdiction. The information provided here should not be relied upon as a substitute for independent research before making your investment decisions. Futures International, LLC is merely providing this information for your general information and the information does not take into account any particular individual’s investment objectives, financial situation, or needs. All investors should obtain advice based on their unique situation before making any investment decision. The contents of this communication and any attachments are for informational purposes only and under no circumstances should they be construed as an offer to buy or sell, or a solicitation to buy or sell any future, option, swap or other derivative. The sources for the information and any opinions in this communication are believed to be reliable, but Futures International, LLC does not warrant or guarantee the accuracy of such information or opinions. Futures International, LLC and its principals and employees may take positions different from any positions described in this communication. Past results are not necessarily indicative of future results.