PDF attached
USDA Export Sales
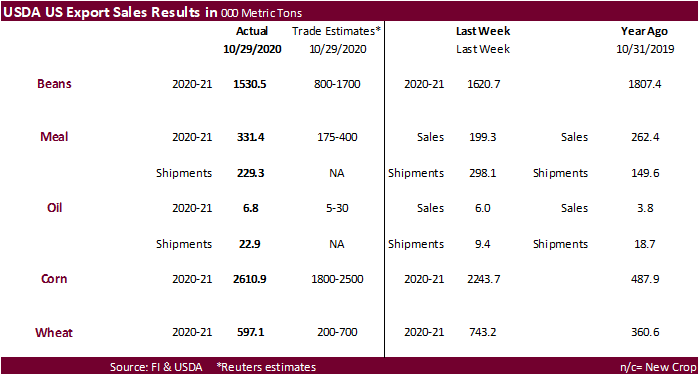
· Soybeans came in at the higher end of expectations at 1.531 million tons, slightly below the previous week and included 810,700 tons for China.
· Soybean meal export sales of 331,400 tons were ok and soybean oil of 6,800 tons were again low. Shipment so products slowed for soybean meal but improved for soybean oil.
· USDA export sales for corn of 2.611 million tons topped expectations and included 1.063 million tons for Mexico and 212,300 tons for China. Sorghum sales hit it out of the ballpark with 365,000 tons, including 340,000 tons for China. Pork sales were an excellent 42,200 tons and included 10,300 tons for China.
· All-wheat export sales of 597,100 tons were within expectations.
U.S. EXPORT SALES FOR WEEK ENDING 10/29/2020
|
|
CURRENT MARKETING YEAR |
NEXT MARKETING YEAR |
||||||
|
COMMODITY |
NET SALES |
OUTSTANDING SALES |
WEEKLY EXPORTS |
ACCUMULATED EXPORTS |
NET SALES |
OUTSTANDING SALES |
||
|
CURRENT YEAR |
YEAR |
CURRENT YEAR |
YEAR |
|||||
|
|
THOUSAND METRIC TONS |
|||||||
|
WHEAT |
|
|
|
|
|
|
|
|
|
HRW |
199.3 |
1,633.2 |
1,126.0 |
119.3 |
4,484.4 |
4,351.1 |
0.0 |
22.0 |
|
SRW |
56.3 |
418.6 |
580.1 |
22.4 |
937.7 |
1,252.7 |
0.0 |
100.0 |
|
HRS |
163.4 |
1,616.6 |
1,232.7 |
112.8 |
3,108.5 |
2,878.6 |
0.0 |
45.0 |
|
WHITE |
176.6 |
1,936.2 |
921.3 |
63.4 |
2,080.8 |
1,925.1 |
0.0 |
20.0 |
|
DURUM |
1.5 |
200.9 |
312.5 |
1.5 |
340.0 |
358.3 |
0.0 |
0.0 |
|
TOTAL |
597.1 |
5,805.5 |
4,172.5 |
319.4 |
10,951.4 |
10,765.9 |
0.0 |
187.0 |
|
BARLEY |
0.0 |
31.1 |
37.2 |
0.5 |
10.9 |
21.3 |
0.0 |
0.0 |
|
CORN |
2,610.9 |
26,335.3 |
7,954.1 |
728.8 |
6,853.9 |
3,939.0 |
541.0 |
747.0 |
|
SORGHUM |
365.0 |
3,027.0 |
492.5 |
94.9 |
614.8 |
46.2 |
55.0 |
259.0 |
|
SOYBEANS |
1,530.5 |
31,853.2 |
11,564.6 |
2,528.2 |
16,647.5 |
9,333.7 |
0.0 |
69.0 |
|
SOY MEAL |
331.4 |
3,596.4 |
3,228.2 |
229.3 |
875.5 |
939.8 |
0.0 |
18.1 |
|
SOY OIL |
6.8 |
174.2 |
132.2 |
22.9 |
53.8 |
104.7 |
0.0 |
0.0 |
|
RICE |
|
|
|
|
|
|
|
|
|
L G RGH |
8.4 |
464.5 |
421.5 |
61.9 |
215.2 |
372.5 |
0.0 |
0.0 |
|
M S RGH |
0.0 |
20.4 |
18.4 |
0.3 |
8.5 |
12.3 |
0.0 |
0.0 |
|
L G BRN |
0.2 |
11.3 |
14.6 |
0.9 |
10.3 |
13.5 |
0.0 |
0.0 |
|
M&S BR |
0.0 |
18.7 |
11.8 |
1.1 |
30.9 |
1.3 |
0.0 |
0.0 |
|
L G MLD |
4.7 |
87.1 |
117.5 |
3.7 |
112.7 |
325.0 |
0.0 |
0.0 |
|
M S MLD |
15.1 |
146.6 |
149.9 |
19.0 |
103.9 |
150.3 |
0.0 |
0.0 |
|
TOTAL |
28.3 |
748.8 |
733.7 |
87.0 |
481.6 |
874.9 |
0.0 |
0.0 |
|
COTTON |
|
THOUSAND RUNNING BALES |
||||||
|
UPLAND |
115.6 |
5,667.3 |
7,064.6 |
270.0 |
3,198.0 |
2,484.1 |
55.7 |
576.8 |
|
PIMA |
16.8 |
266.3 |
156.0 |
21.9 |
161.0 |
105.3 |
0.0 |
0.7 |
This summary is based on reports from exporters for the period October 23-29, 2020.
- Wheat: Net sales of 597,100 metric tons (MT) for 2020/2021 were down 20 percent from the previous week, but up 10 percent from the prior 4-week average. Increases were primarily for unknown destinations (138,500 MT), Taiwan (88,600 MT), South Korea (86,300 MT, including decreases of 500 MT), the Philippines (59,000 MT), and Colombia (50,300 MT). Exports of 319,400 MT were down 28 percent from the previous week and 31 percent from the prior 4-week average. The destinations were primarily to South Korea (83,800 MT), Japan (65,900 MT), Nigeria (58,300 MT), Venezuela (45,400 MT, including 35,000 MT late – see below), and Jamaica (22,200 MT). Optional Origin Sales: For 2020/2021, the current outstanding balance of 10,000 MT, all Spain. Late Reporting: For 2020/2021, net sales totaling 35,000 MT were reported late. The destination was Venezuela. Exports totaling 57,100 MT were reported late. The destinations were Venezuela (35,000 MT) and Italy (22,100 MT).
- Corn: Net sales of 2,610,900 MT for 2020/2021 were up 16 percent from the previous week and 75 percent from the prior 4-week average. Increases primarily for Mexico (1,062,600 MT, including 13,000 MT switched from unknown destinations and decreases of 5,300 MT), unknown destinations (781,600 MT), China (212,300 MT, including decreases of 1,400 MT), South Korea (132,700 MT), and Colombia (127,700 MT, including 49,000 MT switched from unknown destinations and decreases of 5,400 MT), were offset by reductions for Guatemala (800 MT). For 2021/2022, total net sales of 541,000 MT were for Mexico. Exports of 728,800 MT were down 1 percent from the previous week and 14 percent from the prior 4-week average. The destinations were primarily to China (330,300 MT), Mexico (208,600 MT), Colombia (101,100 MT), Honduras (28,100 MT), and Japan (23,600 MT). Optional Origin Sales: For 2020/2021, new optional origin sales of 327,000 MT were reported for South Korea (262,000 MT) and Japan (65,000 MT). Decreases totaling 30,000 MT were reported for Ukraine. The current outstanding balance of 1,327,600 MT is for South Korea (382,000 MT), Vietnam (260,000 MT), Taiwan (205,000 MT), Japan (188,000 MT), unknown destinations (167,600 MT), and Ukraine (125,000 MT). Late Reporting: For 2020/2021, exports totaling 7,200 MT were reported late. The destination was Jamaica.
- Barley: No net sales were reported for the week. Exports of 500 MT were to Japan (300 MT) and Taiwan (200 MT).
- Sorghum: Net sales of 365,000 MT for 2020/2021 resulting in increases for China (340,500 MT, including 98,000 MT switched from unknown destinations and decreases of 3,900 MT) and unknown destinations (25,000 MT), were offset by reductions for Mexico (500 MT). For 2021/2022, total net sales of 55,000 MT were for unknown destinations. Exports of 94,900 MT were to China.
- Rice: Net sales of 28,300 MT for 2020/2021 were down 77 percent from the previous week and 75 percent from the prior 4-week average. Increases were primarily for Jordan (6,600 MT), Mexico (6,100 MT, including decreases of 100 MT), Japan (4,300 MT), Brazil (2,700 MT), and Saudi Arabia (2,400 MT). Exports of 87,000 MT–a marketing-year high–were up 59 percent from the previous week and 83 percent from the prior 4-week average. The destinations were primarily to Mexico (33,200 MT), Brazil (29,700 MT), Japan (13,100 MT), Saudi Arabia (2,900 MT), and Canada (2,900 MT).
- Soybeans: Net sales of 1,530,500 MT for 2020/2021 were down 6 percent from the previous week and 32 percent from the prior 4-week average. Increases primarily for China (810,700 MT, including 578,600 MT switched from unknown destinations and decreases of 66,600 MT), Egypt (283,800 MT, including decreases of 200 MT), Mexico (92,700 MT, including decreases of 1,500 MT), the Netherlands (85,800 MT, including 78,000 MT switched from unknown destinations), and Canada (71,400 MT, including decreases of 600 MT), were offset by reductions primarily for unknown destinations (27,000 MT). Exports of 2,528,200 MT were down 6 percent from the previous week, but up 6 percent from the prior 4-week average. The destinations were primarily to China (1,938,700 MT), Bangladesh (106,000 MT), Mexico (87,200 MT), the Netherlands (85,300 MT), and Pakistan (68,600 MT). Optional Origin Sales: For 2020/2021, the current outstanding balance of 126,000 MT, all China. Exports for Own Account: For 2020/2021, the current exports for own account outstanding balance is 32,300 MT, all Canada. Late Reporting: For 2020/2021, exports totaling 137,500 MT were reported late. The destination was to China.
- Soybean Cake and Meal: Net sales of 331,400 MT for 2020/2021 primarily for the Philippines (138,800 MT, including decreases of 200 MT), Italy (45,000 MT), Mexico (35,400 MT, including decreases of 6,100 MT), Peru (30,000 MT), and Canada (29,800 MT, including decreases of 400 MT), were offset by reductions primarily for Japan (29,600 MT). Exports of 229,300 MT were primarily to the Philippines (93,600 MT), Colombia (44,100 MT), Canada (28,500 MT), Venezuela (23,000 MT), and Mexico (21,900 MT).
- Soybean Oil: Net sales of 6,800 MT for 2020/2021 were primarily for Mexico (4,400 MT), Canada (1,200 MT), Venezuela (500 MT), Guatemala (500 MT), and the Dominican Republic (200 MT). Exports of 22,900 MT were primarily to South Korea (13,400 MT), the Dominican Republic (3,900 MT), Guatemala (3,800 MT), Mexico (1,000 MT), and Canada (700 MT).
- Cotton: Net sales of 115,600 RB for 2020/2021 were down 60 percent from the previous week and 42 percent from the prior 4-week average. Increases primarily for China (47,300 RB, including decreases of 38,300 RB), Pakistan (25,200 RB), Turkey (22,500 RB, including decreases of 22,100 RB), South Korea (16,600 RB), and Guatemala (15,900 RB, including 400 RB switched from El Salvador), were offset by reductions primarily for Bangladesh (44,100 RB) and Mexico (10,100 RB). For 2021/2022, net sales of 55,700 RB were primarily for Guatemala (26,000 RB), El Salvador (14,100 RB), and China (8,800 RB). Exports of 270,000 RB were up 18 percent from the previous week and 43 percent from the prior 4-week average. Exports were primarily to China (127,400 RB), Vietnam (41,700 RB), Pakistan (27,800 RB), Bangladesh (20,200 RB), and Mexico (17,800 RB). Net sales of Pima totaling 16,800 RB were down 49 percent from the previous week and 34 percent from the prior 4-week average. Increases primarily for Pakistan (5,700 RB), India (5,200 RB, including decreases of 400 RB), China (2,400 RB, including decreases of 2,200 RB), Peru (2,000 RB), and Turkey (900 RB, including 600 RB switched from Germany), were offset by reductions for Germany (600 RB). Exports of 21,900 RB–a marketing-year high–were up 38 percent from the previous week and 69 percent from the prior 4-week average. The destinations were primarily to India (7,200 RB), China (7,000 RB), Pakistan (3,000 RB), Vietnam (2,200 RB), and Thailand (500 RB). Exports for Own Account: For 2020/2021, new exports for own account totaling 3,600 RB were to China. Exports for own account totaling 5,500 RB to China were applied to new or outstanding sales. Decreases were reported for Indonesia (3,600 RB). The current exports for own account outstanding balance of 7,200 RB is for China (5,900 RB), Bangladesh (1,000 RB), and Indonesia (300 RB).
· Hides and Skins: Net sales of 401,800 pieces for 2020 were down 4 percent from the previous week, but up 3 percent from the prior 4-week average. Increases primarily for China (285,700 whole cattle hides, including decreases of 14,900 pieces), South Korea (49,400 whole cattle hides, including decreases of 2,600 pieces), Mexico (33,400 whole cattle hides, including decreases of 600 pieces), Brazil (20,100 whole cattle hides, including decreases of 100 pieces), and Thailand (9,400 whole cattle hides, including decreases of 100 pieces), were offset by reductions for Indonesia (400 pieces), Vietnam (200 pieces), and Japan (200 pieces). For 2021, total net sales of 7,200 pieces were for China. Exports of 374,900 pieces reported for 2020 were down 18 percent from the previous week and 15 percent from the prior 4-week average. Whole cattle hides exports were primarily to China (304,400 pieces), South Korea (27,100 pieces), Mexico (15,800 pieces), Taiwan (6,100 pieces), and Indonesia (4,800 pieces). In addition, exports of 5,200 calf skins were to Italy.
· Net sales of 70,300 wet blues for 2020 were up 18 percent from the previous week, but down 39 percent from the prior 4-week average. Increases reported for China (56,900 unsplit, including decreases of 100 unsplit), Thailand (12,000 unsplit, including decreases of 100 unsplit), Mexico (8,000 grain splits), Brazil (1,800 grain splits, including decreases of 300 grain splits), and South Korea (800 unsplit), were offset by reductions primarily for Vietnam (7,200 grain splits and 1,700 unsplit). For 2021, total net sales of 15,200 wet blues were reported for Vietnam (8,000 unsplit and 7,200 grain splits). Exports of 200,300 wet blues for 2020 were up 8 percent from the previous week and 28 percent from the prior 4-week average. The destinations were primarily to Italy (56,400 unsplit and 9,800 grain splits), China (61,300 unsplit), Vietnam (53,100 unsplit), Thailand (5,800 unsplit), and Taiwan (3,700 unsplit and 1,800 grain splits). Net sales of 264,900 splits resulting in increases for Vietnam (270,900 pounds, including decreases of 70,200 pounds), were offset by reductions for China (6,000 pounds). For 2021, net sales of 93,600 splits resulting in increases for China (143,300 pounds), were offset by reductions for Vietnam (49,800 pounds). Exports of 826,600 pounds were primarily to Vietnam (782,900 pounds).
· Beef: Net sales of 20,400 MT reported for 2020 were up 8 percent from the previous week and 9 percent from the prior 4-week average. Increases primarily for Japan (4,700 MT, including decreases of 400 MT), South Korea (4,600 MT, including decreases of 700 MT), China (3,600 MT, including decreases of 100 MT), Mexico (2,500 MT), and Taiwan (1,900 MT, including decreases of 100 MT), were offset by reductions for Colombia (100 MT). For 2021, net sales of 4,500 MT were primarily for South Korea (4,000 MT), Japan (200 MT), and Hong Kong (200 MT). Exports of 21,400 MT–a marketing-year high–were up 26 percent from the previous week and from the prior 4-week average. The destinations were primarily to South Korea (5,600 MT), Japan (5,000 MT), China (2,700 MT), Mexico (2,300 MT), and Hong Kong (1,800 MT).
· Pork: Net sales of 42,200 MT reported for 2020 were up 46 percent from the previous week and 18 percent from the prior 4-week average. Increases were primarily for Mexico (14,700 MT, including decreases of 700 MT), China (10,300 MT, including decreases of 1,400 MT), South Korea (5,100 MT, including decreases of 100 MT), Japan (3,300 MT, including decreases of 100 MT), and Colombia (2,400 MT). For 2021, net sales of 800 MT were primarily for Chile (400 MT), Australia (200 MT), and Japan (100 MT). Exports of 37,700 MT were up 1 percent from the previous week and 3 percent from the prior 4-week average. The destinations were primarily to China (14,600 MT), Mexico (10,000 MT), Japan (4,500 MT), Canada (2,100 MT), and South Korea (1,600 MT).
Terry Reilly
Senior Commodity Analyst – Grain and Oilseeds
Futures International
One Lincoln Center
18 W 140 Butterfield Rd.
Oakbrook Terrace, Il. 60181
W: 312.604.1366
ICE IM: treilly1
Skype: fi.treilly

Trading of futures, options, swaps and other derivatives is risky and is not suitable for all persons. All of these investment products are leveraged, and you can lose more than your initial deposit. Each investment product is offered only to and from jurisdictions where solicitation and sale are lawful, and in accordance with applicable laws and regulations in such jurisdiction. The information provided here should not be relied upon as a substitute for independent research before making your investment decisions. Futures International, LLC is merely providing this information for your general information and the information does not take into account any particular individual’s investment objectives, financial situation, or needs. All investors should obtain advice based on their unique situation before making any investment decision. The contents of this communication and any attachments are for informational purposes only and under no circumstances should they be construed as an offer to buy or sell, or a solicitation to buy or sell any future, option, swap or other derivative. The sources for the information and any opinions in this communication are believed to be reliable, but Futures International, LLC does not warrant or guarantee the accuracy of such information or opinions. Futures International, LLC and its principals and employees may take positions different from any positions described in this communication. Past results are not necessarily indicative of future results.