PDF attached
Macros
US GDP Annualized (Q/Q) Q3 A: 33.1% (est 32.0%; prev -31.4%)
US Core PCE (Q/Q) Q3 A: 3.5% (est 4.0%; prev -0.8%)
US GDP Price Index Q3 A: 3.6% (est 2.9%; prev -1.8%)
US GDP Personal Consumption Q3 A: 40.7% (est 38.9%; prev -33.2%)
US Initial Jobless Claims Oct 24: 751K (est 770K; prevR 791K; prev 787K)
US Continuing Claims Oct 17: 7756K (est 7775K; prevR 8465K; prev 8373K)
Canadian Building Permits (M/M) Sep: 17.0% (prev 1.7%)
Canadian Payrolls Rise 303.2K In August – StatsCan
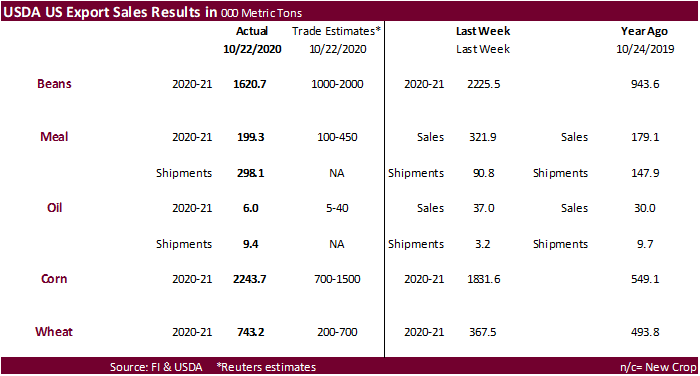
USDA Export Sales
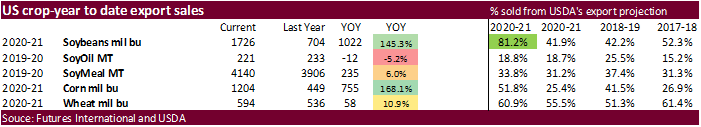
· Export sales for the US soybean complex were withing expectations. Of the 1.621 million tons of soybeans, 1.074 million were for China. Soybean commitments are running 81 percent of USDA’s export projection.
· Corn export sales of 2.244 million tons were well above expectations and included 763,700 tons for unknown. Pork sales were 29,000 tons.
· USDA export sales for all-wheat of 743,200 tons were above expectations.
U.S. EXPORT SALES FOR WEEK ENDING 10/22/2020
|
|
CURRENT MARKETING YEAR |
NEXT MARKETING YEAR |
||||||
|
COMMODITY |
NET SALES |
OUTSTANDING SALES |
WEEKLY EXPORTS |
ACCUMULATED EXPORTS |
NET SALES |
OUTSTANDING SALES |
||
|
CURRENT YEAR |
YEAR |
CURRENT YEAR |
YEAR |
|||||
|
|
THOUSAND METRIC TONS |
|||||||
|
WHEAT |
|
|
|
|
|
|
|
|
|
HRW |
130.7 |
1,553.2 |
1,190.9 |
220.8 |
4,365.1 |
4,195.6 |
0.0 |
22.0 |
|
SRW |
16.8 |
384.8 |
573.3 |
35.9 |
915.3 |
1,248.7 |
0.0 |
100.0 |
|
HRS |
150.1 |
1,566.0 |
1,234.0 |
91.1 |
2,995.7 |
2,758.6 |
40.0 |
45.0 |
|
WHITE |
448.7 |
1,823.0 |
943.3 |
77.9 |
2,017.4 |
1,836.6 |
20.0 |
20.0 |
|
DURUM |
-3.1 |
200.9 |
279.0 |
16.9 |
338.5 |
317.9 |
0.0 |
0.0 |
|
TOTAL |
743.2 |
5,527.8 |
4,220.5 |
442.5 |
10,632.1 |
10,357.3 |
60.0 |
187.0 |
|
BARLEY |
0.0 |
31.6 |
38.0 |
1.3 |
10.4 |
19.5 |
0.0 |
0.0 |
|
CORN |
2,243.7 |
24,453.2 |
7,784.0 |
734.2 |
6,125.1 |
3,621.1 |
0.0 |
206.0 |
|
SORGHUM |
60.8 |
2,756.9 |
276.1 |
56.4 |
519.9 |
46.0 |
68.0 |
204.0 |
|
SOYBEANS |
1,620.7 |
32,850.8 |
11,316.7 |
2,696.1 |
14,119.3 |
7,831.3 |
9.0 |
69.0 |
|
SOY MEAL |
199.3 |
3,494.3 |
3,115.4 |
298.1 |
646.2 |
790.1 |
0.0 |
18.1 |
|
SOY OIL |
6.0 |
190.3 |
147.2 |
9.4 |
30.9 |
86.0 |
0.0 |
0.0 |
|
RICE |
|
|
|
|
|
|
|
|
|
L G RGH |
20.5 |
518.0 |
409.5 |
27.7 |
153.3 |
370.7 |
0.0 |
0.0 |
|
M S RGH |
0.0 |
20.7 |
18.8 |
0.5 |
8.2 |
12.0 |
0.0 |
0.0 |
|
L G BRN |
0.0 |
12.0 |
14.9 |
0.1 |
9.4 |
13.1 |
0.0 |
0.0 |
|
M&S BR |
0.0 |
19.8 |
11.2 |
0.9 |
29.8 |
1.3 |
0.0 |
0.0 |
|
L G MLD |
58.9 |
86.2 |
151.5 |
20.5 |
109.0 |
287.4 |
0.0 |
0.0 |
|
M S MLD |
42.1 |
150.6 |
130.1 |
5.0 |
84.9 |
135.0 |
0.0 |
0.0 |
|
TOTAL |
121.5 |
807.4 |
735.9 |
54.5 |
394.6 |
819.5 |
0.0 |
0.0 |
|
COTTON |
|
THOUSAND RUNNING BALES |
||||||
|
UPLAND |
288.7 |
5,821.8 |
7,029.8 |
228.8 |
2,927.9 |
2,354.4 |
0.9 |
521.1 |
|
PIMA |
32.7 |
271.4 |
131.5 |
15.9 |
139.1 |
99.8 |
0.0 |
0.7 |
This summary is based on reports from exporters for the period October 16-22, 2020.
· Wheat: Net sales of 743,200 metric tons (MT) for 2020/2021 were up noticeably from the previous week and up 54 percent from the prior 4-week average. Increases primarily for South Korea (195,000 MT), Mexico (111,400 MT, including decreases of 100 MT), Japan (61,700 MT, including decreases of 1,200 MT), the Philippines (60,000 MT), and China (60,000 MT), were offset by reductions primarily for Guatemala (14,000 MT). For 2021/2022, total net sales of 60,000 MT were for the Philippines. Exports of 442,500 MT were up noticeably from the previous week, but down 14 percent from the prior 4-week average. The destinations were primarily to Japan (105,400 MT), Guatemala (70,700 MT), Brazil (65,900 MT, including 32,900 MT late – see below), Taiwan (53,200 MT), and Mexico (39,100 MT). Optional Origin Sales: For 2020/2021, the current outstanding balance of 10,000 MT, all Spain. Late Reporting: For 2020/2021, exports totaling 46,000 MT were reported late. The destinations were Brazil (32,900 MT) and Trinidad (13,100 MT).
- Corn: Net sales of 2,243,700 MT for 2020/2021 were up 23 percent from the previous week and 56 percent from the prior 4-week average. Increases primarily for unknown destinations (763,700 MT), Mexico (496,800 MT, including decreases of 7,000 MT), Japan (483,200 MT, including 11,900 MT switched from unknown destinations and decreases of 58,400 MT), Colombia (187,100 MT, including decreases of 16,300 MT), and Israel (82,500 MT), were offset by reductions for the Dominican Republic (15,500 MT), Costa Rica (13,500 MT), and Canada (7,600 MT). Exports of 734,200 MT were down 18 percent from the previous week and 14 percent from the prior 4-week average. The destinations were primarily to Mexico (253,200 MT), China (134,100 MT), Colombia (80,000 MT), Japan (71,400 MT), and Guatemala (62,300 MT). Optional Origin Sales: For 2020/2021, new optional origin sales of 322,800 MT were reported for Japan (123,000 MT), unknown destinations (114,000 MT), South Korea (55,000 MT), Ukraine (30,000 MT), and Taiwan (800 MT). Options was exercised to export 127,000 MT to Argentina from other than the United States. The current outstanding balance of 1,030,600 MT is for Vietnam (260,000 MT), Taiwan (205,000 MT), unknown destinations (167,600 MT), Ukraine (155,000 MT), Japan (123,000 MT), and South Korea (120,000 MT).
- Barley: No net sales were reported for the week. Exports of 1,300 MT were to Japan (700 MT), South Korea (300 MT), and Taiwan (300 MT).
- Sorghum: Net sales of 60,800 MT for 2020/2021 resulting in increases for China (118,800 MT, including 58,000 MT switched from unknown destinations and decreases of 2,200 MT), were offset by reductions for unknown destinations (58,000 MT). For 2021/2022, total net sales of 68,000 MT were for China. Exports of 56,400 MT were to China.
- Rice: Net sales of 121,500 MT for 2020/2021 were up 99 percent from the previous week and 7 percent from the prior 4-week average. Increases primarily for Haiti (52,600 MT, including decreases of 300 MT), Japan (39,000 MT), Mexico (20,100 MT, including decreases of 100 MT), Canada (2,900 MT), and Brazil (2,000 MT), were offset by reductions for El Salvador (1,000 MT). Exports of 54,500 MT were down 36 percent from the previous week, but up 49 percent from the prior 4-week average. The destinations were primarily to Brazil (25,900 MT), Haiti (15,200 MT), Mexico (3,400 MT), Saudi Arabia (3,000 MT), and Canada (2,800 MT).
- Soybeans: Net sales of 1,620,700 MT for 2020/2021 were down 27 percent from the previous week and 35 percent from the prior 4-week average. Increases primarily for China (1,073,900 MT, including 593,000 MT switched from unknown destinations and decreases of 88,400 MT), Mexico (178,700 MT, including decreases of 400 MT), the Netherlands (175,600 MT, including 165,500 MT switched from unknown destinations and decreases of 5,400 MT), Egypt (153,400 MT), and Singapore (65,100 MT), were offset by reductions primarily for unknown destinations (350,500 MT). For 2021/2022, total net sales of 9,000 MT were for Japan. Exports of 2,696,100 MT were up 7 percent from the previous week and 35 percent from the prior 4-week average. The destinations were primarily to China (1,939,800 MT), Mexico (187,400 MT), the Netherlands (175,600 MT), Thailand (82,300 MT), and South Korea (60,000 MT). Optional Origin Sales: For 2020/2021, the current outstanding balance of 126,000 MT, all China. Exports for Own Account: For 2020/2021, new exports for own account totaling 25,000 MT were to Canada. The current exports for own account outstanding balance is 32,300 MT, all Canada. Late Reporting: For 2020/2021, exports totaling 28,400 MT were reported late. The destination was Egypt.
- Soybean Cake and Meal: Net sales of 199,300 MT for 2020/2021 primarily for Mexico (84,200 MT, including decreases of 18,100 MT), Colombia (44,400 MT), Ecuador (24,400 MT, including decreases of 700 MT), the Philippines (20,000 MT, including decreases of 100 MT), and Morocco (16,500 MT), were offset by reductions primarily for China (20,000 MT). Exports of 298,100 MT were primarily to Spain (50,900 MT), the Philippines (46,900 MT), Mexico (44,300 MT), Colombia (34,500 MT), and the Dominican Republic (31,200 MT).
- Soybean Oil: Net sales of 6,000 MT for 2020/2021 primarily for Canada (2,200 MT), El Salvador (2,000 MT, switched from Nicaragua), the Dominican Republic (1,100 MT, including decreases of 1,700 MT), Venezuela (1,000 MT), and Costa Rica (1,000 MT), were offset by reductions for Nicaragua (2,000 MT). Exports of 9,400 MT were primarily to Guatemala (4,500 MT), Mexico (1,700 MT), Canada (1,000 MT), Honduras (1,000 MT), and the Dominican Republic (1,000 MT).
- Cotton: Net sales of 288,700 RB for 2020/2021 were up 27 percent from the previous week and 56 percent from the prior 4-week average. Increases primarily for Pakistan (125,900 RB, including decreases of 700 RB), China (81,400 RB, including decreases of 12,500 RB), Mexico (41,600 RB, including decreases of 2,800 RB), Egypt (26,400 RB), and Vietnam (25,800 RB, including 2,100 RB switched from Japan and decreases of 1,900 RB), were offset by reductions primarily for Turkey (40,300 RB). For 2021/2022, net sales of 900 RB resulting in increases of Mexico (3,100 RB) and Brazil (400 RB), were offset by reductions for China (2,600 RB). Exports of 228,800 RB were up 18 percent from the previous week and 23 percent from the prior 4-week average. Exports were primarily to China (103,600 RB), Vietnam (22,600 RB), Mexico (17,500 RB), Pakistan (16,200 RB), and Indonesia (12,500 RB). Net sales of Pima totaling 32,700 RB–a marketing-year high–were up 10 percent from the previous week and 47 percent from the prior 4-week average. Increases were primarily for China (10,600 RB, including decreases of 2,200 RB), India (6,000 RB), Vietnam (5,400 RB, including 900 RB switched from Hong Kong), Pakistan (4,100 RB), and Thailand (2,000 RB), were offset by reductions for Hong Kong (900 RB). Exports of 15,900 RB were up noticeably from the previous week and up 36 percent from the prior 4-week average. The destinations were primarily to China (6,700 RB), Bangladesh (2,900 RB), Vietnam (2,600 RB), India (1,000 RB), and Pakistan (700 RB). Exports for Own Account: For 2020/2021, exports for own account totaling 7,400 RB to China were applied to new or outstanding sales. The current exports for own account outstanding balance of 12,700 RB is for China (7,800 RB), Indonesia (3,900 RB), and Bangladesh (1,000 RB).
- Hides and Skins: Net sales of 417,100 pieces for 2020 were down 13 percent from the previous week, but up 17 percent from the prior 4-week average. Increases primarily for China (334,000 whole cattle hides, including decreases of 21,800 pieces), South Korea (51,400 whole cattle hides, including decreases of 1,200 pieces), Mexico (26,800 whole cattle hides, including decreases of 1,500 pieces), Taiwan (3,500 whole cattle hides, including decreases of 400 pieces), Thailand (3,400 whole cattle hides), and Italy (700 whole cattle hides), were offset by reductions for Canada (300 pieces). Additionally, total net sales reductions of 300 kip skins were reported for Belgium. Exports of 457,600 pieces reported for 2020 were up 15 percent from the previous week and 4 percent from the prior 4-week average. Whole cattle hides exports were primarily to China (355,600 pieces), South Korea (49,100 pieces), Mexico (35,700 pieces), Taiwan (3,500 pieces), and Turkey (2,900 pieces). In addition, exports of 5,100 kip skins were primary to China (2,600 kip skins).
· Net sales of 59,600 wet blues for 2020 were down 66 percent from the previous week and 57 percent from the prior 4-week average. Increases primarily for Thailand (45,600 unsplit, including decreases of 400 unsplit), ), China (30,400 unsplit, including decreases of 700 unsplit), Vietnam (9,500 unsplit, including decreases of 100 unsplit), Taiwan (9,300 unsplit), and Mexico (3,300 unsplit, including decreases of 200 unsplit), were offset by reductions for Italy (30,800 unsplit and 8,300 grain splits) and Brazil (200 grain splits). For 2021, total net sales of 67,400 wet blues were reported for Italy (33,000 unsplit and 17,900 grain splits), Thailand (10,000 unsplit), and Taiwan (6,500 unsplit). Exports of 185,900 wet blues for 2020 were up 46 percent from the previous week and 22 percent from the prior 4-week average. The destinations were primarily to China (56,200 unsplit), Italy (29,000 unsplit and 6,600 grain splits), Vietnam (31,300 unsplit and 4,000 grain splits), Thailand (31,300 unsplit), and Brazil (7,600 grain splits and 2,400 unsplit). Net sales of 7,900 splits were for Vietnam (7,400 pounds, including decreases of 15,000 pounds) and Taiwan (500 pounds). For 2021, total net sales of 721,300 splits were for Vietnam. Exports of 441,500 pounds were to Vietnam (358,000 pounds), Taiwan (42,500 pounds), and China (41,000 pounds).
· Beef: Net sales of 18,900 MT reported for 2020 were down 13 percent from the previous week and 6 percent from the prior 4-week average. Increases primarily for China (4,300 MT), Japan (4,200 MT, including decreases of 200 MT), South Korea (4,200 MT, including decreases of 1,500 MT), Mexico (2,200 MT), and Taiwan (1,400 MT, including decreases of 100 MT), were offset by reductions primarily for Colombia (100 MT) and Chile (100 MT). For 2021, net sales of 4,600 MT were primarily for Japan (2,700 MT), South Korea (1,100 MT), Hong Kong (500 MT), and Guatemala (200 MT). Exports of 16,900 MT were down 5 percent from the previous week, but unchanged from the prior 4-week average. The destinations were primarily to Japan (4,300 MT), South Korea (3,700 MT), Mexico (1,900 MT), Hong Kong (1,700 MT), and China (1,600 MT).
· Pork: Net sales of 29,000 MT reported for 2020 were up 8 percent from the previous week, but down 24 percent from the prior 4-week average. Increases were primarily for Mexico (8,400 MT, including decreases of 1,500 MT), Japan (6,400 MT, including decreases of 200 MT), South Korea (2,900 MT, including decreases of 400 MT), China (2,500 MT, including decreases of 600 MT), and Australia (2,200 MT). For 2021, net sales of 7,000 MT were primarily for Australia (5,500 MT) and China (1,300 MT). Exports of 37,100 MT were up 2 percent from the previous week and 5 percent from the prior 4-week average. The destinations were primarily to China (12,900 MT), Mexico (11,000 MT), Japan (4,500 MT), Canada (2,400 MT), and South Korea (2,100 MT).
Terry Reilly
Senior Commodity Analyst – Grain and Oilseeds
Futures International
One Lincoln Center
18 W 140 Butterfield Rd.
Oakbrook Terrace, Il. 60181
W: 312.604.1366
ICE IM: treilly1
Skype: fi.treilly

Trading of futures, options, swaps and other derivatives is risky and is not suitable for all persons. All of these investment products are leveraged, and you can lose more than your initial deposit. Each investment product is offered only to and from jurisdictions where solicitation and sale are lawful, and in accordance with applicable laws and regulations in such jurisdiction. The information provided here should not be relied upon as a substitute for independent research before making your investment decisions. Futures International, LLC is merely providing this information for your general information and the information does not take into account any particular individual’s investment objectives, financial situation, or needs. All investors should obtain advice based on their unique situation before making any investment decision. The contents of this communication and any attachments are for informational purposes only and under no circumstances should they be construed as an offer to buy or sell, or a solicitation to buy or sell any future, option, swap or other derivative. The sources for the information and any opinions in this communication are believed to be reliable, but Futures International, LLC does not warrant or guarantee the accuracy of such information or opinions. Futures International, LLC and its principals and employees may take positions different from any positions described in this communication. Past results are not necessarily indicative of future results.