PDF attached
USDA Export Sales showed China expanding purchases to soybean meal, oil, and sorghum.
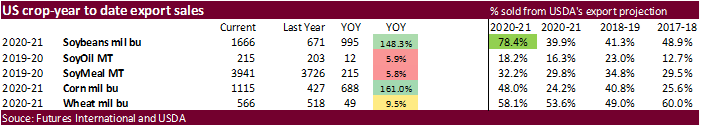
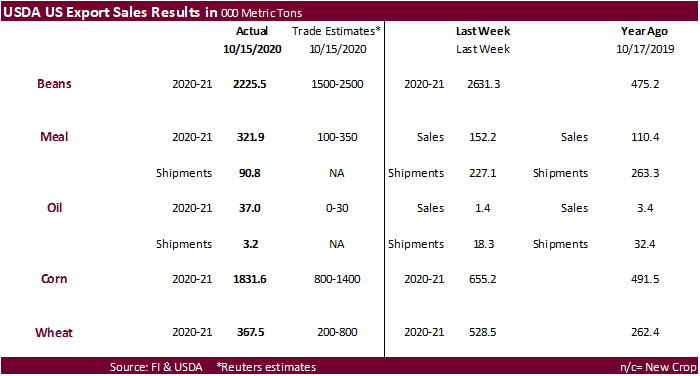
· Soybean export sales of 2.226 million tons were within expectations. China took 1.222 million tons and Egypt for 194,400 tons.
· Soybean meal sales improved to 321,900 tons from 152,200 tons previous week. China took 20,000 tons.
· Soybean oil sales were good at 37,000 tons from only 1,400 tons previous week. China took 11,000 tons.
· USDA corn export sales were 1.832 million tons, well up from 655,200 tons from the previous week and above trade expectations. The corn sales included Japan (490,100 MT, including 162,800 MT switched from unknown destinations and decreases of 10,000 MT), China (433,500 MT), and Mexico (377,400 MT, including decreases of 35,400 MT).
· Sorghum export sales of 280,000 tons included 195,800 tons for China.
· Pork sales were 26,800 tons, unchanged from the previous week.
· All-wheat export sales were 367,500 tons, within expectations. Mexico and Nigeria were the largest buyers.
U.S. EXPORT SALES FOR WEEK ENDING 10/15/2020
|
|
CURRENT MARKETING YEAR |
NEXT MARKETING YEAR |
||||||
|
COMMODITY |
NET SALES |
OUTSTANDING SALES |
WEEKLY EXPORTS |
ACCUMULATED EXPORTS |
NET SALES |
OUTSTANDING SALES |
||
|
CURRENT YEAR |
YEAR |
CURRENT YEAR |
YEAR |
|||||
|
|
THOUSAND METRIC TONS |
|||||||
|
WHEAT |
|
|
|
|
|
|
|
|
|
HRW |
157.5 |
1,643.2 |
1,240.1 |
47.6 |
4,144.4 |
4,049.3 |
0.0 |
22.0 |
|
SRW |
89.0 |
403.9 |
616.8 |
3.0 |
879.4 |
1,162.9 |
0.0 |
100.0 |
|
HRS |
55.9 |
1,507.0 |
1,171.8 |
78.9 |
2,904.7 |
2,643.9 |
0.0 |
5.0 |
|
WHITE |
64.8 |
1,452.2 |
916.0 |
62.6 |
1,939.5 |
1,765.8 |
0.0 |
0.0 |
|
DURUM |
0.3 |
220.9 |
204.5 |
0.0 |
321.6 |
312.9 |
0.0 |
0.0 |
|
TOTAL |
367.5 |
5,227.2 |
4,149.2 |
192.1 |
10,189.5 |
9,934.8 |
0.0 |
127.0 |
|
BARLEY |
0.0 |
32.9 |
38.6 |
0.2 |
9.1 |
18.9 |
0.0 |
0.0 |
|
CORN |
1,831.6 |
22,943.7 |
7,729.2 |
898.0 |
5,390.9 |
3,126.8 |
0.0 |
206.0 |
|
SORGHUM |
280.8 |
2,752.5 |
220.2 |
70.1 |
463.5 |
45.9 |
0.0 |
136.0 |
|
SOYBEANS |
2,225.5 |
33,926.3 |
12,096.4 |
2,516.5 |
11,423.2 |
6,164.8 |
0.0 |
60.0 |
|
SOY MEAL |
321.9 |
3,593.0 |
3,084.2 |
90.8 |
348.1 |
642.3 |
0.0 |
18.1 |
|
SOY OIL |
37.0 |
193.7 |
126.9 |
3.1 |
21.5 |
76.3 |
-0.2 |
0.0 |
|
RICE |
|
|
|
|
|
|
|
|
|
L G RGH |
28.4 |
525.2 |
429.3 |
46.8 |
125.6 |
317.2 |
0.0 |
0.0 |
|
M S RGH |
0.0 |
21.3 |
18.8 |
5.2 |
7.6 |
12.0 |
0.0 |
0.0 |
|
L G BRN |
1.1 |
12.0 |
23.2 |
0.4 |
9.4 |
4.5 |
0.0 |
0.0 |
|
M&S BR |
0.1 |
20.6 |
11.5 |
2.5 |
29.0 |
0.9 |
0.0 |
0.0 |
|
L G MLD |
8.4 |
47.8 |
136.7 |
21.9 |
88.5 |
268.5 |
0.0 |
0.0 |
|
M S MLD |
22.9 |
113.5 |
117.9 |
7.8 |
80.0 |
129.9 |
0.0 |
0.0 |
|
TOTAL |
60.9 |
740.4 |
737.5 |
84.6 |
340.1 |
733.1 |
0.0 |
0.0 |
|
COTTON |
|
THOUSAND RUNNING BALES |
||||||
|
UPLAND |
227.8 |
5,761.9 |
7,070.7 |
194.1 |
2,699.1 |
2,205.4 |
21.3 |
520.2 |
|
PIMA |
29.6 |
254.6 |
117.2 |
7.4 |
123.2 |
92.3 |
0.0 |
0.7 |
This summary is based on reports from exporters for the period October 9-15, 2020.
Wheat: Net sales of 367,500 metric tons (MT) for 2020/2021 were down 31 percent from the previous week and 23 percent from the prior 4-week average. Increases primarily for Mexico (192,800 MT), Nigeria (60,600 MT), the Philippines (60,000 MT), Guatemala (38,700 MT, switched from unknown destinations), and Japan (34,600 MT, including decreases of 300 MT), were offset by reductions primarily for unknown destinations (95,500 MT). Exports of 192,100 MT were down 62 percent from the previous week and 67 percent from the prior 4-week average. The destinations were primarily to Indonesia (55,300 MT), Malaysia (40,800 MT), Japan (33,000 MT), Venezuela (25,100 MT), and Mexico (22,900 MT). Optional Origin Sales: For 2020/2021, the current outstanding balance of 10,000 MT, all Spain.
Corn: Net sales of 1,831,600 MT for 2020/2021 were up noticeably from the previous week and up 21 percent from the prior 4-week average. Increases primarily for Japan (490,100 MT, including 162,800 MT switched from unknown destinations and decreases of 10,000 MT), China (433,500 MT), Mexico (377,400 MT, including decreases of 35,400 MT), Taiwan (179,800 MT), and Israel (157,500 MT), were offset by reductions for unknown destinations (55,500 MT). Exports of 898,000 MT were up 10 percent from the previous week and 7 percent from the prior 4-week average. The destinations were primarily to China (364,000 MT), Mexico (168,300 MT), Japan (165,900 MT), Saudi Arabia (70,200 MT), and Colombia (55,000 MT). Optional Origin Sales: For 2020/2021, new optional origin sales of 30,000 MT were reported for Ukraine. The current outstanding balance of 834,800 MT is for Vietnam (260,000 MT), Taiwan (204,200 MT), Argentina (127,000 MT), Ukraine (125,000 MT), South Korea (65,000 MT), and unknown destinations (53,600 MT). Late Reporting: For 2020/2021, exports totaling 7,100 MT were reported late. The destination was Jamaica.
Barley: No net sales were reported for the week. Exports of 200 MT were to South Korea.
Rice: Net sales of 60,900 MT for 2020/2021 were up noticeably from the previous week, but down 45 percent from the prior 4-week average. Increases primarily for Colombia (21,900 MT), Japan (13,000 MT), Guatemala (10,000 MT), Jordan (4,000 MT), and Saudi Arabia (3,700 MT), were offset by reductions for New Zealand (800 MT). Exports of 84,600 MT–a marketing-year high–were up noticeably from the previous week and from the prior 4-week average. The destinations were primarily to Mexico (52,300 MT), Haiti (15,200 MT), Saudi Arabia (5,400 MT), Canada (4,900 MT), and South Korea (2,500 MT).
Soybeans: Net sales of 2,225,500 MT for 2020/2021 were down 14 percent from the previous week and 18 percent from the prior 4-week average. Increases primarily for China (1,222,000 MT, including 395,000 MT switched from unknown destinations and decreases of 6,600 MT), Egypt (194,400 MT, including 55,000 MT switched from China), unknown destinations (185,100 MT), Germany (111,300 MT), and Mexico (105,700 MT, including decreases of 2,400 MT), were offset by reductions primarily for the Netherlands (20,000 MT). Exports of 2,516,500 MT were up 8 percent from the previous week and 49 percent from the prior 4-week average. The destinations were primarily to China (1,960,200 MT, including 71,400 MT late – see below), Egypt (126,400 MT), Germany (111,300 MT), Mexico (59,700 MT), and Saudi Arabia (53,800 MT). Optional Origin Sales: For 2020/2021, the current outstanding balance of 126,000 MT, all China. Exports for Own Account: For 2020/2021, the current exports for own account outstanding balance is 7,300 MT, all Canada. Export Adjustments: Accumulated export of soybeans to the Netherland were adjusted down 56,666 MT for week ending October 1st and 54,630 MT for week ending October 8th. The correct destination for these shipments is Germany and is included in this week’s report. Late Reporting: For 2020/2021, exports totaling 71,400 MT were reported late. The destination was China.
Soybean Cake and Meal: Net sales of 321,900 MT for 2020/2021 primarily for Mexico (127,800 MT, including decreases of 500 MT), the Dominican Republic (36,700 MT, including decreases 200 MT), unknown destinations (32,000 MT), Colombia (31,300 MT), and China (20,000 MT), were offset by reductions for Belgium (600 MT), Nepal (500 MT), Nicaragua (300 MT), and South Korea (100 MT). Exports of 90,800 MT were primarily to Mexico (35,500 MT), Canada (18,700 MT), Morocco (7,700 MT), Jamaica (6,600 MT), and Costa Rica (5,700 MT).
Soybean Oil: Net sales of 37,000 MT for 2020/2021 were primarily for China (11,000 MT), the Dominican Republic (8,600 MT), Venezuela (8,000 MT), South Korea (4,000 MT), and Nicaragua (2,000 MT). For 2021/2022, total net sales reductions of 200 MT were for Canada. Exports of 3,100 MT were primarily to Mexico (1,600 MT) and Canada (1,500 MT).
Cotton: Net sales of 227,800 RB for 2020/2021 were up noticeably from the previous week and up 51 percent from the prior 4-week average. Increases primarily for Pakistan (93,300 RB, including 800 RB switched from Indonesia), China (47,500 RB, including decreases of 10,600 RB), Mexico (33,800 RB), Vietnam (30,100 RB, including 1,100 RB switched from China and decreases of 100 RB), and Bangladesh (9,000 RB), were offset by reductions primarily for Japan (1,000 RB) and Indonesia (800 RB). For 2021/2022, net sales of 21,300 RB were for China (17,200 RB) and Mexico (4,100 RB). Exports of 194,100 RB were up 1 percent from the previous week, but down 7 percent from the prior 4-week average. Exports were primarily to China (95,500 RB), Pakistan (29,100 RB), Vietnam (16,200 RB), Indonesia (12,600 RB), and Bangladesh (12,000 RB). Net sales of Pima totaling 29,600 RB–a marketing-year high–were up 66 percent from the previous week and 53 percent from the prior 4-week average. Increases were primarily for China (9,800 RB), India (5,700 RB, including decreases of 100 RB), Pakistan (3,900 RB), Bangladesh (3,800 RB), and Turkey (1,300 RB). Exports of 7,400 RB were down 41 percent from the previous week and 43 percent from the prior 4-week average. The destinations were primarily to India (3,400 RB), Peru (1,800 RB), China (1,100 RB), Bangladesh (600 RB), and Germany (200 RB). Exports for Own Account: For 2020/2021, new exports for own account totaling 7,400 RB were to China. Decreases were reported for China (300 RB). The current exports for own account outstanding balance of 20,100 RB is for China (15,200 RB), Indonesia (3,900 RB), and Bangladesh (1,000 RB).
Hides and Skins: Net sales of 480,700 pieces for 2020 were up 27 percent from the previous week and 30 percent from the prior 4-week average. Increases primarily for China (407,400 whole cattle hides, including decreases of 10,500 pieces), South Korea (51,000 whole cattle hides, including decreases of 1,600 pieces), Mexico (48,300 whole cattle hides, including decreases of 500 pieces), Cambodia (5,300 whole cattle hides), and Thailand (3,400 whole cattle hides), were offset by reductions for Taiwan (400 pieces) and Indonesia (200 pieces). Additionally, total net sales of 2,100 calf skins were reported for Italy. Net sales reductions of 40,100 kip skins were reported for Italy (39,900 kip skins) and Belgium (200 kip skins). Exports of 397,700 pieces reported for 2020 were down 11 percent from the previous week and 13 percent from the prior 4-week average. Whole cattle hides exports were primarily to China (314,300 pieces), South Korea (30,200 pieces), Mexico (30,000 pieces), Brazil (8,000 pieces), and Taiwan (3,500 pieces). In addition, exports of 2,600 kip skins were to Belgium.
Net sales of 173,100 wet blues for 2020 were up 61 percent from the previous week and 15 percent from the prior 4-week average. Increases were primarily for Vietnam (92,800 unsplit, including decreases of 200 unsplit), Italy (53,800 unsplit and 100 grain splits, including decreases of 200 unsplit), China (21,300 unsplit, including decreases of 200 unsplit), Mexico (3,300 unsplit, including decreases of 100 unsplit and grain splits), and India (1,200 unsplit). For 2021, total net sales of 4,000 wet blues unsplit were reported for Vietnam. Exports of 127,000 wet blues for 2020 were down 1 percent from the previous week and 25 percent from the prior 4-week average. The destinations were primarily to Italy (31,600 unsplit and 4,500 grain splits), China (34,400 unsplit), Vietnam (32,600 unsplit), Thailand (8,400 unsplit), and Taiwan (7,400 unsplit). Net sales of 1,353,800 splits were for Vietnam (1,302,000 pounds, including decreases of 12,200 pounds) and China (51,800 pounds). For 2021, total net sales of 167,500 splits were for China. Exports of 492,100 pounds were to Vietnam (449,600 pounds) and China (42,500 pounds).
Beef: Net sales of 21,700 MT reported for 2020 were up 62 percent from the previous week and 13 percent from the prior 4-week average. Increases primarily for South Korea (5,400 MT, including decreases of 400 MT), China (3,700 MT), Japan (3,600 MT, including decreases of 600 MT), Mexico (2,800 MT), and Hong Kong (2,600 MT, including decreases of 200 MT), were offset by reductions for Chile (100 MT). For 2021, net sales of 2,600 MT resulting in increases for Japan (1,400 MT) and South Korea (1,300 MT), were offset by reductions for Hong Kong (200 MT). Exports of 17,800 MT were up 10 percent from the previous week and 6 percent from the prior 4-week average. The destinations were primarily to Japan (4,500 MT), South Korea (4,200 MT), China (2,000 MT), Mexico (1,600 MT), and Hong Kong (1,500 MT).
Pork: Net sales of 26,800 MT reported for 2020 were unchanged from the previous week, but down 35 percent from the prior 4-week average. Increases primarily for Mexico (13,800 MT, including decreases of 800 MT), Japan (4,900 MT, including decreases of 200 MT), China (1,800 MT, including decreases of 1,500 MT), South Korea (1,500 MT, including decreases of 500 MT), and Colombia (1,000 MT), were offset by reductions for Vietnam (100 MT). For 2021, net sales of 800 MT were primarily for New Zealand (400 MT), Australia (300 MT), and Mexico (100 MT). Exports of 36,600 MT were up 2 percent from the previous week and 4 percent from the prior 4-week average. The destinations were primarily to China (12,500 MT), Mexico (11,100 MT), Japan (4,300 MT), Canada (2,500 MT), and South Korea (1,500 MT).
Terry Reilly
Senior Commodity Analyst – Grain and Oilseeds
Futures International
One Lincoln Center
18 W 140 Butterfield Rd.
Oakbrook Terrace, Il. 60181
W: 312.604.1366
ICE IM: treilly1
Skype: fi.treilly

Trading of futures, options, swaps and other derivatives is risky and is not suitable for all persons. All of these investment products are leveraged, and you can lose more than your initial deposit. Each investment product is offered only to and from jurisdictions where solicitation and sale are lawful, and in accordance with applicable laws and regulations in such jurisdiction. The information provided here should not be relied upon as a substitute for independent research before making your investment decisions. Futures International, LLC is merely providing this information for your general information and the information does not take into account any particular individual’s investment objectives, financial situation, or needs. All investors should obtain advice based on their unique situation before making any investment decision. The contents of this communication and any attachments are for informational purposes only and under no circumstances should they be construed as an offer to buy or sell, or a solicitation to buy or sell any future, option, swap or other derivative. The sources for the information and any opinions in this communication are believed to be reliable, but Futures International, LLC does not warrant or guarantee the accuracy of such information or opinions. Futures International, LLC and its principals and employees may take positions different from any positions described in this communication. Past results are not necessarily indicative of future results.