PDF attached
Macros
US Retail Sales (M/M) Sep 1.9% (est 0.7%; prev 0.6%)
-US Retail Sales Ex. Auto (M/M) Sep 1.5% (est 0.5%; prevR 0.5%; prev 0.7%)
-US Retail Sales Ex. Auto & Gas (M/M) Sep 1.5% (est 0.5%; prevR 0.5%; prev 0.7%)
-US Retail Sales Control Group (M/M) Sep 1.4% (est 0.2%; prevR -0.3%; prev -0.1%)
Canada Manufacturing Sales (M/M) Aug -2.0% (est -1.4%; prevR 7.2%; prev 7.0%)
USDA Export Sales
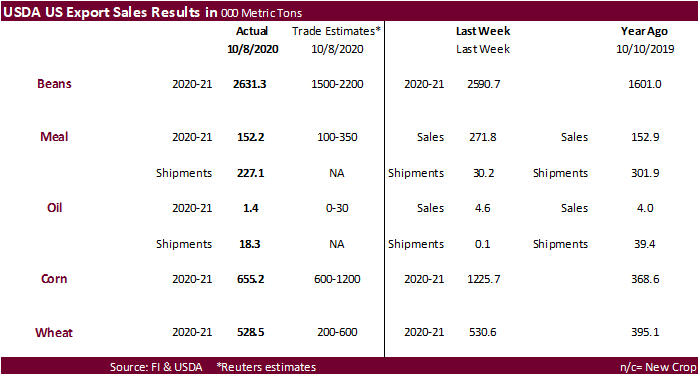
· USDA export sales for soybeans were an excellent 2.631 million tons, slightly above the previous week and included 1.6 million tons for China (including 529,000 MT switched from unknown destinations).
· Soybean meal sales dropped from the previous week to 152,200 tons but shipments were ok at 227,100 tons.
· Soybean oil export sales were poor at only 1,400 tons. Shipments were 18,300.
· USDA corn export sales were at the lower end of trade expectations at 652,200 tons. Mexico was the largest buyer. China was only 140,700 tons and included 65,000 tons switched from South Korea and decreases of 3,200 tons.
· All-wheat export sales were steady from the previous week at 528,500 tons. Mexico and Japan were the largest buyer. China was in there for a cargo but much of it was switched from unknown.
This summary is based on reports from exporters for the period October 2-8, 2020.
Wheat: Net sales of 528,500 metric tons (MT) for 2020/2021 were unchanged from the previous week, but up 23 percent from the prior 4-week average. Increases primarily for Mexico (229,000 MT, including decreases of 11,000 MT), Japan (62,200 MT), China (57,400 MT, including 50,000 MT switched from unknown destinations and decreases of 2,000 MT), Thailand (55,000 MT), and unknown destinations (47,500 MT), were offset by reductions for the Philippines (28,400 MT) and Brazil (1,700 MT). For 2021/2022, nets sales of 71,200 MT were for Brazil (60,000 MT) and Mexico (11,200 MT). Exports of 506,700 MT were down 28 percent from the previous week and 15 percent from the prior 4-week average. The destinations were primarily to China (182,400 MT), Nigeria (96,900 MT), Brazil (58,300 MT), the Philippines (54,300 MT), and Mexico (36,200 MT). Optional Origin Sales: For 2020/2021, new optional origin sales of 10,000 MT were reported for Spain. The current outstanding balance of 10,000 MT, all Spain. Late Reporting: For 2020/2021, exports totaling 9,900 MT were reported late. The destination was Colombia.
Corn: Net sales of 655,200 MT for 2020/2021 were down 47 percent from the previous week and 63 percent from the prior 4-week average. Increases primarily for Mexico (203,800 MT, including decreases of 1,200 MT), Colombia (184,200 MT, including 33,000 MT switched from unknown destinations and decreases of 5,800 MT), Japan (175,800 MT, including 70,900 MT switched from unknown destinations and decreases of 5,100 MT), China (140,700 MT, including 65,000 MT switched from South Korea and decreases of 3,200 MT), and Costa Rica (47,800 MT), were offset by reductions for unknown destinations (152,100 MT) and South Korea (7,700 MT). Exports of 815,100 MT were down 13 percent from the previous week and 5 percent from the prior 4-week average. The destinations were primarily to Mexico (306,500 MT), China (269,700 MT), South Korea (58,000 MT), Honduras (49,100 MT), and Colombia (43,200 MT). Optional Origin Sales: For 2020/2021, new optional origin sales of 65,000 MT were reported for Ukraine. The current outstanding balance of 804,800 MT is for Vietnam (260,000 MT), Taiwan (204,200 MT), Argentina (127,000 MT), Ukraine (95,000 MT), South Korea (65,000 MT), and unknown destinations (53,600 MT).
Barley: No net sales were reported for the week. Exports of 200 MT were to Taiwan.
Sorghum: No net sales were reported for the week. Exports of 600 MT were primarily to China.
Rice: Net sales of 10,000 MT for 2020/2021 were down 96 percent from the previous week and 92 percent from the prior 4-week average. Increases were primarily for Canada (3,800 MT, including decreases of 100 MT), Jordan (2,100 MT), Israel (2,000 MT), Mexico (1,100 MT), and Honduras (300 MT). Exports of 35,200 MT were up noticeably from the previous week and up 79 percent from the prior 4-week average. The destinations were primarily to Colombia (23,000 MT), Canada (3,700 MT), Jordan (2,900 MT), Taiwan (1,600 MT), and Mexico (1,500 MT). Export Adjustments: Accumulated export of medium brown rice to South Korea were adjusted down 1,000 MT for week ending June 25th. This shipment was reported in error.
Soybeans: Net sales of 2,631,300 MT for 2020/2021were down 74 percent from the previous week, but up 18 percent from the prior 4-week average. Increases primarily for China (1,592,500 MT, including 529,000 MT switched from unknown destinations, 1,500 MT switched from Taiwan, and decreases of 95,200 MT), Mexico (210,400 MT, including decreases of 3,700 MT), Germany (115,700 MT), Indonesia (110,800 MT, including 68,000 MT switched from unknown destinations), and Thailand (101,200 MT, including 65,000 MT switched from unknown destinations), were offset by reductions primarily for unknown destinations (37,700 MT). Exports of 2,384,000 MT were down 8 percent from the previous week, but up 21 percent from the prior 4-week average. The destinations were primarily to China (1,743,300 MT), Mexico (147,400 MT), Germany (115,700 MT), Indonesia (97,200 MT), and the Netherlands (54,600 MT). Optional Origin Sales: For 2020/2021, the current outstanding balance of 126,000 MT, all China.
Exports for Own Account: For 2020/2021, the current exports for own account outstanding balance is 7,300 MT, all Canada. Export Adjustments: Accumulated export of soybeans to the Netherland were adjusted down 57,537 MT for week ending September 3rd and 58,117 MT for week ending September 10th. The correct destination for these shipments is Germany and is included in this week’s report.
Soybean Cake and Meal: Net sales of 152,200 MT for 2020/2021, primarily for Ecuador (37,200 MT, including 30,000 MT switched from unknown destinations), Canada (32,300 MT, including decreases of 600 MT), Morocco (31,200 MT), Colombia (25,500 MT), and Venezuela (20,000 MT), were offset by reductions primarily for unknown destinations (34,600 MT). Exports of 227,100 MT were primarily to the Philippines (100,100 MT), Ecuador (32,200 MT), Morocco (26,200 MT), Canada (24,400 MT), and Mexico (23,400 MT).
Soybean Oil: Net sales of 1,400 MT for 2020/2021 primarily for Canada (1,800 MT) and Mexico (200 MT), were offset by reductions for the Dominican Republic (500 MT), Guatemala (100 MT), and South Korea (100 MT). For 2021/2022, total net sales of 200 MT were for Canada. Exports of 18,300 MT were primarily to Venezuela (5,700 MT), Colombia (4,800 MT), Jamaica (3,000 MT), Mexico (2,700 MT), and Canada (2,100 MT).
Cotton: Net sales of 98,900 RB for 2020/2021 were down 45 percent from the previous week and 61 percent from the prior 4-week average. Increases primarily for Pakistan (36,500 RB, including 500 RB switched from Indonesia), China (20,000 RB, including decreases of 13,200 RB), Guatemala (14,900 RB), Vietnam (13,800 RB), and Turkey (10,400 RB), were offset by reductions for Bangladesh (4,000 RB) and Japan (1,300 RB). For 2021/2022, total net sales of 13,200 RB were for China. Exports of 192,600 RB were up 35 percent from the previous week, but down 7 percent from the prior 4-week average. Exports were primarily to China (59,500 RB), Vietnam (51,200 RB), Mexico (20,400 RB), Pakistan (13,000 RB), and Turkey (9,700 RB). Net sales of Pima totaling 17,800 RB were down 18 percent from the previous week and 19 percent from the prior 4-week average. Increases were primarily for China (5,900 RB), Bangladesh (4,800 RB), India (4,200 RB, including decreases 1,800 RB), Switzerland (1,300 RB), and Pakistan (1,000 RB). Exports of 12,700 RB were down 20 percent from the previous week and 10 percent from the prior 4-week average. The primary destinations were China (8,200 RB), India (1,300 RB), Peru (700 RB), Vietnam (700 RB), and Honduras (700 RB). Exports for Own account: For 2020/2021, the current exports for own account outstanding balance of 13,000 RB is for China (8,100 RB), Indonesia (3,900 RB), and Bangladesh (1,000 RB).
Hides and Skins: Net sales of 379,800 pieces for 2020 were up 33 percent from the previous week, but down 1 percent from the prior 4-week average. Increases primarily for China (229,400 whole cattle hides, including decreases of 16,200 pieces), Mexico (55,500 whole cattle hides, including decreases of 400 pieces), South Korea (43,400 whole cattle hides, including decreases of 1,000 pieces), Hong Kong (6,400 whole cattle hides), and Thailand (2,300 whole cattle hides, including decreases of 100 pieces), were offset by reductions for Turkey (200 pieces), Canada (200 pieces), and Indonesia (200 pieces). Additionally, total net sales of 42,000 kip skins were reported for Italy. Exports of 447,900 pieces reported for 2020 were down 3 percent from the previous week, but unchanged from the prior 4-week average. Whole cattle hides exports were primarily to China (361,800 pieces), South Korea (40,200 pieces), Mexico (25,900 pieces), Hong Kong (6,400 pieces), and Thailand (5,000 pieces).
Net sales of 107,300 wet blues for 2020 were down 9 percent from the previous week and 17 percent from the prior 4-week average. Increases primarily for Italy (41,800 unsplit, including decreases of 200 unsplit), Thailand (28,200 unsplit, including decreases of 300 unsplit), Vietnam (10,100 unsplit and 4,000 grain splits, including decreases of 100 unsplit), China (11,900 unsplit), and Taiwan (5,100 unsplit), were offset by reductions for Mexico (100 unsplit). For 2021, total net sales of 57,000 wet blues unsplit were reported for Italy. Exports of 128,100 wet blues for 2020 were down 31 percent from the previous week and 25 percent from the prior 4-week average. The destinations were primarily to China (38,000 unsplit), Italy (28,400 unsplit and 6,000 grain splits), Vietnam (28,800 unsplit), Thailand (17,600 unsplit), and Mexico (4,400 unsplit and 2,300 grain splits). Net sales of 5,200 splits were for China (2,900 pounds, including decreases of 25,700 pounds) and China (2,300 pounds, including decreases of 2,000 pounds). Exports of 689,600 pounds were to Vietnam (560,100 pounds) and China (129,500 pounds).
Beef: Net sales of 13,400 MT reported for 2020 were down 35 percent from the previous week and 31 percent from the prior 4-week average. Increases were primarily for Japan (3,900 MT, including decreases of 200 MT), Mexico (3,100 MT), South Korea (2,200 MT, including decreases of 300 MT), Taiwan (1,000 MT, including decreases of 100 MT), and Canada (600 MT, including decreases of 100 MT). For 2021, net sales of 400 MT were reported for Japan (200 MT), Taiwan (100 MT), and Chile (100 MT). Exports of 16,200 MT were down 5 percent from the previous week and 1 percent from the prior 4-week average. The destinations were primarily to Japan (4,200 MT), South Korea (3,800 MT), Hong Kong (1,500 MT), China (1,500 MT), and Mexico (1,500 MT).
Pork: Net sales of 26,800 MT reported for 2020 were down 56 percent from the previous week and 43 percent from the prior 4-week average. Increases were primarily for Mexico (11,900 MT, including decreases of 800 MT), China (5,200 MT, including decreases of 1,400 MT), Japan (4,700 MT, including decreases of 300 MT), Canada (1,100 MT, including decreases of 400 MT), and Colombia (800 MT, including decreases of 100 MT). For 2021, net sales of 1,600 MT were primarily for Mexico (700 MT), Chile (600 MT), and Australia (300 MT). Exports of 36,000 MT were down 2 percent from the previous week, but up 8 percent from the prior 4-week average. The destinations were primarily to Mexico (11,700 MT), China (10,700 MT), Japan (4,600 MT), Canada (2,200 MT), and South Korea (1,800 MT).
U.S. EXPORT SALES FOR WEEK ENDING 10/8/2020
|
|
CURRENT MARKETING YEAR |
NEXT MARKETING YEAR |
||||||
|
COMMODITY |
NET SALES |
OUTSTANDING SALES |
WEEKLY EXPORTS |
ACCUMULATED EXPORTS |
NET SALES |
OUTSTANDING SALES |
||
|
CURRENT YEAR |
YEAR |
CURRENT YEAR |
YEAR |
|||||
|
|
THOUSAND METRIC TONS |
|||||||
|
WHEAT |
|
|
|
|
|
|
|
|
|
HRW |
243.0 |
1,533.4 |
1,296.9 |
222.0 |
4,096.7 |
3,896.0 |
11.2 |
22.0 |
|
SRW |
30.5 |
317.9 |
590.1 |
26.9 |
876.4 |
1,138.4 |
60.0 |
100.0 |
|
HRS |
85.7 |
1,530.0 |
1,302.0 |
223.1 |
2,825.8 |
2,472.2 |
0.0 |
5.0 |
|
WHITE |
169.0 |
1,450.0 |
1,011.1 |
34.7 |
1,876.9 |
1,618.2 |
0.0 |
0.0 |
|
DURUM |
0.3 |
220.6 |
184.5 |
0.0 |
321.6 |
312.4 |
0.0 |
0.0 |
|
TOTAL |
528.5 |
5,051.9 |
4,384.5 |
506.7 |
9,997.4 |
9,437.1 |
71.2 |
127.0 |
|
BARLEY |
0.0 |
33.2 |
39.5 |
0.2 |
8.9 |
18.0 |
0.0 |
0.0 |
|
CORN |
655.2 |
22,010.1 |
7,726.7 |
815.1 |
4,492.9 |
2,637.8 |
0.0 |
206.0 |
|
SORGHUM |
0.0 |
2,541.8 |
223.1 |
0.7 |
393.4 |
43.8 |
0.0 |
136.0 |
|
SOYBEANS |
2,631.3 |
34,217.2 |
13,004.1 |
2,384.0 |
9,018.0 |
4,848.4 |
0.0 |
60.0 |
|
SOY MEAL |
152.2 |
3,361.9 |
3,237.1 |
227.1 |
257.3 |
379.0 |
0.0 |
18.1 |
|
SOY OIL |
1.4 |
159.8 |
155.9 |
18.3 |
18.4 |
44.0 |
0.2 |
0.2 |
|
RICE |
|
|
|
|
|
|
|
|
|
L G RGH |
0.2 |
543.6 |
418.6 |
23.7 |
78.8 |
307.9 |
0.0 |
0.0 |
|
M S RGH |
0.0 |
26.5 |
18.8 |
0.0 |
2.4 |
12.0 |
0.0 |
0.0 |
|
L G BRN |
0.9 |
11.3 |
11.2 |
2.8 |
9.0 |
3.5 |
0.0 |
0.0 |
|
M&S BR |
0.1 |
23.0 |
0.5 |
1.1 |
26.4 |
0.8 |
0.0 |
0.0 |
|
L G MLD |
2.1 |
61.2 |
123.5 |
2.5 |
66.7 |
256.9 |
0.0 |
0.0 |
|
M S MLD |
6.7 |
98.4 |
106.9 |
5.0 |
72.1 |
125.7 |
0.0 |
0.0 |
|
TOTAL |
10.0 |
764.1 |
679.6 |
35.2 |
255.4 |
706.9 |
0.0 |
0.0 |
|
COTTON |
|
THOUSAND RUNNING BALES |
||||||
|
UPLAND |
98.9 |
5,728.2 |
7,078.8 |
192.6 |
2,505.0 |
2,056.8 |
13.2 |
498.9 |
|
PIMA |
17.8 |
232.4 |
121.3 |
12.7 |
115.8 |
81.3 |
0.0 |
0.7 |
Terry Reilly
Senior Commodity Analyst – Grain and Oilseeds
Futures International │190 S LaSalle St., Suite 410│Chicago, IL 60603
W: 312.604.1366
ICE IM: treilly1
Skype: fi.treilly

Trading of futures, options, swaps and other derivatives is risky and is not suitable for all persons. All of these investment products are leveraged, and you can lose more than your initial deposit. Each investment product is offered only to and from jurisdictions where solicitation and sale are lawful, and in accordance with applicable laws and regulations in such jurisdiction. The information provided here should not be relied upon as a substitute for independent research before making your investment decisions. Futures International, LLC is merely providing this information for your general information and the information does not take into account any particular individual’s investment objectives, financial situation, or needs. All investors should obtain advice based on their unique situation before making any investment decision. The contents of this communication and any attachments are for informational purposes only and under no circumstances should they be construed as an offer to buy or sell, or a solicitation to buy or sell any future, option, swap or other derivative. The sources for the information and any opinions in this communication are believed to be reliable, but Futures International, LLC does not warrant or guarantee the accuracy of such information or opinions. Futures International, LLC and its principals and employees may take positions different from any positions described in this communication. Past results are not necessarily indicative of future results.