PDF attached
USDA Export Sales
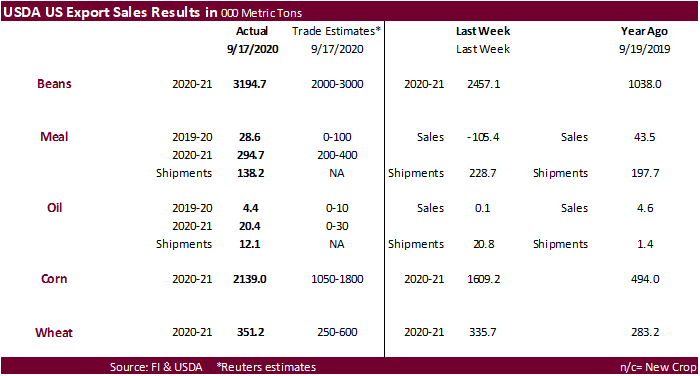
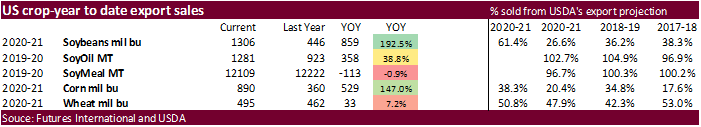
· Robust soybean sales of 3.195 million tons, above trade expectations, pull crop-year commitments to 1.306 billion bushels, 61.4 percent of USDA’s export projection and 193 percent above this time last year. China booted 1.879MMT, with 198k switched from unknown.
· Soybean meal and oil sales were withing expectations, but shipments could have been better.
· USDA corn exports sales topped expectations at 2.139 million tons. 566,400 tons were for China and 371,500 tons for unknown.
· All wheat export sales were 351,200 tons, withing expectations.
U.S. EXPORT SALES FOR WEEK ENDING 9/17/2020
|
|
CURRENT MARKETING YEAR |
NEXT MARKETING YEAR |
||||||
|
COMMODITY |
NET SALES |
OUTSTANDING SALES |
WEEKLY EXPORTS |
ACCUMULATED EXPORTS |
NET SALES |
OUTSTANDING SALES |
||
|
CURRENT YEAR |
YEAR |
CURRENT YEAR |
YEAR |
|||||
|
|
THOUSAND METRIC TONS |
|||||||
|
WHEAT |
|
|
|
|
|
|
|
|
|
HRW |
93.1 |
1,637.0 |
1,322.5 |
161.8 |
3,372.1 |
3,430.5 |
0.0 |
10.9 |
|
SRW |
6.8 |
419.2 |
644.6 |
65.8 |
705.5 |
954.2 |
0.0 |
1.3 |
|
HRS |
100.3 |
1,732.6 |
1,521.6 |
162.6 |
2,215.5 |
1,904.4 |
0.0 |
5.0 |
|
WHITE |
131.1 |
1,296.5 |
935.4 |
78.9 |
1,570.8 |
1,354.5 |
0.0 |
0.0 |
|
DURUM |
20.0 |
256.8 |
281.0 |
0.0 |
277.9 |
227.4 |
0.0 |
0.0 |
|
TOTAL |
351.2 |
5,342.1 |
4,705.1 |
469.1 |
8,141.8 |
7,871.0 |
0.0 |
17.2 |
|
BARLEY |
2.8 |
33.6 |
43.8 |
0.0 |
8.5 |
13.7 |
0.0 |
0.0 |
|
CORN |
2,139.0 |
20,602.2 |
8,000.4 |
845.2 |
1,992.9 |
1,148.5 |
0.0 |
206.0 |
|
SORGHUM |
194.4 |
2,587.0 |
103.3 |
71.6 |
176.9 |
32.2 |
0.0 |
0.0 |
|
SOYBEANS |
3,194.7 |
31,996.2 |
10,146.4 |
1,282.5 |
3,541.5 |
2,002.6 |
0.0 |
60.0 |
|
SOY MEAL |
28.6 |
642.4 |
1,054.6 |
138.2 |
11,466.2 |
11,167.0 |
294.7 |
2,362.6 |
|
SOY OIL |
4.4 |
93.4 |
134.1 |
12.1 |
1,188.0 |
789.2 |
20.4 |
122.4 |
|
RICE |
|
|
|
|
|
|
|
|
|
L G RGH |
38.2 |
267.6 |
399.2 |
1.2 |
53.0 |
205.3 |
0.0 |
0.0 |
|
M S RGH |
0.0 |
27.4 |
25.3 |
0.0 |
1.5 |
5.5 |
0.0 |
0.0 |
|
L G BRN |
7.0 |
14.4 |
9.9 |
0.7 |
4.8 |
2.7 |
0.0 |
0.0 |
|
M&S BR |
0.1 |
15.0 |
0.1 |
4.2 |
18.1 |
0.6 |
0.0 |
0.0 |
|
L G MLD |
4.9 |
59.2 |
169.9 |
18.8 |
57.0 |
199.0 |
0.0 |
0.0 |
|
M S MLD |
0.9 |
47.3 |
60.9 |
3.0 |
58.9 |
114.6 |
0.0 |
0.0 |
|
TOTAL |
51.0 |
431.0 |
665.2 |
27.8 |
193.4 |
527.6 |
0.0 |
0.0 |
|
COTTON |
|
THOUSAND RUNNING BALES |
||||||
|
UPLAND |
92.7 |
5,770.3 |
6,961.1 |
281.9 |
1,951.9 |
1,601.4 |
50.6 |
450.1 |
|
PIMA |
18.5 |
212.6 |
132.1 |
12.9 |
76.6 |
52.5 |
0.0 |
0.7 |
This summary is based on reports from exporters for the period September 11-17, 2020.
Wheat: Net sales of 351,200 metric tons (MT) for 2020/2021 were up 5 percent from the previous week, but down 34 percent from the prior 4-week average. Increases primarily for South Korea (111,900 MT), Vietnam (63,500 MT, including 60,000 MT switched from unknown destinations), Japan (57,100 MT, including decreases of 700 MT), the Philippines (41,000 MT), and Nigeria (30,000 MT), were offset by reductions primarily for unknown destinations (24,000 MT). Exports of 469,100 MT were down 17 percent from the previous week and 21 percent from the prior 4-week average. The destinations were primarily to Japan (95,700 MT), Brazil (63,100 MT), Mexico (58,700 MT), Thailand (58,600 MT), and China (58,400 MT).
Corn: Net sales of 2,139,000 MT for 2020/2021 were primarily for China (566,400 MT), unknown destinations (371,500 MT), Japan (344,900 MT, including decreases of 30,000 MT), Mexico (281,800 MT, including decreases of 1,400 MT and 54,000 MT late – see below), and Colombia (178,800 MT, including 50,000 MT switched from unknown destinations and decreases of 20,500 MT), were offset by reductions for Trinidad (400 MT) and Panama (300 MT). Exports of 845,200 MT were primarily to China (204,400 MT), Mexico (159,700 MT), Colombia (130,600 MT), Peru (84,400 MT), and South Korea (69,500 MT).
Optional Origin Sales: For 2020/2021, new optional origin sales of 92,000 MT were for Argentina (62,000 MT) and Ukraine (30,000 MT). The current outstanding balance of 686,200 MT is for Vietnam (260,000 MT), Taiwan (204,200 MT), South Korea (130,000 MT), Argentina (62,000 MT), and Ukraine (30,000 MT).
Late Reporting: For 2020/2021, net sales totaling 54,000 MT were reported late. These sales were reported for Mexico. For 2020/2021, exports totaling 24,500 MT were reported late. The destination was Panama.
Barley: Net sales of 2,800 MT for 2020/2021–a marketing-year high–were reported for Taiwan (1,000 MT), Japan (900 MT), and South Korea (900 MT). No exports were reported for 2020/2021.
Sorghum: Net sales of 194,400 MT for 2020/2021 resulting in increases primarily for China (262,400 MT, including 68,000 MT switched from unknown destinations), were offset by reductions for unknown destinations (68,000 MT). Exports of 71,600 MT were primarily to China.
Rice: Net sales of 51,000 MT for 2020/2021 were down 35 percent from the previous week, but up 4 percent and from the prior 4-week average. Increases primarily for Honduras (22,400 MT), Mexico (18,100 MT), Brazil (7,200 MT), Canada (1,500 MT), and Saudi Arabia (900 MT), were offset by reductions for Haiti (200 MT) and Israel (100 MT). Exports of 27,800 MT were up 17 percent from the previous week and 2 percent from the prior 4-week average. The destinations were to Haiti (15,100 MT), South Korea (4,100 MT), Canada (2,400 MT), Mexico (2,200 MT), and Jordan (1,400 MT).
Exports for Own Account: For 2019/2020, the current exports for own account outstanding balance is 100 MT, all Canada.
Soybeans: Net sales of 3,194,700 MT for 2020/2021 were primarily for China (1,879,100 MT, including 198,000 MT switched from unknown destinations and decreases of 6,100 MT), unknown destinations (770,500 MT), Thailand (115,500 MT), Indonesia (100,900 MT, including 68,000 MT switched from unknown destinations and decreases of 600 MT), and Mexico (68,400 MT, including decreases of 300 MT and 19,900 MT late – see below), were offset by reductions for Egypt (3,600 MT), Pakistan (1,400 MT), and Spain (700 MT). Exports of 1,282,500 MT were primarily to China (769,300 MT), Indonesia (89,800 MT), Pakistan (68,600 MT), the Netherlands (57,600 MT), and Italy (56,000 MT). Optional Origin Sales: For 2020/2021, new optional origin sales of 63,000 MT were for China. The current outstanding balance of 63,000 MT, all China. Exports for Own Account: For 2020/2021, the current exports for own account outstanding balance is 7,300 MT, all Canada. Late Reporting: For 2020/2021, net sales totaling 19,900 MT were reported late. These sales were reported for Mexico.
Soybean Cake and Meal: Net sales of 28,600 MT for 2020/2021 were down noticeably from the previous week, but up 30 percent from the prior 4-week average. Increases primarily for Mexico (10,900 MT), Nicaragua (10,500 MT, including 6,000 MT switched from El Salvador, 4,600 MT switched from Guatemala, and decreases of 100 MT), Canada (8,900 MT, including decreases of 4,900 MT), Jamaica (4,600 MT), and Indonesia (3,100 MT), were offset by reductions primarily for El Salvador (6,000 MT) and Guatemala (5,600 MT). For 2020/2021, net sales of 294,700 MT were primarily for unknown destinations (100,000 MT), the Dominican Republic (58,000 MT), Mexico (26,800 MT), Canada (24,700 MT), and the Philippines (22,500 MT). Exports of 138,200 MT were down 40 percent from the previous week and 31 percent from the prior 4-week average. The destinations were to the Philippines (55,600 MT), Mexico (28,000 MT), Canada (18,300 MT), Nicaragua (15,500 MT), and Panama (9,800 MT).
Soybean Oil: Net sales of 4,400 MT for 2020/2021 were up noticeably from the previous week and up 70 percent from the prior 4-week average. Increases were primarily for Canada (2,800 MT), the Dominican Republic (1,300 MT), Mexico (200 MT), and Belgium (100 MT). For 2020/2021, net sales of 20,400 MT were for South Korea (10,000 MT), the Dominican Republic (9,500 MT), and Mexico (900 MT). Exports of 12,100 MT were down 42 percent from the previous week and 43 percent from the prior 4-week average. The destinations were primarily to the Dominican Republic (10,000 MT), Canada (1,200 MT), Mexico (700 MT), and Belgium (100 MT).
Cotton: Net sales of 92,700 RB for 2020/2021 were down 82 percent from the previous week and 60 percent from the prior 4-week average. Increases primarily for Vietnam (53,500 RB, including 2,400 RB switched from Japan), China (39,500 RB), Indonesia (26,200 RB, including 3,800 RB switched from Japan), Hong Kong (13,200 RB), and Pakistan (8,900 RB), were offset by reductions primarily for Mexico (49,200 RB). For 2021/2022, total net sales of 50,600 RB were for Mexico. Exports of 281,900 RB were up 50 percent from the previous week and 16 percent from the prior 4-week average. Exports were primarily to China (117,700 RB), Vietnam (62,100 RB), Indonesia (22,400 RB), Turkey (15,300 RB), and Bangladesh (14,600 RB). Net sales of Pima totaling 18,500 RB were down 34 percent from the previous week and 2 percent from the prior 4-week average. Increases primarily for India (8,000 RB), China (5,700 RB), Pakistan (2,800 RB), Hong Kong (900 RB), and Bangladesh (400 RB), were offset by reductions for Brazil (100 RB). Exports of 12,900 RB were down 22 percent from the previous week, but up 4 percent from the prior 4-week average. The primary destinations were India (6,300 RB), Peru (1,400 RB), Pakistan (1,400 RB), El Salvador (1,100 RB), and Austria (1,000 RB). Exports for Own account: For 2020/2021, the current exports for own account outstanding balance of 13,600 RB is for China (8,700 RB), Indonesia (3,900 RB), and Bangladesh (1,000 RB).
Hides and Skins: Net sales of 535,200 pieces for 2020 were up 25 percent from the previous week and 40 percent from the prior 4-week average. Increases primarily for China (409,800 whole cattle hides, including decreases of 10,100 pieces), South Korea (82,700 whole cattle hides, including decreases of 900 pieces), Mexico (18,900 whole cattle hides, including decreases of 400 pieces), Taiwan (16,600 whole cattle hides), and Brazil (6,600 whole cattle hides, including decreases of 100 pieces), were offset by reductions for Canada (3,400 pieces), Thailand (300 pieces), Spain (100 pieces), and Vietnam (100 pieces). Additionally, net sales reductions of 400 kip skins were reported primarily for Belgium (300 kip skins). Exports of 462,400 pieces reported for 2020 were up 12 percent from the previous week and 13 percent from the prior 4-week average. Whole cattle hides exports were primarily to China (349,700 pieces), South Korea (42,400 pieces), Mexico (25,200 pieces), Thailand (8,700 pieces), and Taiwan (6,400 pieces). In addition, exports of 4,800 kip skins were primarily to Belgium (2,600 kip skins).
Net sales of 226,700 wet blues for 2020 were up noticeably from the previous week and from the prior 4-week average. Increases primarily for Vietnam (115,700 unsplit, including decreases of 1,000 unsplit), China (84,400 unsplit and 3,300 grain splits), Mexico (7,900 grain splits and 4,200 unsplit, including decreases of 100 grain splits), Brazil (9,000 unsplit), and South Korea (2,700 grain splits), were offset by reductions for Italy (2,500 unsplit) and Brazil (100 grain splits). For 2021, net sales of 21,900 wet blues were reported for Vietnam (16,000 unsplit) and Italy (5,900 unsplit). Exports of 188,900 wet blues for 2020 were up 34 percent from the previous week and 80 percent from the prior 4-week average. The destinations were primarily to Italy (40,600 unsplit and 13,900 grain splits), China (39,000 unsplit and 4,400 grain splits), Thailand (35,500 unsplit), Vietnam (27,500 unsplit), and Brazil (7,500 grain splits and 1,000 unsplit). Net sales reductions of 44,900 splits were reported for Vietnam (35,900 pounds) and China (9,000 pounds). For 2021, total net sales of 40,100 pounds were for Vietnam. Exports of 440,000 pounds were primarily to Vietnam (279,300 pounds).
Beef: Net sales of 18,000 MT reported for 2020 were up 26 percent from the previous week and 36 percent from the prior 4-week average. Increases were primarily for Japan (4,500 MT, including decreases of 500 MT), South Korea (4,500 MT, including decreases of 400 MT), China (3,400 MT), Taiwan (1,500 MT, including decreases of 200 MT), and Hong Kong (1,000 MT, including decreases of 400 MT). For 2021, net sales of 800 MT were primarily for Japan. Exports of 17,500 MT were up 24 percent from the previous week and 7 percent from the prior 4-week average. The destinations were primarily to South Korea (4,800 MT), Japan (4,600 MT), Taiwan (1,800 MT), Hong Kong (1,400 MT), and Mexico (1,400 MT).
Pork: Net sales of 37,800 MT reported for 2020 were down 25 percent from the previous week and 13 percent from the prior 4-week average. Increases were primarily for Mexico (15,000 MT, including decreases of 800 MT), China (8,200 MT, including decreases of 1,600 MT), Japan (4,100 MT, including decreases of 200 MT), South Korea (3,300 MT, including decreases of 500 MT), and Canada (2,300 MT, including decreases of 400 MT). For 2021, total net sales of 300 MT were for Australia. Exports of 35,800 MT were up 25 percent from the previous week and 12 percent from the prior 4-week average. The destinations were primarily to China (10,900 MT), Mexico (9,900 MT), Japan (5,100 MT), Canada (2,700 MT), and South Korea (1,600 MT).
September 24, 2020 1 FOREIGN AGRICULTURAL SERVICE/USDA
SUMMARY OF EXPORT TRANSACTIONS
REPORTED UNDER THE DAILY SALES REPORTING SYSTEM
FOR PERIOD ENDING SEPTEMBER 17, 2020
COMMODITY DESTINATION QUANITY (MT) MARKETING YEAR
CORN CHINA 560,000 MT 1/ 2020/2021
CORN UNKNOWN 240,000 MT 1/ 2020/2021
SOYBEANS CHINA 1,116,000 MT 1/ 2020/2021
SOYBEANS UNKNOWN 492,500 MT 1/ 2020/2021
SOYBEAN MEAL UNKNOWN 100,000 MT 1/ 2020/2021
Terry Reilly
Senior Commodity Analyst – Grain and Oilseeds
Futures International │190 S LaSalle St., Suite 410│Chicago, IL 60603
W: 312.604.1366
AIM: fi_treilly
ICE IM: treilly1
Skype: fi.treilly

Trading of futures, options, swaps and other derivatives is risky and is not suitable for all persons. All of these investment products are leveraged, and you can lose more than your initial deposit. Each investment product is offered only to and from jurisdictions where solicitation and sale are lawful, and in accordance with applicable laws and regulations in such jurisdiction. The information provided here should not be relied upon as a substitute for independent research before making your investment decisions. Futures International, LLC is merely providing this information for your general information and the information does not take into account any particular individual’s investment objectives, financial situation, or needs. All investors should obtain advice based on their unique situation before making any investment decision. The contents of this communication and any attachments are for informational purposes only and under no circumstances should they be construed as an offer to buy or sell, or a solicitation to buy or sell any future, option, swap or other derivative. The sources for the information and any opinions in this communication are believed to be reliable, but Futures International, LLC does not warrant or guarantee the accuracy of such information or opinions. Futures International, LLC and its principals and employees may take positions different from any positions described in this communication. Past results are not necessarily indicative of future results.