PDF attached
USDA export sales
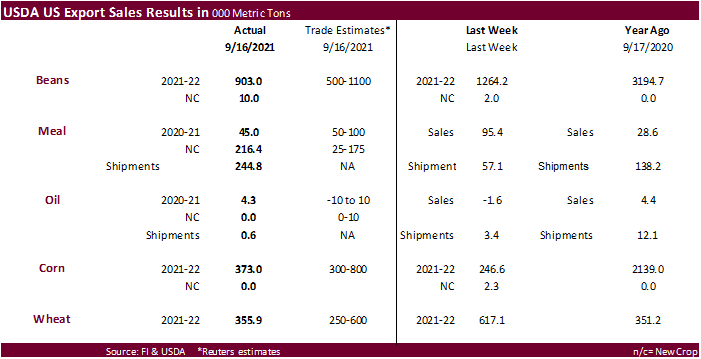
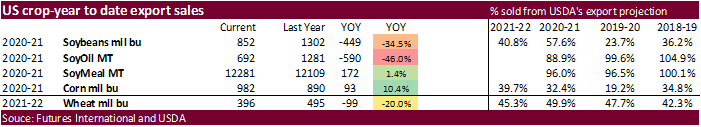
USDA soybean export sales of 903,000 tons were within expectations and included China (624,200 MT, including decreases of 132,000 MT), Mexico (85,300 MT, including 47,500 MT switched from unknown destinations and decreases of 1,300 MT), and Egypt (58,000 MT). Soybean commitment are running 34.5% below the same period a year ago. Soybean meal old crop sales were 45,000 tons but new-crop was good at 216,400 tons. On top of that shipments of meal were 244,800 tons, supportive. Soybean oil sales were only 4,300 tons and shipments 600 tons. Corn export sales were 373,000 tons, low for this time of year (2.139MMT were sold a year earlier). Corn commitment this season are running 10.4% above this time last year. All-wheat sales slowed to 355,900 tons from 617,100 tons previous week, but were within a range of expectations. Pork sales were 32,600 tons.
U.S. EXPORT SALES FOR WEEK ENDING 09/16/21
|
|
CURRENT MARKETING YEAR |
NEXT MARKETING YEAR |
||||||
|
COMMODITY |
NET SALES |
OUTSTANDING SALES |
WEEKLY EXPORTS |
ACCUMULATED EXPORTS |
NET SALES |
OUTSTANDING SALES |
||
|
CURRENT YEAR |
YEAR |
CURRENT YEAR |
YEAR |
|||||
|
|
THOUSAND METRIC TONS |
|||||||
|
WHEAT |
|
|
|
|
|
|
|
|
|
HRW |
34.7 |
1,572.5 |
1,637.0 |
204.8 |
2,537.6 |
3,372.1 |
0.0 |
0.0 |
|
SRW |
25.1 |
749.9 |
419.2 |
37.9 |
945.7 |
705.5 |
0.0 |
0.0 |
|
HRS |
124.5 |
980.9 |
1,732.6 |
138.0 |
1,945.1 |
2,215.5 |
0.0 |
0.0 |
|
WHITE |
115.4 |
575.5 |
1,296.5 |
109.1 |
1,350.7 |
1,570.8 |
0.0 |
0.0 |
|
DURUM |
56.2 |
65.5 |
256.8 |
18.1 |
61.4 |
277.9 |
0.0 |
0.0 |
|
TOTAL |
355.9 |
3,944.3 |
5,342.1 |
507.9 |
6,840.4 |
8,141.8 |
0.0 |
0.0 |
|
BARLEY |
0.0 |
20.5 |
33.6 |
0.0 |
4.7 |
8.5 |
0.0 |
0.0 |
|
CORN |
373.0 |
24,100.0 |
20,602.2 |
485.8 |
845.7 |
1,992.9 |
0.0 |
333.2 |
|
SORGHUM |
123.0 |
2,269.4 |
2,587.0 |
1.3 |
3.1 |
176.9 |
0.0 |
0.0 |
|
SOYBEANS |
902.9 |
22,659.7 |
31,996.2 |
274.4 |
532.7 |
3,425.9 |
10.0 |
12.0 |
|
SOY MEAL |
45.0 |
1,090.6 |
642.4 |
244.8 |
11,190.3 |
11,466.2 |
216.4 |
2,365.2 |
|
SOY OIL |
4.3 |
17.0 |
93.4 |
0.6 |
674.6 |
1,188.0 |
0.0 |
7.6 |
|
RICE |
|
|
|
|
|
|
|
|
|
L G RGH |
0.2 |
175.8 |
267.6 |
3.5 |
173.2 |
53.0 |
0.0 |
0.0 |
|
M S RGH |
0.0 |
8.0 |
27.4 |
0.1 |
1.2 |
1.5 |
0.0 |
0.0 |
|
L G BRN |
2.1 |
4.7 |
14.4 |
0.5 |
12.8 |
4.8 |
0.0 |
0.0 |
|
M&S BR |
20.1 |
42.4 |
15.0 |
0.1 |
13.8 |
18.1 |
0.0 |
0.0 |
|
L G MLD |
4.9 |
178.8 |
59.2 |
2.5 |
87.2 |
57.0 |
0.0 |
0.0 |
|
M S MLD |
1.5 |
30.3 |
47.3 |
13.2 |
60.6 |
58.9 |
0.0 |
0.0 |
|
TOTAL |
28.8 |
440.0 |
431.0 |
19.8 |
349.0 |
193.4 |
0.0 |
0.0 |
|
COTTON |
|
THOUSAND RUNNING BALES |
||||||
|
UPLAND |
345.4 |
5,300.8 |
5,770.3 |
176.8 |
1,351.6 |
1,951.9 |
0.0 |
686.8 |
|
PIMA |
23.5 |
155.3 |
212.6 |
3.8 |
42.9 |
76.6 |
0.0 |
0.0 |
This summary is based on reports from exporters for the period September 10-16, 2021.
Wheat: Net sales of 355,900 metric tons (MT) for 2021/2022 were down 42 percent from the previous week, but up 1 percent from the prior 4-week average. Increases primarily for the Philippines (126,600 MT, including decreases of 600 MT), Mexico (71,400 MT, including decreases of 400 MT), Japan (60,600 MT, including decreases of 500 MT), Nigeria (45,000 MT), and unknown destinations (36,000 MT), were offset by reductions for Canada (8,800 MT). Exports of 507,900 MT were down 1 percent from the previous week, but up 2 percent from the prior 4-week average. The destinations were primarily to Mexico (91,400 MT), the Philippines (86,600 MT), Japan (86,400 MT), China (67,800 MT), and South Korea (53,300 MT).
Late Reporting: For 2021/2022, net sales and exports totaling 16,000 MT of durum wheat were reported late for Italy.
Corn: Net sales of 373,000 MT for 2021/2022 primarily for Canada (135,800 MT, including decreases of 1,400 MT), Mexico (134,500 MT, including decreases of 64,800 MT), Japan (72,200 MT, including 1,400 MT switched from unknown destinations), unknown destinations (28,800 MT), and China (4,200 MT), were offset by reductions for Jamaica (4,700 MT). Exports of 485,800 MT were to Mexico (254,500 MT), China (140,200 MT), Japan (32,300 MT), Jamaica (19,900 MT), and Guatemala (17,100 MT).
Optional Origin Sales: For 2021/2022, the current outstanding balance of 170,000 MT is for unknown destinations
Barley: No net sales or exports were reported for the week.
Sorghum: Total net sales for 2021/2022 of 123,000 MT were for China. Exports of 1,300 MT were to Mexico.
Rice: Net sales of 28,800 MT for 2021/2022 were down 9 percent from the previous week and 41 percent from the prior 4-week average. Increases were primarily for South Korea (20,000 MT), Canada (4,700 MT), Saudi Arabia (1,600 MT), Costa Rica (1,200 MT), and Mexico (400 MT). Exports of 19,800 MT were down 76 percent from the previous week and 66 percent from the prior 4-week average. The destinations were primarily to Japan (12,000 MT), Mexico (4,500 MT), Canada (2,400 MT), Saudi Arabia (400 MT), and Jordan (200 MT).
Soybeans: Net sales of 902,900 MT for 2021/2022 primarily for China (624,200 MT, including decreases of 132,000 MT), Mexico (85,300 MT, including 47,500 MT switched from unknown destinations and decreases of 1,300 MT), Egypt (58,000 MT), Japan (43,700 MT, including 40,600 MT switched from unknown destinations and decreases of 1,000 MT), and the Netherlands (30,800 MT, including 28,000 MT switched from unknown destinations), were offset by reductions for unknown destinations (800 MT). Net sales for 2022/2023 of 10,000 MT resulting in increases for unknown destinations (12,000 MT), were offset by reductions for Indonesia (2,000 MT). Exports of 274,400 MT were primarily to Mexico (83,800 MT), Japan (73,300 MT), China (66,200 MT), the Netherlands (30,800 MT), and Malaysia (6,200 MT).
Export for Own Account: For 2021/2022, the current exports for own account outstanding balance is 5,800 MT, all Canada.
Soybean Cake and Meal: Net sales of 45,000 MT for 2020/2021 were down 53 percent from the previous week and 24 percent from the prior 4-week average. Increases primarily for Canada (12,900 MT, including decreases of 400 MT), the Philippines (10,800 MT), Guatemala (6,800 MT), Mexico (5,300 MT), and Malaysia (4,000 MT), were offset by reductions primarily for the Dominican Republic (2,900 MT) and Panama (1,000 MT). For 2021/2022, net sales of 216,400 MT were primarily for Mexico (47,400 MT), France (45,000 MT), Germany (45,000 MT), the Dominican Republic (38,000 MT), and unknown destinations (15,000 MT). Exports of 244,800 MT were up noticeably from the previous week and up 85 percent from the prior 4-week average. The destinations were primarily to the Philippines (69,400 MT), the Dominican Republic (58,100 MT), Mexico (34,500 MT), Canada (27,900 MT), and Guatemala (20,900 MT).
Soybean Oil: Net sales of 4,300 MT for 2020/2021 resulting in increases for Jamaica (4,000 MT) and Mexico (600 MT), were offset by reductions for Canada (300 MT). Exports of 600 MT were down 83 percent from the previous week and 72 percent from the prior 4-week average. The destination was primarily to Canada (300 MT).
Cotton: Net sales of 345,400 RB for 2021/2022 were up 21 percent from the previous week and 27 percent from the prior 4-week average. Increases were primarily for China (219,800 RB), Turkey (52,700 RB), Pakistan (36,200 RB), Vietnam (9,700 RB, including 3,700 RB switched from China, 500 RB switched from Japan, and decreases of 500 RB), and Peru (5,500 RB, including decreases of 100 RB). Exports of 176,800 RB were down 26 percent from the previous week and 7 percent from the prior 4-week average. The destinations were primarily to
Turkey (36,000 RB), China (32,700 RB), Vietnam (25,700 RB), Mexico (22,700 RB), and Pakistan (19,700 RB). Net sales of Pima totaling 23,500 RB were up noticeably from the previous week and up 86 percent from the prior 4-week average. Increases were primarily for India (16,000 RB), Peru (2,400 RB), Turkey (1,500 RB), China (1,300 RB), and Greece (900 RB). Exports of 3,800 RB were up 23 percent from the previous week, but down 45 percent from the prior 4-week average. The destinations were to India (2,800 RB), China (500 RB), Peru (300 RB), and Pakistan (200 RB).
Optional Origin Sales: For 2021/2022, the current outstanding balance of 8,800 RB is for Pakistan.
Exports for Own Account: For 2021/2022, the current exports for own account outstanding balance of 4,800 RB is for China (4,700 RB) and Vietnam (100 RB).
Hides and Skins: Net sales of 366,700 pieces for 2021 were up 32 percent from the previous week and 19 percent from the prior 4-week average. Increases primarily for China (214,700 whole cattle hides, including decreases of 62,400 pieces), South Korea (96,400 whole cattle hides, including deceases of 800 pieces), Brazil (16,900 whole cattle hides, including decreases of 100 pieces), Thailand (15,600 whole cattle hides, including decreases of 800 pieces), and Mexico (12,500 whole cattle hides, including decreases of 6,400 pieces), were offset by reductions for Turkey (100 pieces) and Japan (100 pieces). Exports of 342,000 pieces were down 19 percent from the previous week and 22 percent from the prior 4-week average. Whole cattle hides exports were primarily to China (243,800 pieces), South Korea (42,100 pieces), Mexico (16,100 pieces), Thailand (10,500 pieces), and Taiwan (9,900 pieces).
Net sales of 142,900 wet blues for 2021 were down 28 percent from the previous week, but up 8 percent from the prior 4-week average. Increases primarily for China (93,800 unsplit), Vietnam (43,600 unsplit, including decreases of 100 unsplit), and Mexico (11,900 grain splits, including decreases of 5,600 unsplit), were offset by reductions for Italy (500 unsplit) and Thailand (100 unsplit). Total net sales for 2022 of 5,000 wet blues were for Mexico. Exports of 145,400 wet blues were down 34 percent from the previous week and 6 percent from the prior 4-week average. The destinations were primarily to Italy (49,100 unsplit and 6,400 grain splits), Vietnam (31,300 unsplit), China (28,700 unsplit), Thailand (12,100 unsplit), and Mexico (6,100 grain splits and 1,700 unsplit). Net sales of 1,201,600 splits were reported for Vietnam (1,200,000 pounds) and Taiwan (1,600 pounds). Exports of 249,600 pounds were to Taiwan (169,600 pounds) and Vietnam (80,000 pounds).
Beef: Net sales of 15,800 MT for 2021 were up 3 percent from the previous week and 17 percent from the prior 4-week average. Increases were primarily for Japan (5,100 MT, including decreases of 1,000 MT), South Korea (3,200 MT, including decreases 400 MT), China (3,000 MT, including decreases of 100 MT), Taiwan (900 MT, including decreases of 100 MT), and Canada (800 MT, including decreases of 100 MT). Net sales of 1,600 MT for 2022 primarily for Mexico (1,100 MT), were offset by reductions for South Korea (100 MT). Exports of 18,200 MT were up 8 percent from the previous week and 1 percent from the prior 4-week average. The destinations were primarily to Japan (5,000 MT), South Korea (4,700 MT), China (3,500 MT), Taiwan (1,400 MT), and Mexico (1,200 MT).
Pork: Net sales of 32,600 MT for 2021 were up 29 percent from the previous week and 12 percent from the prior 4-week average. Increases were primarily for Mexico (16,300 MT, including decreases of 500 MT), Japan (6,800 MT, including decreases of 100 MT), Canada (2,000 MT, including decreases of 500 MT), South Korea (1,900 MT, including decreases of 800 MT), and Colombia (1,600 MT). Exports of 36,100 MT were up 40 percent from the previous week and 28 percent from the prior 4-week average. The destinations were primarily to Mexico (19,000 MT), Japan (4,800 MT), China (4,700 MT), Canada (1,900 MT), and South Korea (1,800 MT).
Terry Reilly
Senior Commodity Analyst – Grain and Oilseeds
Futures International
One Lincoln Center
18 W 140 Butterfield Rd.
Oakbrook Terrace, Il. 60181
W: 312.604.1366
ICE IM: treilly1
Skype: fi.treilly

Trading of futures, options, swaps and other derivatives is risky and is not suitable for all persons. All of these investment products are leveraged, and you can lose more than your initial deposit. Each investment product is offered only to and from jurisdictions where solicitation and sale are lawful, and in accordance with applicable laws and regulations in such jurisdiction. The information provided here should not be relied upon as a substitute for independent research before making your investment decisions. Futures International, LLC is merely providing this information for your general information and the information does not take into account any particular individual’s investment objectives, financial situation, or needs. All investors should obtain advice based on their unique situation before making any investment decision. The contents of this communication and any attachments are for informational purposes only and under no circumstances should they be construed as an offer to buy or sell, or a solicitation to buy or sell any future, option, swap or other derivative. The sources for the information and any opinions in this communication are believed to be reliable, but Futures International, LLC does not warrant or guarantee the accuracy of such information or opinions. Futures International, LLC and its principals and employees may take positions different from any positions described in this communication. Past results are not necessarily indicative of future results.