PDF attached
Good sales posted again for the major commodities, although soybeans, corn, and wheat are down from the previous week. Meal and oil shipments were ok.
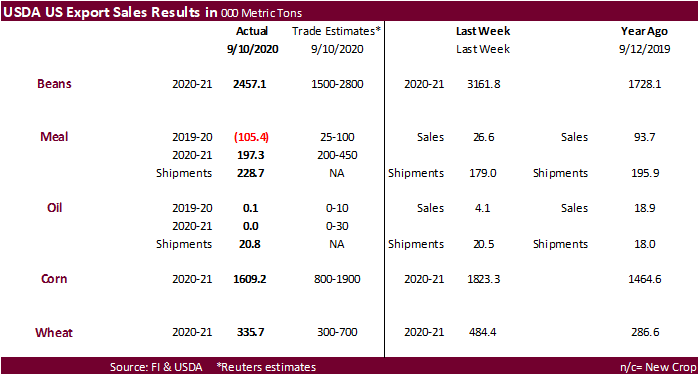
U.S. EXPORT SALES FOR WEEK ENDING 9/10/2020
|
|
CURRENT MARKETING YEAR |
NEXT MARKETING YEAR |
||||||
|
COMMODITY |
NET SALES |
OUTSTANDING SALES |
WEEKLY EXPORTS |
ACCUMULATED EXPORTS |
NET SALES |
OUTSTANDING SALES |
||
|
CURRENT YEAR |
YEAR |
CURRENT YEAR |
YEAR |
|||||
|
|
THOUSAND METRIC TONS |
|||||||
|
WHEAT |
|
|
|
|
|
|
|
|
|
HRW |
59.4 |
1,705.7 |
1,370.8 |
209.8 |
3,210.4 |
3,277.8 |
0.0 |
10.9 |
|
SRW |
32.3 |
478.3 |
627.4 |
71.6 |
639.7 |
923.3 |
0.3 |
1.3 |
|
HRS |
42.4 |
1,794.9 |
1,686.1 |
79.3 |
2,052.9 |
1,719.5 |
0.0 |
5.0 |
|
WHITE |
175.3 |
1,244.2 |
923.6 |
157.0 |
1,491.9 |
1,255.8 |
0.0 |
0.0 |
|
DURUM |
26.3 |
236.8 |
312.5 |
46.3 |
277.9 |
196.3 |
0.0 |
0.0 |
|
TOTAL |
335.7 |
5,459.9 |
4,920.3 |
564.0 |
7,672.8 |
7,372.6 |
0.3 |
17.2 |
|
BARLEY |
0.0 |
30.8 |
44.5 |
0.0 |
8.4 |
12.9 |
0.0 |
0.0 |
|
CORN |
1,609.2 |
19,308.4 |
7,785.4 |
902.0 |
1,147.7 |
869.5 |
0.0 |
206.0 |
|
SORGHUM |
121.5 |
2,464.2 |
37.7 |
72.4 |
105.4 |
31.8 |
0.0 |
0.0 |
|
SOYBEANS |
2,457.1 |
30,084.0 |
10,059.4 |
1,732.8 |
2,259.0 |
1,121.5 |
0.0 |
60.0 |
|
SOY MEAL |
-105.4 |
752.1 |
1,208.8 |
228.7 |
11,328.0 |
10,969.3 |
197.3 |
2,067.9 |
|
SOY OIL |
0.1 |
101.1 |
130.9 |
20.8 |
1,175.9 |
787.8 |
0.0 |
102.0 |
|
RICE |
|
|
|
|
|
|
|
|
|
L G RGH |
44.8 |
230.6 |
388.9 |
1.1 |
51.8 |
204.3 |
0.0 |
0.0 |
|
M S RGH |
0.0 |
27.4 |
26.5 |
0.0 |
1.5 |
4.3 |
0.0 |
0.0 |
|
L G BRN |
1.2 |
8.1 |
10.0 |
1.5 |
4.1 |
2.4 |
0.0 |
0.0 |
|
M&S BR |
0.1 |
19.1 |
0.1 |
0.1 |
13.9 |
0.5 |
0.0 |
0.0 |
|
L G MLD |
22.7 |
73.2 |
229.1 |
18.0 |
38.1 |
133.6 |
0.0 |
0.0 |
|
M S MLD |
10.0 |
49.4 |
68.3 |
3.2 |
56.0 |
85.3 |
0.0 |
0.0 |
|
TOTAL |
78.7 |
407.8 |
722.9 |
23.8 |
165.5 |
430.3 |
0.0 |
0.0 |
|
COTTON |
|
THOUSAND RUNNING BALES |
||||||
|
UPLAND |
519.6 |
5,959.6 |
6,981.8 |
187.9 |
1,669.9 |
1,425.4 |
0.0 |
399.5 |
|
PIMA |
28.0 |
207.0 |
124.8 |
16.5 |
63.6 |
49.4 |
0.0 |
0.7 |
This summary is based on reports from exporters for the period September 4-10, 2020.
Wheat: Net sales of 335,700 metric tons (MT) for 2020/2021 were down 31 percent from the previous week and 42 percent from the prior 4-week average. Increases primarily for Indonesia (91,400 MT, including decreases of 500 MT), Vietnam (63,000 MT, including 52,000 MT switched from unknown destinations), the Philippines (56,600 MT, including 52,000 MT switched from unknown destinations and decreases of 300 MT), Mexico (55,400 MT), and Italy (35,900 MT, including decreases of 500 MT), were offset by reductions for unknown destinations (64,500 MT) and Brazil (1,000 MT). For 2021/2022, total net sales of 300 MT were for Malaysia. Exports of 564,000 MT were down 22 percent from the previous week, but up 2 percent from the prior 4-week average. The destinations were primarily to Indonesia (89,200 MT), the Philippines (76,600 MT), Japan (67,100 MT, including 400 MT late – see below), China (66,300 MT), and Mexico (49,800 MT).
Export Adjustments: Accumulated exports of white wheat to Yemen were adjusted down 30,000 MT for week ending June 8th, 40,000 MT for week ending June 18th, 30,000 MT for week ending July 16th, and 51,190 MT for week ending August 20th. These exports were reported in error.
Late Reporting: For 2020/2021, net sales and exports totaling 400 MT were reported late. These sales and exports were reported for Japan.
Corn: Net sales of 1,609,200 MT for 2020/2021 were primarily for unknown destinations (360,200 MT), China (359,700 MT, including 140,000 MT switched from unknown destinations), Japan (329,900 MT, including 83,400 MT switched from unknown destinations and decreases of 1,800 MT), South Korea (201,700 MT), and Colombia (118,400 MT, including 30,000 MT switched from unknown destinations and decreases of 29,400 MT), were offset by reductions for El Salvador (17,400 MT) and Canada (4,700 MT). Exports of 902,000 MT were primarily to Mexico (213,000 MT), China (209,700 MT), South Korea (138,800 MT), Colombia (118,700 MT), and Japan (114,400 MT).
Optional Origin Sales: For 2020/2021, options were exercised to export 130,000 MT to South Korea from the United States. The current outstanding balance of 594,200 MT is for Vietnam (260,000 MT), Taiwan (204,200 MT), and South Korea (130,000 MT).
Barley: No net sales or exports for 2020/2021 were reported for the week.
Rice: Net sales of 78,700 MT for 2020/2021 were up noticeably from the previous week and from the prior 4-week average. Increases primarily for Brazil (30,000 MT), Haiti (15,200 MT, including decreases of 100 MT), Guatemala (9,100 MT), Canada (6,400 MT), and Mexico (6,400 MT), were offset by reductions for El Salvador (300 MT). Exports of 23,800 MT were up 99 percent from the previous week, but down 25 percent from the prior 4-week average. The destinations were to Haiti (15,200 MT), Canada (3,200 MT), Mexico (1,800 MT), Saudi Arabia (1,300 MT), and Jordan (700 MT).
Exports for Own Account: For 2020/2021, new exports for own account totaling 100 MT were to Canada. The current exports for own account outstanding balance is 100 MT, all Canada.
Soybeans: Net sales of 2,457,100 MT for 2020/2021 were primarily for China (1,487,100 MT, including 264,000 MT switched from unknown destinations and decreases of 13,900 MT), unknown destinations (499,300 MT), Japan (73,100 MT, including 63,000 MT switched from unknown destinations and decreases of 2,000 MT), Vietnam (66,800 MT, including 68,000 MT switched from unknown destinations and decreases of 6,100 MT), and the Netherlands (58,100 MT, including 60,000 MT switched from unknown destinations and decreases of 1,900 MT), were offset by reductions primarily for Spain (55,000 MT). Exports of 1,732,800 MT were primarily to China (1,089,400 MT), Egypt (113,100 MT), Mexico (104,200 MT), Japan (87,500 MT), and Vietnam (74,100 MT).
Exports for Own Account: For 2020/2021, the current exports for own account outstanding balance is 7,300 MT, all Canada.
Soybean Cake and Meal: Net sales reductions of 105,400 MT for 2019/2020–marketing-year low–were down noticeably from the previous week and from the prior 4-week average. Increases primarily for Mexico (8,100 MT, including decreases of 200 MT), Kuwait (5,000 MT), the Philippines (4,300 MT), Vietnam (3,800 MT, including decreases of 200 MT), and Indonesia (3,300 MT), were offset by reductions primarily for Canada (129,500 MT). For 2020/2021, net sales of 197,300 MT primarily for Canada (121,400 MT), Guatemala (30,200 MT), Mexico (24,000 MT), Colombia (22,000 MT), and Honduras (13,800 MT), were offset by reductions primarily for unknown destinations (32,400 MT). Exports of 228,700 MT were up 28 percent from the previous week and 15 percent from the prior 4-week average. The destinations were primarily to Mexico (50,700 MT), the Philippines (48,800 MT), Morocco (32,300 MT), Canada (21,700 MT), and Japan (18,900 MT).
Soybean Oil: Net sales of 100 MT for 2019/2020 resulting in increases primarily for Mexico (700 MT), were offset by reductions for Canada (700 MT). Exports of 20,800 MT were up 1 percent from the previous week and 26 percent from the prior 4-week average. The destinations were primarily to the Dominican Republic (18,000 MT), Canada (1,600 MT), and Mexico (1,100 MT).
Cotton: Net sales of 519,600 RB for 2020/2021 were up noticeably from the previous week and from the prior 4-week average. Increases primarily for China (440,100 RB, including 1,500 RB switched from Taiwan and decreases of 2,300 RB), Mexico (20,000 RB), Pakistan (17,600 RB), Vietnam (11,300 RB, including 1,300 RB switched from South Korea), and Turkey (7,800 RB), were offset by reductions for Japan (1,100 RB) and South Korea (500 RB). Exports of 187,900 RB were down 19 percent from the previous week and 38 percent from the prior 4-week average. Exports were primarily to China (95,800 RB), Vietnam (26,200 RB), Indonesia (15,300 RB), Mexico (11,600 RB), and Bangladesh (7,300 RB). Net sales of Pima totaling 28,000 RB were up 61 percent from the previous week and 75 percent from the prior 4-week average. Increases were primarily for China (12,600 RB), India (7,600 RB), Vietnam (5,800 RB, including 200 RB switched from Japan), Pakistan (700 RB), and Greece (500 RB), were offset by reductions for Japan (200 RB). Exports of 16,500 RB were up 54 percent from the previous week and 59 percent from the prior 4-week average. The primary destinations were Vietnam (6,700 RB), China (4,000 RB), Bangladesh (1,700 RB), India (1,300 RB), and Pakistan (1,000 RB).
Exports for Own account: For 2020/2021, exports for own account totaling 1,800 RB to Vietnam were applied to new or outstanding sales. The current exports for own account outstanding balance of 13,600 RB is for China (8,700 RB), Indonesia (3,900 RB), and Bangladesh (1,000 RB).
Hides and Skins: Net sales of 429,800 pieces for 2020 were up 27 percent from the previous week, but down 1 percent from the prior 4-week average. Increases primarily for China (364,500 whole cattle hides, including decreases of 6,900 pieces), South Korea (37,400 whole cattle hides, including decreases of 900 pieces), Mexico (16,900 whole cattle hides, including decreases of 600 pieces), Taiwan (7,800 whole cattle hides), and Vietnam (2,800 whole cattle hides), were offset by reductions for Belgium (22,400 pieces). Additionally, total net sales of 22,100 kip skins were for Belgium, including decreases of 300 kip skins. Exports of 413,800 pieces reported for 2020 were up 11 percent from the previous week, but down 3 percent from the prior 4-week average. Whole cattle hides exports were primarily to China (346,200 pieces), South Korea (32,300 pieces), Mexico (22,200 pieces), Vietnam (5,300 pieces), and Indonesia (1,700 pieces). In addition, exports of 3,600 kip skins were primarily to Belgium (2,500 kip skins).
Net sales of 19,400 wet blues for 2020 were down 87 percent from the previous week and 88 percent from the prior 4-week average. Increases primarily for Thailand (38,600 unsplit, including decreases of 400 unsplit), Taiwan (11,800 unsplit and 1,700 grain splits, including decreases of 200 unsplit), Italy (11,200 unsplit), Vietnam (10,800 grain splits, including decreases of 59,600 unsplit), and China (4,000 unsplit, including decreases of 20,000 unsplit), were offset by reductions for Mexico (100 grain splits). For 2021, net sales of 112,000 wet blues were reported for Vietnam (92,000 unsplit) and China (20,000 unsplit). Exports of 141,100 wet blues for 2020 were up noticeably from the previous week and up 50 percent from the prior 4-week average. The destinations were primarily to China (39,700 unsplit), Thailand (38,400 unsplit), Vietnam (29,700 unsplit), Italy (17,300 unsplit and 4,500 grain splits), and Taiwan (4,300 unsplit). Net sales of 204,800 splits were reported for China (125,600 pounds) and Vietnam (79,200 pounds). Exports of 599,400 pounds were to Vietnam.
Beef: Net sales of 14,300 MT reported for 2020 were down 8 percent from the previous week and 2 percent from the prior 4-week average. Increases were primarily for South Korea (4,400 MT, including decreases of 300 MT), Japan (4,000 MT, including decreases of 200 MT), China (1,800 MT), Mexico (1,400 MT), and Canada (900 MT, including decreases of 100 MT). For 2021, net sales of 500 MT were primarily for Japan. Exports of 14,100 MT were down 12 percent from the previous week and 19 percent from the prior 4-week average. The destinations were primarily to Japan (4,000 MT), South Korea (3,900 MT), Hong Kong (1,400 MT), Taiwan (1,200 MT), and Mexico (1,000 MT).
Pork: Net sales of 50,600 MT reported for 2020 were up 68 percent from the previous week and 41 percent from the prior 4-week average. Increases primarily for China (35,900 MT, including decreases of 200 MT), Mexico (5,900 MT, including decreases of 400 MT), Japan (3,200 MT, including decreases of 400 MT), Canada (1,500 MT, including decreases of 400 MT), and Australia (1,300MT, including decreases of 100 MT), were offset by reductions primarily for Nicaragua (100 MT). For 2021, total net sales of 100 MT were for Australia. Exports of 28,600 MT were down 15 percent from the previous week and 12 percent from the prior 4-week average. The destinations were primarily to Mexico (9,200 MT), China (8,300 MT), Japan (3,700 MT), Canada (1,900 MT), and South Korea (1,400 MT).
September 17, 2020 1 FOREIGN AGRICULTURAL SERVICE/USDA
SUMMARY OF EXPORT TRANSACTIONS
REPORTED UNDER THE DAILY SALES REPORTING SYSTEM
FOR PERIOD ENDING SEPTEMBER 10, 2020
COMMODITY DESTINATION QUANITY (MT) MARKETING YEAR
CORN JAPAN 106,000 MT 1/ 2020/2021
CORN UNKNOWN 101,600 MT 1/ 2020/2021
CORN CHINA 140,000 MT 2/ 2020/2021
SOYBEANS CHINA 831,000 MT 1/ 2020/2021
SOYBEANS UNKNOWN 672,000 MT 1/ 2020/2021
1/ Export sales. 2/ Changes in destination from unknown.
Terry Reilly
Senior Commodity Analyst – Grain and Oilseeds
Futures International │190 S LaSalle St., Suite 410│Chicago, IL 60603
W: 312.604.1366
AIM: fi_treilly
ICE IM: treilly1
Skype: fi.treilly

Trading of futures, options, swaps and other derivatives is risky and is not suitable for all persons. All of these investment products are leveraged, and you can lose more than your initial deposit. Each investment product is offered only to and from jurisdictions where solicitation and sale are lawful, and in accordance with applicable laws and regulations in such jurisdiction. The information provided here should not be relied upon as a substitute for independent research before making your investment decisions. Futures International, LLC is merely providing this information for your general information and the information does not take into account any particular individual’s investment objectives, financial situation, or needs. All investors should obtain advice based on their unique situation before making any investment decision. The contents of this communication and any attachments are for informational purposes only and under no circumstances should they be construed as an offer to buy or sell, or a solicitation to buy or sell any future, option, swap or other derivative. The sources for the information and any opinions in this communication are believed to be reliable, but Futures International, LLC does not warrant or guarantee the accuracy of such information or opinions. Futures International, LLC and its principals and employees may take positions different from any positions described in this communication. Past results are not necessarily indicative of future results.