PDF attached
USDA export Sales
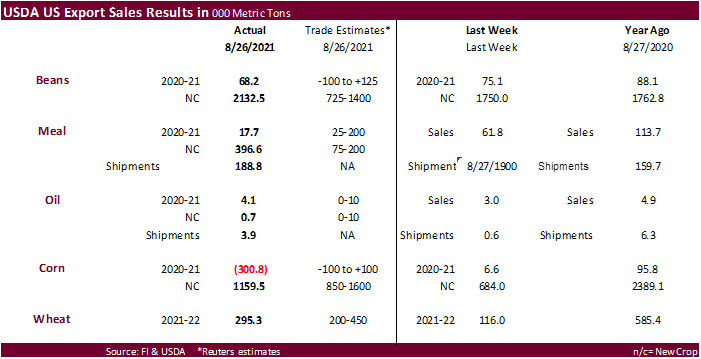
USDA export sales for new-crop soybeans were better than expected at 2.133 million tons that included 1.264 million tons for China, 654,000 tons for unknown and 88,700 tons for Mexico. Old crop sales were positive 68,200 tons. Soybean meal sales were very good for new-crop at 396,600 tons and shipment were 188,800 tons. New-crop meal sales included Colombia (104,000 MT),the Philippines (90,000 MT), unknown destinations (48,200 MT), and Romania(45,000 MT). SBO net sales were 4,100 tons old crop and 700 tons new. Corn sales of negative 300,800 tons are not uncommon for this late in the crop year for 2020-21. New-crop corn of 1.160 million tons were within expectations and included Mexico(464,500 MT), Colombia (352,000 MT), and Canada (292,600 MT). All-wheat sales rebounded from the marketing low reported last week to 295,300 tons. Pork sales were a large 33,500 tons.
U.S. EXPORT SALES FOR WEEK ENDING 8/26/21
|
|
CURRENT MARKETING YEAR |
NEXT MARKETING YEAR |
||||||
|
COMMODITY |
NET SALES |
OUTSTANDING SALES |
WEEKLY EXPORTS |
ACCUMULATED EXPORTS |
NET SALES |
OUTSTANDING SALES |
||
|
CURRENT YEAR |
YEAR |
CURRENT YEAR |
YEAR |
|||||
|
|
THOUSAND METRIC TONS |
|||||||
|
WHEAT |
|
|
|
|
|
|
|
|
|
HRW |
146.7 |
1,494.1 |
1,863.1 |
125.5 |
1,904.3 |
2,849.5 |
0.0 |
0.0 |
|
SRW |
12.7 |
738.2 |
626.8 |
116.1 |
873.9 |
461.8 |
0.0 |
0.0 |
|
HRS |
64.3 |
1,072.8 |
1,984.5 |
113.3 |
1,574.6 |
1,718.8 |
0.0 |
0.0 |
|
WHITE |
71.6 |
682.5 |
1,182.4 |
62.2 |
1,032.3 |
1,138.5 |
0.0 |
0.0 |
|
DURUM |
0.0 |
7.4 |
273.9 |
0.0 |
43.2 |
213.3 |
0.0 |
0.0 |
|
TOTAL |
295.3 |
3,995.0 |
5,930.7 |
417.1 |
5,428.3 |
6,381.8 |
0.0 |
0.0 |
|
BARLEY |
-0.1 |
21.4 |
30.8 |
0.0 |
3.9 |
8.4 |
0.0 |
0.0 |
|
CORN |
-300.8 |
3,321.4 |
1,965.3 |
529.3 |
66,701.9 |
42,622.2 |
1,159.5 |
20,442.2 |
|
SORGHUM |
2.4 |
226.1 |
107.9 |
72.4 |
6,910.9 |
4,529.2 |
0.0 |
1,594.9 |
|
SOYBEANS |
68.2 |
1,940.7 |
3,517.5 |
324.0 |
60,287.4 |
43,785.1 |
2,132.5 |
17,747.5 |
|
SOY MEAL |
17.7 |
1,235.7 |
1,238.6 |
188.8 |
10,844.2 |
10,920.3 |
396.6 |
2,058.1 |
|
SOY OIL |
4.1 |
20.3 |
138.3 |
3.9 |
670.3 |
1,134.6 |
0.7 |
1.4 |
|
RICE |
|
|
|
|
|
|
|
|
|
L G RGH |
15.0 |
221.2 |
169.3 |
3.7 |
90.6 |
50.6 |
0.0 |
0.0 |
|
M S RGH |
0.0 |
8.6 |
27.5 |
0.2 |
0.5 |
1.4 |
0.0 |
0.0 |
|
L G BRN |
0.2 |
1.4 |
8.1 |
0.6 |
11.5 |
2.6 |
0.0 |
0.0 |
|
M&S BR |
13.3 |
22.3 |
22.3 |
13.3 |
13.6 |
9.7 |
0.0 |
0.0 |
|
L G MLD |
19.8 |
168.6 |
69.3 |
18.6 |
71.5 |
16.4 |
0.0 |
0.0 |
|
M S MLD |
1.2 |
55.3 |
39.5 |
2.1 |
29.4 |
49.1 |
0.0 |
0.0 |
|
TOTAL |
49.5 |
477.5 |
336.0 |
38.6 |
217.2 |
129.8 |
0.0 |
0.0 |
|
COTTON |
|
THOUSAND RUNNING BALES |
||||||
|
UPLAND |
105.2 |
4,787.1 |
5,731.7 |
168.6 |
782.1 |
1,251.5 |
23.8 |
667.3 |
|
PIMA |
14.5 |
129.0 |
188.8 |
4.7 |
24.1 |
36.4 |
0.0 |
0.0 |
This summary is based on reports from exporters for the period August 20-26, 2021.
Wheat: Net sales of 295,300 metric tons (MT) for 2021/2022 were up noticeably from the previous week and up 15 percent from the prior 4-week average. Increases primarily for Mexico (103,900 MT, including decreases of 600 MT), Japan (92,400 MT, including decreases of 600 MT), Nigeria (70,000 MT, including 30,000 MT switched from unknown destinations), China (58,000 MT, including 60,000 MT switched from unknown destinations and decreases of 2,000 MT), and the Philippines (45,800 MT), were offset by reductions for unknown destinations (100,000 MT) and Brazil (50,000 MT). Exports of 417,100 MT were down 38 percent from the previous week and 27 percent from the prior 4-week average. The destinations were primarily to Mexico (146,900 MT), the Philippines (63,800 MT), China (58,500 MT), Thailand (33,500 MT), and Nigeria (32,000 MT).
Corn: Net sales reductions of 300,800 MT for 2020/2021–a marketing-year low–were greater than the previous week, but down noticeably from the prior 4-week average. Increases primarily for Mexico (33,000 MT, including decreases of 7,700 MT), Guatemala (27,100 MT, including 22,500 MT switched from El Salvador, 7,500 MT switched from Costa Rica, and decreases of 2,900 MT), Taiwan (8,800 MT), South Korea (1,900 MT), and Colombia (1,400 MT, including decreases of 26,000 MT), were more than offset by reductions primarily for Canada (209,800 MT) and China (133,200 MT). For 2021/2022, net sales of 1,159,500 MT primarily for Mexico (464,500 MT), Colombia (352,000 MT), Canada (292,600 MT), Japan (40,000 MT), and Taiwan (7,400 MT), were offset by reductions for unknown destinations (1,900 MT). Exports of 529,300 MT were down 30 percent from the previous week and 48 percent from the prior 4-week average. The destinations were primarily to Mexico (258,700 MT), China (138,700 MT), Guatemala (34,600 MT), Colombia (30,400 MT), and Costa Rica (29,600 MT).
Optional Origin Sales: For 2020/2021, the current outstanding balance of 30,500 MT is for unknown destinations. For 2021/2022, the current outstanding balance of 110,000 MT is for unknown destinations.
Barley: Total net sales reductions for 2021/2022 of 100 MT were for Canada. There were no exports reported for the week.
Sorghum: Total net sales of 2,400 MT for 2020/2021 were down 96 percent from the previous week and down noticeably from the prior 4-week average. The destination for China. Exports of 72,400 MT were down 43 percent from the previous week and 4 percent from the prior 4-week average. The destination was to China.
Rice: Net sales of 49,500 MT for 2021/2022 were primarily for Haiti (15,200 MT, including decreases of 100 MT), Honduras (15,000 MT), Japan (12,500 MT), Canada (2,500 MT), and Saudi Arabia (1,400 MT). Exports of 38,600 MT were primarily to Haiti (15,200 MT), Japan (12,500 MT), Mexico (4,800 MT), Canada (2,200 MT), and Saudi Arabia (1,900 MT).
Exports for Own Account: For 2021/2022, exports for own account totaling 100 MT to Canada were applied to new or outstanding sales.
Soybeans: Net sales of 68,200 MT for 2020/2021 were down 9 percent from the previous week, but up 9 percent from the prior 4-week average. Increases primarily for the Netherlands (86,200 MT, including 84,000 MT switched from unknown destinations and decreases of 3,800 MT), China (26,200 MT), Taiwan (17,200 MT), Indonesia (7,400 MT, including decreases of 100 MT), and Malaysia (5,800 MT, including decreases of 100 MT), were offset by reductions for unknown destinations (84,000 MT). For 2021/2022, net sales of 2,132,500 MT were primarily for China (1,264,000 MT), unknown destinations (654,000 MT), Mexico (88,700 MT), Egypt (50,000 MT), and Taiwan (32,000 MT). Exports of 324,000 MT were up 25 percent from the previous week and 50 percent from the prior 4-week average. The destinations were primarily to Mexico (111,000 MT), the Netherlands (86,200 MT), China (71,600 MT), Costa Rica (16,800 MT), and Indonesia (9,800 MT).
Exports for Own Account: For 2020/2021, the current exports for own account outstanding balance is 5,800 MT, all Canada.
Soybean Cake and Meal: Net sales of 17,700 MT for 2020/2021–a marketing-year low–were down 71 percent from the previous week and 82 percent from the prior 4-week average. Increases primarily for Mexico (19,600 MT), Canada (9,300 MT, including decreases of 700 MT), Taiwan (7,400 MT, including decreases of 100 MT), Guatemala (6,700 MT, including 6,100 MT switched from El Salvador), and Vietnam (5,600 MT), were offset by reductions primarily for Romania (45,000 MT). For 2021/2022, net sales of 396,600 MT were primarily for Colombia (104,000 MT), the Philippines (90,000 MT), unknown destinations (48,200 MT), Romania (45,000 MT), and Ecuador (30,000 MT). Exports of 188,800 MT were down 21 percent from the previous week and 15 percent from the prior 4-week average. The destinations were primarily to Vietnam (50,000 MT), Ecuador (32,500 MT), Canada (21,800 MT), Colombia (19,000 MT), and Mexico (18,300 MT).
Soybean Oil: Net sales of 4,100 MT for 2020/2021 were up 39 percent from the previous week and up noticeably from the prior 4-week average. Increases reported for Venezuela (3,000 MT), Honduras (1,000 MT), and Canada (100 MT). Total net sales for 2021/2022 of 700 MT were for Canada. Exports of 3,900 MT were up noticeably from the previous week and from the prior 4-week average. The destinations were to Jamaica (3,500 MT), Canada (300 MT), and Mexico (100 MT).
Cotton: Net sales of 105,200 RB for 2021/2022 were primarily for Pakistan (27,600 RB), Vietnam (17,200 RB, including decreases of 8,800 RB), Turkey (14,400 RB), Ecuador (8,800 RB), and China (8,400 RB). Total net sales for 2022/2023 of 23,800 RB were for Turkey. Exports of 168,600 RB were primarily to Turkey (33,400 RB), China (33,000 RB), Vietnam (25,000 RB), Pakistan (18,900 RB), and Bangladesh (17,400 RB). Net sales of Pima totaling 14,500 RB were primarily for Peru (6,300 RB), India (6,200 RB), Austria (500 RB), Taiwan (400 RB), and Egypt (400 RB). Exports of 4,700 RB were primarily to India (2,200 RB), China (1,200 RB), Honduras (800 RB), Peru (300 RB), and Guatemala (100 RB).
Optional Origin Sales: For 2021/2022, the current outstanding balance of 8,800 RB is for Pakistan.
Exports for Own Account: For 2021/2022, the current exports for own account outstanding balance of 4,800 RB is for China (4,700 RB) and Vietnam (100 RB).
Hides and Skins: Net sales of 324,500 pieces for 2021 were up 41 percent from the previous week and 28 percent from the prior 4-week average. Increases primarily for China (211,700 whole cattle hides, including decreases of 7,200 pieces), South Korea (34,400 whole cattle hides, including of 1,600 pieces), Mexico (32,200 whole cattle hides, including decreases of 200 pieces), Brazil (19,500 whole cattle hides), and Thailand (16,900 whole cattle hides, including decreases of 500 pieces), were offset by reductions for Indonesia (100 pieces). Exports of 425,700 pieces were down 22 percent from the previous week, but up 3 percent from the prior 4-week average. Whole cattle hides exports were primarily to China (295,300 pieces), South Korea (70,000 pieces), Thailand (14,800 pieces), Mexico (10,600 pieces), and Indonesia (10,200 pieces).
Net sales of 206,400 wet blues for 2021 were up 70 percent from the previous week and 97 percent from the prior 4-week average. Increases were primarily for Italy (107,500 unsplit, 19,100 grain splits, including decreases of 200 unsplit and 100 grain splits), China (23,300 unsplit, including decreases of 100 unsplit), Thailand (23,000 unsplit), Vietnam (16,300 unsplit), and Mexico (10,200 grain splits). Exports of 126,600 wet blues were down 40 percent from the previous week and 14 percent from the prior 4-week average. The destinations were to China (34,500 unsplit and 4,700 grain splits), Italy (37,300 unsplit and 1,900 grain splits), Vietnam (22,100 unsplit), Taiwan (10,400 unsplit), and Thailand (8,900 unsplit). Net sales of 251,600 splits were reported primarily for Taiwan (210,700 pounds). Exports of 490,700 pounds were primarily to Taiwan (168,700 pounds) and China (161,900 pounds).
Beef: Net sales of 15,600 MT reported for 2021 were up 49 percent from the previous week and 24 percent from the prior 4-week average. Increases were primarily for South Korea (7,300 MT, including decreases 500 MT), Taiwan (3,100 MT, including decreases of 100 MT), Japan (2,800 MT, including decreases of 500 MT), China (600 MT, including decreases of 800 MT), and Mexico (500 MT, including decreases of 100 MT). Exports of 18,100 MT were down 3 percent from the previous week and 6 percent from the prior 4-week average. The destinations were primarily to South Korea (5,200 MT), Japan (4,600 MT), China (3,900 MT), Mexico (1,200 MT), and Taiwan (1,200 MT).
Pork: Net sales of 33,500 MT reported for 2021 were up 39 percent from the previous week and 38 percent from the prior 4-week average. Increases primarily for Mexico (21,200 MT, including decreases of 600 MT), Colombia (4,200 MT, including decreases of 300 MT), Japan (3,000 MT, including decreases of 100 MT), China (2,000 MT, including decreases of 400 MT), and Canada (1,000 MT, including decreases of 400 MT), were offset by reductions for Vietnam (100 MT). Exports of 28,200 MT were down 6 percent from the previous week and 2 percent from the prior 4-week average. The destinations were primarily to Mexico (13,200 MT), China (4,700 MT), Japan (3,900 MT), South Korea (1,500 MT), and Canada (1,200 MT).
September 2, 2021 1 FOREIGN AGRICULTURAL SERVICE/USDA
Terry Reilly
Senior Commodity Analyst – Grain and Oilseeds
Futures International
One Lincoln Center
18 W 140 Butterfield Rd.
Oakbrook Terrace, Il. 60181
W: 312.604.1366
ICE IM: treilly1
Skype: fi.treilly

Trading of futures, options, swaps and other derivatives is risky and is not suitable for all persons. All of these investment products are leveraged, and you can lose more than your initial deposit. Each investment product is offered only to and from jurisdictions where solicitation and sale are lawful, and in accordance with applicable laws and regulations in such jurisdiction. The information provided here should not be relied upon as a substitute for independent research before making your investment decisions. Futures International, LLC is merely providing this information for your general information and the information does not take into account any particular individual’s investment objectives, financial situation, or needs. All investors should obtain advice based on their unique situation before making any investment decision. The contents of this communication and any attachments are for informational purposes only and under no circumstances should they be construed as an offer to buy or sell, or a solicitation to buy or sell any future, option, swap or other derivative. The sources for the information and any opinions in this communication are believed to be reliable, but Futures International, LLC does not warrant or guarantee the accuracy of such information or opinions. Futures International, LLC and its principals and employees may take positions different from any positions described in this communication. Past results are not necessarily indicative of future results.