PDF attached
USDA export sales
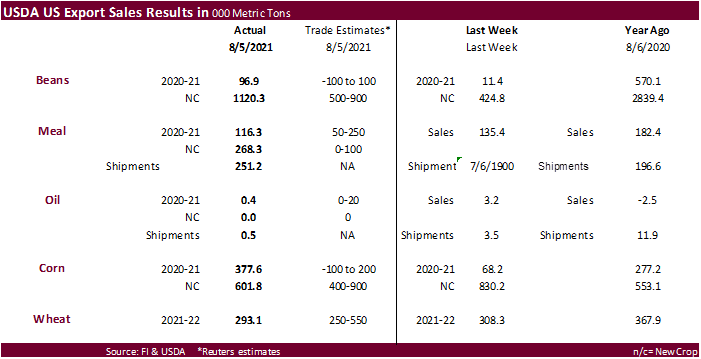
US soybean export sales were good for soybean meal, new-crop soybeans, and old-crop corn. Old-crop corn sales included late reporting net sales totaling 222,300 tons, including China for 71,500 tons. New-crop corn sales were 601,800 tons, within expectations. Soybean old-crop sales were 96,900 tons included China for 84,500 tons. New-crop soybean sales of 1.120 million tons (MT) included unknown destinations (643,400 MT, including 6,800MT – late) and China (328,000 MT). Soybean meal sales were good with 116,300 tons old crop and 268,200 tons new-crop. Meal shipments were 251,200 tons. Soybean oil sales were minimal. All-wheat sales of 293,100 tons were within trade expectations but below a 4-week average.
U.S. EXPORT SALES FOR WEEK ENDING 8/5/21
FAX 202-690-3275
|
|
CURRENT MARKETING YEAR |
NEXT MARKETING YEAR |
||||||
|
COMMODITY |
NET SALES |
OUTSTANDING SALES |
WEEKLY EXPORTS |
ACCUMULATED EXPORTS |
NET SALES |
OUTSTANDING SALES |
||
|
CURRENT YEAR |
YEAR |
CURRENT YEAR |
YEAR |
|||||
|
WHEAT |
THOUSAND METRIC TONS |
|||||||
|
HRW |
173.8 |
1,625.1 |
1,558.3 |
285.0 |
1,403.4 |
2,263.0 |
0.0 |
0.0 |
|
SRW |
21.1 |
1,003.8 |
678.3 |
71.5 |
549.4 |
351.0 |
0.0 |
0.0 |
|
HRS |
97.1 |
1,442.9 |
1,853.0 |
91.9 |
1,057.8 |
1,325.0 |
0.0 |
0.0 |
|
WHITE |
0.6 |
881.4 |
1,318.2 |
179.1 |
690.9 |
748.0 |
0.0 |
0.0 |
|
DURUM |
0.5 |
8.4 |
187.0 |
0.5 |
42.2 |
209.3 |
0.0 |
0.0 |
|
TOTAL |
293.1 |
4,961.6 |
5,594.9 |
627.9 |
3,743.7 |
4,896.3 |
0.0 |
0.0 |
|
BARLEY |
0.0 |
22.7 |
31.4 |
0.0 |
2.3 |
7.8 |
0.0 |
0.0 |
|
CORN |
377.6 |
5,518.2 |
4,137.9 |
1,060.0 |
64,582.9 |
40,021.9 |
601.8 |
18,088.7 |
|
SORGHUM |
6.6 |
527.5 |
342.2 |
72.3 |
6,662.1 |
4,291.5 |
0.0 |
1,594.9 |
|
SOYBEANS |
96.9 |
2,571.7 |
6,445.9 |
129.7 |
59,445.4 |
40,996.9 |
1,120.3 |
11,722.8 |
|
SOY MEAL |
116.3 |
1,726.7 |
1,652.0 |
251.2 |
10,201.8 |
10,305.5 |
268.3 |
1,417.4 |
|
SOY OIL |
0.3 |
17.4 |
177.7 |
0.5 |
665.5 |
1,089.2 |
0.0 |
0.6 |
|
RICE |
|
|
|
|
|
|
|
|
|
L G RGH |
25.4 |
203.8 |
164.8 |
0.0 |
0.0 |
4.4 |
0.0 |
0.0 |
|
M S RGH |
0.0 |
9.2 |
28.2 |
0.0 |
0.0 |
0.7 |
0.0 |
0.0 |
|
L G BRN |
0.1 |
11.9 |
8.9 |
0.3 |
0.3 |
0.7 |
0.0 |
0.0 |
|
M&S BR |
0.1 |
0.2 |
30.9 |
0.0 |
0.0 |
0.9 |
0.0 |
0.0 |
|
L G MLD |
38.7 |
215.4 |
38.7 |
1.5 |
1.5 |
3.4 |
0.0 |
0.0 |
|
M S MLD |
2.8 |
77.4 |
65.9 |
2.8 |
2.8 |
4.5 |
2.1 |
2.1 |
|
TOTAL |
67.1 |
517.8 |
337.2 |
4.6 |
4.6 |
14.7 |
2.1 |
2.1 |
|
COTTON |
|
THOUSAND RUNNING BALES |
|
|||||
|
UPLAND |
342.7 |
4,785.8 |
6,288.5 |
190.6 |
190.6 |
278.6 |
15.3 |
516.1 |
|
PIMA |
10.2 |
106.0 |
172.9 |
7.7 |
7.7 |
5.6 |
0.0 |
0.0 |
|
FINAL 2020/21 MARKETING YEAR |
||||
|
COMMODITY |
NET SALES |
CARRYOVER SALES 1/ |
7/31/21 EXPORTS |
ACCUMULATED EXPORTS |
|
PIMA |
0.0 |
88.8 |
3.1 |
754.9 |
|
COTTON |
|
|
|
|
|
UPLAND |
-13.4 |
1,310.9 |
49.1 |
14,882.1 |
|
RICE |
|
|
|
|
|
L G RGH |
0.4 |
128.1 |
37.2 |
1,679.9 |
|
M S RGH |
0.0 |
2.2 |
0.1 |
30.6 |
|
L G BRN |
0.0 |
11.3 |
0.0 |
40.5 |
|
M&S BR |
0.1 |
0.1 |
0.1 |
157.1 |
|
L G MLD |
0.3 |
30.8 |
0.7 |
654.5 |
|
M S MLD |
1.6 |
64.7 |
1.8 |
633.4 |
|
TOTAL |
2.5 |
237.2 |
39.8 |
3,195.9 |
This summary is based on reports from exporters for the period July 30-August 5, 2021.
Wheat: Net sales of 293,100 metric tons (MT) for 2021/2022 were down 5 percent from the previous week and 32 percent from the prior 4-week average. Increases primarily for unknown destinations (98,600 MT, including 82,600 MT – late), Japan (34,300 MT, including decreases of 700 MT and 500 MT – late), Nigeria (31,800 MT), Venezuela (27,100 MT – late), and Chile (21,500 MT), were offset by reductions primarily for the Dominican Republic (17,400 MT) and Guatemala (5,000 MT). Exports of 627,900 MT–a marketing-year high–were up 62 percent from the previous week and 60 percent from the prior 4-week average. The destinations were primarily to Japan (130,400 MT, including 500 MT – late), Mexico (89,600 MT), Nigeria (82,300 MT), China (64,700 MT), and South Korea (62,800 MT).
Late Reporting: For 2020/2021, net sales totaling 123,800 MT of wheat were reported late for unknown destinations (82,600 MT), Venezuela (27,100 MT), Haiti (11,500 MT), Leeward and Windward Islands (2,200 MT), and Japan (500 MT). Exports totaling 41,300 MT of wheat were reported late to Venezuela (27,100 MT), Haiti (11,500 MT), Leeward and Windward Islands (2,200 MT), and Japan (500 MT).
Corn: Net sales of 377,600 MT for 2020/2021 were up noticeably from the previous week and from the prior 4-week average. Increases primarily for Mexico (144,500 MT, including decreases of 38,500 MT), Japan (80,500 MT, including 81,700 MT switched from unknown destinations and decreases of 1,200 MT), Venezuela (59,200 MT, including 39,200 MT – late), Colombia (54,800 MT, including 21,000 MT switched from unknown destinations and 31,700 MT – late), and Canada (45,700 MT, including decreases of 8,900 MT), were offset by reductions primarily for unknown destinations (76,800 MT) and the Dominican Republic (7,500 MT). For 2021/2022, net sales of 601,800 MT were primarily for unknown destinations (278,400 MT, including 20,400 MT – late), Colombia (80,500 MT), Costa Rica (60,800 MT), Mexico (52,200 MT), and Japan (45,000 MT). Exports of 1,060,000 MT were down 25 percent from the previous week and 12 percent from the prior 4-week average. The destinations were primarily to China (352,600 MT, including 71,500 MT – late), Mexico (337,300 MT, including 9,700 MT – late), Japan (80,500 MT), Saudi Arabia (57,900 MT), and Colombia (54,800 MT, including 31,700 MT – late).
Optional Origin Sales: For 2020/2021, the current outstanding balance of 30,500 MT is for unknown destinations. For 2021/2022, the current outstanding balance of 50,000 MT is for unknown destinations.
Late Reporting: For 2020/2021, net sales totaling 222,300 MT of corn were reported late for China (71,500 MT), Venezuela (39,200 MT), Colombia (31,700 MT), unknown destinations (25,900 MT), Guyana (22,800 MT), Trinidad and Tobago (19,900 MT), Suriname (4,000 MT), Jamaica (3,300 MT), Haiti (2,100 MT), and Leeward and Windward Islands (1,900 MT). For 2021/2022, net sales totaling 20,400 MT of corn were reported late for unknown destinations. Exports totaling 206,200 MT of corn were reported late to China (71,500 MT), Venezuela (39,200 MT), Colombia (31,700 MT), Guyana (22,800 MT), Trinidad and Tobago (19,900 MT), Mexico (9,700 MT), Suriname (4,000 MT), Jamaica (3,300 MT), Haiti (2,100 MT), and Leeward and Windward Islands (1,900 MT).
Barley: No net sales or exports were reported for the week.
Sorghum: Net sales of 6,600 MT for 2020/2021 were reported for China (5,600 MT) and Mexico (1,000 MT). Exports of 72,300 MT were up 37 percent from the previous week and 14 percent from the prior 4-week average. The destination was primarily to China (70,600 MT).
Rice: Net sales of 67,100 MT were reported for 2021/2022, which began August 1. Increases were primarily for Haiti (37,800 MT), Mexico (20,900 MT), Guatemala (4,500 MT), Canada (1,800 MT), and the Dominican Republic (700 MT). Total net sales for 2022/2023, of 2,100 MT were for Japan. A total of 237,200 MT in sales were outstanding on July 31 and carried over to 2021/2022. Accumulated exports in 2021/2022 totaled 3,195,900 MT were up 2 percent from the prior year’s total of 3,135,500 MT. The primary destinations were to Mexico (31,600 MT), El Salvador (5,900 MT), Canada (900 MT), Jordan (300 MT), and Belgium (200 MT). Exports for August 1 totaled 4,600 MT, with Canada (1,300 MT), Saudi Arabia (1,000 MT), Japan (800 MT), Jordan (700 MT), and Haiti (300 MT) being the primary destinations.
Exports for Own Account: For 2021/2022, the current exports for own account outstanding balance is 100 MT, all Canada.
Soybeans: Net sales of 96,900 MT for 2020/2021 were up noticeably from the previous week and from the prior 4-week average. Increases primarily for China (84,500 MT), Japan (18,600 MT, including 18,300 MT switched from unknown destinations and decreases of 1,300 MT), Colombia (15,300 MT, including 9,000 MT switched from unknown destinations and decreases of 7,000 MT), Indonesia (6,000 MT, including decreases of 1,500 MT), and Taiwan (4,500 MT, including decreases of 1,600 MT), were offset by reductions primarily for unknown destinations (30,000 MT). For 2021/2022, net sales of 1,120,300 MT primarily for unknown destinations (643,400 MT, including 6,800 MT – late), China (328,000 MT), Taiwan (79,500 MT), Turkey (60,000 MT), and Portugal (15,000 MT), were offset by reductions for Japan (18,900 MT) and Colombia (13,000 MT). Exports of 129,700 MT–a marketing-year low–were down 40 percent from the previous week and 37 percent from the prior 4-week average. The destinations were primarily to Mexico (39,000 MT), Canada (22,500 MT), Japan (21,300 MT), Indonesia (13,600 MT), and Saudi Arabia (9,900 MT).
Exports for Own Account: For 2020/2021, the current exports for own account outstanding balance is 5,800 MT, all Canada.
Late Reporting: For 2020/2021, net sales and exports totaling 4,300 MT of soybeans were reported late for Venezuela. For 2021/2022, net sales totaling 6,800 MT of soybeans were reported late for unknown destinations.
Soybean Cake and Meal: Net sales of 116,300 MT for 2020/2021 were down 14 percent from the previous week, but up 29 percent from the prior 4-week average. Increases primarily for Venezuela (20,600 MT, including 10,600 MT – late), Guyana (17,900 MT – late), Trinidad (13,000 MT, including 9,400 MT – late), Colombia (11,600 MT, including decreases of 11,600 MT), and the Philippines (9,900 MT), were offset by reductions primarily for Costa Rica (900 MT) and Ecuador (400 MT). For 2021/2022, net sales of 268,300 MT were primarily for the Philippines (89,000 MT), Canada (79,900 MT), Colombia (75,000 MT), unknown destinations (11,800 MT), and Panama (6,300 MT). Exports of 251,200 MT were up 33 percent from the previous week and 21 percent from the prior 4-week average. The destinations were primarily to the Philippines (99,100 MT), the Dominican Republic (20,600 MT), Guyana (17,900 MT – late), Canada (17,500 MT), and Colombia (14,200 MT).
Late Reporting: For 2020/2021, net sales totaling 47,700 MT of soybean cake and meal were reported late for Guyana (17,900 MT), Venezuela (10,600 MT), Trinidad and Tobago (9,400 MT), unknown destinations (7,400 MT), Leeward and Windward Islands (1,100 MT), Haiti (700 MT), and Suriname (500 MT). Exports totaling 40,300 MT of soybean cake and meal were reported late to Guyana (17,900 MT), Venezuela (10,600 MT), Trinidad and Tobago (9,400 MT), Leeward and Windward Islands (1,100 MT), Haiti (700 MT), and Suriname (500 MT).
Soybean Oil: Total net sales for 2020/2021, of 300 MT were down 89 percent from the previous week and 73 percent from the prior 4-week average. The destination was for Canada. Exports of 500 MT were down 86 percent from the previous week and 77 percent from the prior 4-week average. The destination was to Canada.
Cotton: Net sales for 2021/2022, which began August 1, totaled 342,700 RB. Increases primarily for China (123,800 RB), Turkey (72,500 RB), Bangladesh (39,400 RB, including decreases of 200 RB), Pakistan (39,100 RB, including decreases of 700 RB), and Vietnam (30,500 RB, including 300 RB switched from Japan and decreases of 2,300 RB), were offset by reductions for Taiwan (200 RB). For 2022/2023, net sales of 15,300 MT were reported for Mexico (6,500 RB), Turkey (4,400 RB), and South Korea (4,400 RB). A total of 1,310,900 RB in sales were carried over from the 2020/2021 marketing year, which ended July 31. Exports for the period ending July 31 of 49,100 RB brought accumulated exports to 14,882,100 RB, up 5 percent from the prior years’ total of 14,174,500 RB. The destinations were primarily Mexico (10,900 RB), Pakistan (8,000 RB), Turkey (6,700 RB), Vietnam (6,400 RB), and Indonesia (5,900 RB). Exports for August 1-5 totaled 190,600 RB, with Pakistan (38,900 RB), Vietnam (36,500 RB), China (30,100 RB), Turkey (23,700 RB), and Mexico (14,000 RB) being the primary destinations. Net sales of Pima for 2021/2022 totaled 10,200 RB. Increases were primarily for Pakistan (3,400 RB), India (2,600 RB), Honduras (2,200 RB), Egypt (1,300 RB), and Guatemala (400 RB). For 2022/2023, net sales of 99,000 RB were primarily for India (52,100 RB), Peru (11,400 RB), Pakistan (10,100 RB), China (9,500 RB), and Honduras (4,400 RB). A total of 88,800 RB in sales were carried over from the 2020/2021 marketing year, which ended July 31. Exports for the period ending July 31 of 3,100 RB brought accumulated exports to 754,900 RB, up 55 percent from the prior years’ total of 486,600 RB. The destinations were primarily Turkey (1,400 RB), India (500 RB), Bangladesh (400 RB), China (400 RB), and Pakistan (200 RB). Exports for August 1-5 totaled 7,700 RB, with Peru (2,500 RB), India (2,100 RB), Pakistan (1,800 RB), China (700 RB), and Bangladesh (300 RB) being the primary destinations.
Exports for Own Account: For 2021/2022, exports for own account total of 4,700 RB were carried over from the 2020/2021 marketing year, which ended July 31. The outstanding balance of 4,700 RB, including carryover, is for China.
Hides and Skins: Net sales of 328,400 pieces for 2021 were up 24 percent from the previous week, but down 3 percent from the prior 4-week average. Increases primarily for China (224,300 whole cattle hides, including decreases of 4,300 pieces), Mexico (49,400 whole cattle hides, including decreases of 600 pieces), South Korea (21,800 whole cattle hides, including decreases of 2,400 pieces), Japan (11,300 whole cattle hides, including decreases of 200 pieces), and Brazil (8,100 whole cattle hides, including decreases of 300 pieces), were offset by reductions primarily to Vietnam (1,700 whole cattle hides). Exports of 416,800 pieces were up 26 percent from the previous week and 9 percent from the prior 4-week average. Whole cattle hides exports were primarily to China (288,300 pieces), South Korea (58,100 pieces), Taiwan (16,400 pieces), Mexico (16,100 pieces), and Thailand (15,200 pieces).
Net sales of 135,700 wet blues for 2021 were up noticeably from the previous week, but down 15 percent from the prior 4-week average. Increases primarily for China (106,500 unsplit), Vietnam (22,400 unsplit), Thailand (5,300 unsplit, including decreases of 700 unsplit), Mexico (900 unsplit), and Brazil (800 unsplit), were offset by reductions for Italy (100 unsplit). Exports of 161,700 wet blues were up noticeably from the previous week and up 20 percent from the prior 4-week average. The destinations were to China (58,800 unsplit), Italy (37,200 unsplit and 11,000 grain splits), Vietnam (29,000 unsplit), Thailand (14,000 unsplit), and Taiwan (9,800 unsplit). Net sales of 121,000 splits resulting in increases for Taiwan (125,100 pounds, including decreases of 900 pounds), were offset by reductions for China (4,100 pounds). Exports of 452,000 pounds were to Vietnam (320,000 pounds), China (89,900 pounds), and Taiwan (42,100 pounds).
Beef: Net sales of 13,600 MT reported for 2021 were down 9 percent from the previous week and 24 percent from the prior 4-week average. Increases were primarily for Japan (6,000 MT, including decreases of 700 MT), South Korea (2,500 MT, including decreases of 800 MT), Mexico (1,900 MT, including decreases of 100 MT), China (1,000 MT, including decreases of 100 MT), and Taiwan (700 MT, including decreases of 100 MT). Exports of 18,600 MT were down 9 percent from the previous week and 3 percent from the prior 4-week average. The destinations were primarily to South Korea (6,000 MT), Japan (4,400 MT), China (3,100 MT), Taiwan (1,500 MT), and Mexico (1,200 MT).
Pork: Net sales of 14,600 MT reported for 2021 were down 62 percent from the previous week and 48 percent from the prior 4-week average. Increases primarily for Mexico (5,300 MT, including decreases of 700 MT), Japan (5,200 MT, including decreases of 1,400 MT), South Korea (2,000 MT, including decreases of 100 MT), China (600 MT, including decreases of 300 MT), and Canada (600 MT, including decreases of 500 MT), were offset by reductions for Australia (1,000 MT). Exports of 27,600 MT were down 3 percent from the previous week and from the prior 4-week average. The destinations were primarily to Mexico (12,600 MT), China (5,200 MT), Japan (3,800 MT), Canada (1,700 MT), and South Korea (1,500 MT).
NOTE: “Late” reporting is included in the U.S. Weekly Export Sales Report: 1) Whenever an exporter discovers an error or is advised by the Export Sales Reporting office of an error on a prior report, the error shall be corrected in the current weekly export sales report to reflect the proper outstanding export sales and exports; and 2) When new exporters register, their first submission includes all export sales and exports in the current marketing year for the specific commodity.
August 12, 2021 1 FOREIGN AGRICULTURAL SERVICE/USDA
SUMMARY OF EXPORT TRANSACTIONS
Reported Under the Daily Reporting System
For Period Ending August 5, 2021
Commodity Destination Quantity (MT) Marketing
SOYBEANS CHINA 131,000 MT 1/ 2021/2022
SOYBEANS UNKNOWN 404,000 MT 1/ 2021/2022
1/ Export sales.
Terry Reilly
Senior Commodity Analyst – Grain and Oilseeds
Futures International
One Lincoln Center
18 W 140 Butterfield Rd.
Oakbrook Terrace, Il. 60181
W: 312.604.1366
ICE IM: treilly1
Skype: fi.treilly

Trading of futures, options, swaps and other derivatives is risky and is not suitable for all persons. All of these investment products are leveraged, and you can lose more than your initial deposit. Each investment product is offered only to and from jurisdictions where solicitation and sale are lawful, and in accordance with applicable laws and regulations in such jurisdiction. The information provided here should not be relied upon as a substitute for independent research before making your investment decisions. Futures International, LLC is merely providing this information for your general information and the information does not take into account any particular individual’s investment objectives, financial situation, or needs. All investors should obtain advice based on their unique situation before making any investment decision. The contents of this communication and any attachments are for informational purposes only and under no circumstances should they be construed as an offer to buy or sell, or a solicitation to buy or sell any future, option, swap or other derivative. The sources for the information and any opinions in this communication are believed to be reliable, but Futures International, LLC does not warrant or guarantee the accuracy of such information or opinions. Futures International, LLC and its principals and employees may take positions different from any positions described in this communication. Past results are not necessarily indicative of future results.