PDF attached
US Initial Jobless Claims Aug 6: 262K (est 265K; prev 260K)
US Continuing Claims Jul 30: 1428K (est 1420K; prev 1416K)
US PPI Final Demand (M/M) Jul: -0.5% (est 0.2; prev 1.1%)
US PPI Final Demand (Y/Y) Jul: 9.8% (est 10.4; prev 11.3%)
US PPI Ex Food and Energy (M/M) Jul: 0.2% (est 0.4; prev 0.4%)
US PPI Ex Food and Energy (Y/Y) Jul: 7.6% (est 7.7; prev 8.2%)
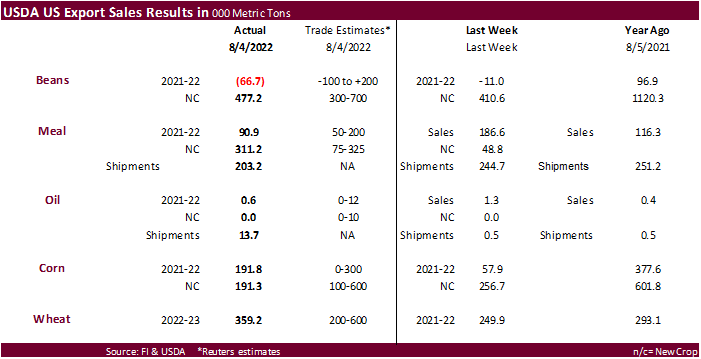
USDA Export Sales
USDA export sales were within expectations for soybeans, good for new-crop meal (shipments were not bad), and slow for soybean oil (shipments increased to 13,700 tons). For new crop soybeans net sales of 477,200 MT were primarily for China (195,000 MT) and unknown destinations (184,200 MT). China bought a small amount of sorghum. USDA US corn export sales were near the low end of expectations on a combined crop year basis and wheat within expectations.
USDA IMPORTANT NOTICE: The upgraded Export Sales Reporting and Maintenance System 2.0 (ESRMS 2.0) is scheduled to be launched on Thursday, August 18, 2022. ESRMS 2.0 will be available from the following url: https://esrms.fas.usda.gov/#/home
This summary is based on reports from exporters for the period July 29-August 4, 2022.
Wheat: Net sales of 359,200 metric tons (MT) for 2022/2023 were up 44 percent from the previous week, but down 34 percent from the prior 4-week average. Increases primarily for Mexico (99,400 MT, including decreases of 10,100 MT), South Korea (62,000 MT, including decreases of 21,000 MT), Taiwan (50,900 MT), Japan (41,200 MT), and the Dominican Republic (36,200 MT, including 32,900 MT switched from unknown destinations), were offset by reductions for unknown destinations (19,500 MT), the Philippines (3,100 MT), and Peru (100 MT). Exports of 615,300 MT