PDF attached
USDA weekly Export Sales
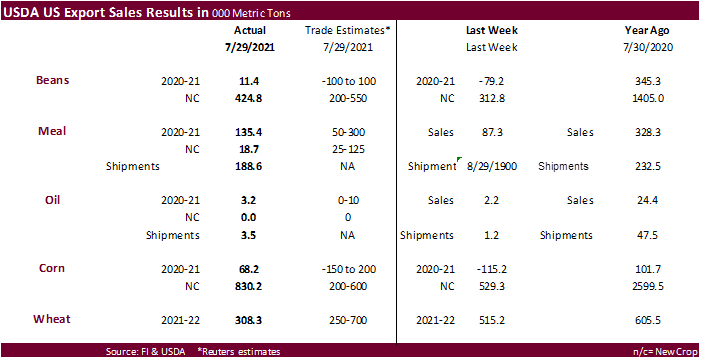
USDA export sales for new-crop corn and soybeans increased from the previous week with Mexico stepping up new-crop corn commitments and China with new-crop soybean commitments. New-crop corn of 830,200 tons included Mexico (238,800MT), Japan (210,700 MT), unknown destinations (101,700 MT), Colombia (96,300MT), and Nicaragua (82,500 MT). New-crop soybeans of 424,800 tons included unknown destinations(142,000 MT), China (129,000 MT), Egypt 65,000 MT), Mexico (43,700 MT), and Japan (20,000 MT). Old crop corn and soybean sales were minimal. Meal export sales were ok at 135,400 tons and shipments were good at 188,600 tons. Soybean oil sales and shipments were poor. All-wheat sales slowed to 306,300 tons and could be perceived as slightly bearish.
U.S. EXPORT SALES FOR WEEK ENDING 07/29/2021
|
|
CURRENT MARKETING YEAR |
NEXT MARKETING YEAR |
||||||
|
COMMODITY |
NET SALES |
OUTSTANDING SALES |
WEEKLY EXPORTS |
ACCUMULATED EXPORTS |
NET SALES |
OUTSTANDING SALES |
||
|
CURRENT YEAR |
YEAR |
CURRENT YEAR |
YEAR |
|||||
|
|
THOUSAND METRIC TONS |
|||||||
|
WHEAT |
|
|
|
|
|
|
|
|
|
HRW |
141.9 |
1,736.3 |
1,727.1 |
95.2 |
1,118.4 |
2,070.1 |
0.0 |
0.0 |
|
SRW |
64.2 |
1,054.2 |
704.1 |
87.2 |
477.9 |
311.2 |
0.0 |
0.0 |
|
HRS |
30.8 |
1,437.6 |
1,852.0 |
131.3 |
966.0 |
1,155.3 |
0.0 |
0.0 |
|
WHITE |
71.4 |
1,060.0 |
1,214.9 |
73.4 |
511.8 |
703.8 |
0.0 |
0.0 |
|
DURUM |
0.0 |
8.4 |
197.0 |
0.0 |
41.7 |
187.9 |
0.0 |
0.0 |
|
TOTAL |
308.3 |
5,296.4 |
5,695.1 |
387.2 |
3,115.8 |
4,428.3 |
0.0 |
0.0 |
|
BARLEY |
0.0 |
22.7 |
36.5 |
0.3 |
2.3 |
2.7 |
0.0 |
0.0 |
|
CORN |
68.2 |
6,200.7 |
5,093.8 |
1,410.7 |
63,522.8 |
38,688.8 |
830.2 |
17,486.9 |
|
SORGHUM |
2.7 |
593.2 |
539.0 |
52.8 |
6,589.8 |
3,812.3 |
0.0 |
1,594.9 |
|
SOYBEANS |
11.4 |
2,604.5 |
6,979.8 |
215.6 |
59,315.6 |
39,960.9 |
424.8 |
10,602.5 |
|
SOY MEAL |
135.4 |
1,861.6 |
1,666.1 |
188.6 |
9,950.6 |
10,109.0 |
18.7 |
1,149.1 |
|
SOY OIL |
3.2 |
17.6 |
192.0 |
3.5 |
665.0 |
1,077.3 |
0.0 |
0.6 |
|
RICE |
|
|
|
|
|
|
|
|
|
L G RGH |
0.0 |
164.9 |
93.3 |
27.6 |
1,642.7 |
1,329.4 |
33.8 |
50.3 |
|
M S RGH |
-1.1 |
2.3 |
23.2 |
4.4 |
30.5 |
73.2 |
0.0 |
7.0 |
|
L G BRN |
0.1 |
11.3 |
9.6 |
0.2 |
40.5 |
59.4 |
0.0 |
0.7 |
|
M&S BR |
0.0 |
0.1 |
31.7 |
0.4 |
157.0 |
86.7 |
0.0 |
0.0 |
|
L G MLD |
-8.7 |
31.2 |
36.3 |
5.4 |
653.8 |
897.9 |
66.9 |
147.4 |
|
M S MLD |
1.2 |
64.8 |
65.3 |
5.1 |
631.6 |
683.0 |
0.3 |
12.7 |
|
TOTAL |
-8.5 |
274.5 |
259.3 |
43.1 |
3,156.1 |
3,129.6 |
101.0 |
218.1 |
|
COTTON |
|
THOUSAND RUNNING BALES |
||||||
|
UPLAND |
17.1 |
1,373.4 |
2,925.4 |
229.5 |
14,833.0 |
14,131.0 |
149.3 |
3,314.0 |
|
PIMA |
2.4 |
91.9 |
120.5 |
8.7 |
751.9 |
483.0 |
9.1 |
14.6 |
SUMMARY OF EXPORT TRANSACTIONS
Reported Under the Daily Reporting System
For Period Ending July 29, 2021
This summary is based on reports from exporters for the period July 23-29, 2021.
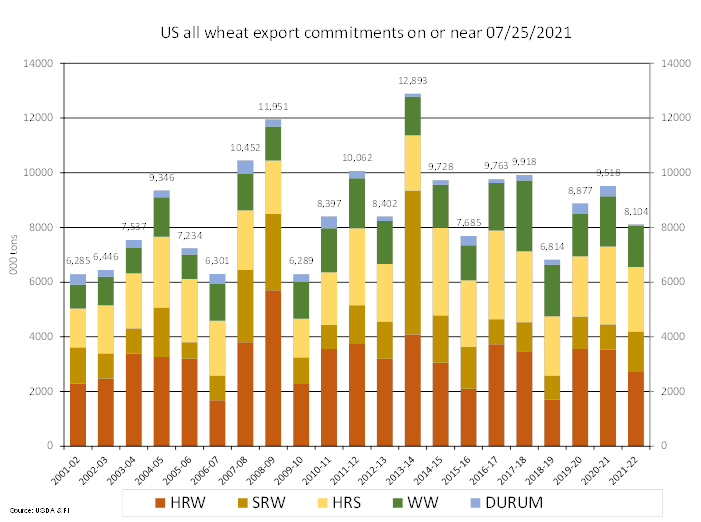
Wheat: Net sales of 308,300 metric tons (MT) for 2021/2022 were down 40 percent from the previous week and 28 percent from the prior 4-week average. Increases primarily for Mexico (97,800 MT, including 30,000 MT switched from unknown destinations and decreases of 18,400 MT), South Korea (54,600 MT), Nigeria (48,000 MT), Colombia (32,200 MT), and the Philippines (27,000 MT, including decreases of 6,000 MT), were offset by reductions primarily for unknown destinations (14,500 MT) and Chile (2,000 MT). Exports of 387,200 MT were up 12 percent from the previous week, but down 1 percent from the prior 4-week average. The destinations were primarily to Mexico (127,400 MT), the Philippines (91,000 MT), South Korea (55,000 MT), Japan (30,200 MT), and Chile (21,000 MT).
Corn: Net sales of 68,200 MT for 2020/2021 were down noticeably from the previous week, but up noticeably from the prior 4-week average. Increases primarily for Mexico (205,400 MT, including decreases of 38,100 MT), Canada (65,200 MT, including decreases of 2,300 MT), Japan (31,600 MT, including 47,100 switched from unknown destinations and decreases of 17,100 MT), Guatemala (22,000 MT, including 21,200 MT switched from Nicaragua and decreases of 700 MT), and Taiwan (3,500 MT), were offset by reductions primarily for China (112,500 MT), unknown destinations (47,100 MT), Nicaragua (46,900 MT), Costa Rica (30,100 MT), and Panama (20,700 MT). For 2021/2022, net sales of 830,200 MT primarily for Mexico (238,800 MT), Japan (210,700 MT), unknown destinations (101,700 MT), Colombia (96,300 MT), and Nicaragua (82,500 MT), were offset by reductions for El Salvador (800 MT). Exports of 1,410,700 MT were up 4 percent from the previous week and 20 percent from the prior 4-week average. The destinations were primarily to China (909,500 MT), Mexico (266,100 MT), Honduras (68,600 MT), Japan (64,100 MT), and Costa Rica (29,700 MT).
Optional Origin Sales: For 2020/2021, the current outstanding balance of 30,500 MT is for unknown destinations. For 2021/2022, decreases of 10,000 MT were reported for unknown destinations. The current outstanding balance of 50,000 MT is for unknown destinations.
Barley: No net sales were reported for the week. Exports of 300 MT were down 35 percent from the previous week, but up 11 percent from the prior 4-week average. The destination was to South Korea.
Sorghum: Net sales of 2,700 MT for 2020/2021 resulting in increases for Mexico (4,000 MT), were offset by reductions for China (1,300 MT). Exports of 52,800 MT were down 24 percent from the previous week, but up 6 percent from the prior 4-week average. The destination was primarily to China (51,700 MT).
Rice: Net sales reductions of 8,500 MT for 2020/2021–a marketing-year low–were down noticeably from the previous week and from the prior 4-week average. Increases primarily for Saudi Arabia (1,900 MT), Canada (1,900 MT), the Netherlands Antilles (200 MT), and Poland (200 MT), were more than offset primarily by reductions for Haiti (12,200 MT) and Mexico (500 MT). For 2021/2022, net sales of 101,000 MT were primarily for Iraq (40,000 MT), Mexico (33,800 MT), Haiti (22,400 MT), and the Dominican Republic (4,200 MT). Exports of 43,100 MT were down 21 percent from the previous week and 26 percent from the prior 4-week average. The destinations were primarily to Mexico (32,800 MT), Japan (3,800 MT), Canada (3,200 MT), Saudi Arabia (2,200 MT), and Israel (200 MT).
Exports for Own Account: For 2020/2021, the current exports for own account outstanding balance is 100 MT, all Canada.
Late Reporting: For 2020/2021, net sales totaling 25,000 MT of long grain rough rice were reported late for Mexico.
Soybeans: Net sales of 11,400 MT for 2020/2021 were down noticeably from the previous week and down 33 percent from the prior 4-week average. Increases primarily for Vietnam (37,200 MT, including 33,500 MT switched from unknown destinations), Indonesia (28,700 MT, including 21,500 MT switched from unknown destinations and decreases of 500 MT), Venezuela (10,000 MT), Colombia (7,000 MT), and Malaysia (6,700 MT, including decreases of 400 MT), were offset by reductions primarily for unknown destinations (51,000 MT) and China (41,000 MT). For 2021/2022, net sales of 424,800 MT were primarily for unknown destinations (142,000 MT), China (129,000 MT), Egypt 65,000 MT), Mexico (43,700 MT), and Japan (20,000 MT). Exports of 215,600 MT were down 12 percent from the previous week, but up 4 percent from the prior 4-week average. The destinations were primarily to Mexico (64,600 MT), Vietnam (39,500 MT), Indonesia (38,700 MT), Japan (32,200 MT), and China (28,500 MT).
Exports for Own Account: For 2020/2021, the current exports for own account outstanding balance is 5,800 MT, all Canada.
Soybean Cake and Meal: Net sales of 135,400 MT for 2020/2021 were up 55 percent from the previous week and 24 percent from the prior 4-week average. Increases primarily for Mexico (34,900 MT, including decreases of 400 MT), the Philippines (30,200 MT), Colombia (20,000 MT, including decreases of 1,400 MT), Turkey (15,000 MT), and Nicaragua (11,200 MT, including 5,500 MT switched from Costa Rica and decreases of 3,200 MT), were offset by reductions for El Salvador (6,000 MT), Costa Rica (5,400 MT), and South Korea (800 MT). For 2021/2022, net sales of 18,700 MT resulting in increases for Morocco (16,500 MT), Jamaica (6,500 MT), Nicaragua (6,000 MT), Mexico (4,500 MT), and Canada (4,400 MT), were offset by reductions for Ecuador (30,000 MT) and El Salvador (400 MT). Exports of 188,600 MT were down 22 percent from the previous week and 7 percent from the prior 4-week average. The destinations were primarily to the Philippines (74,200 MT), Ecuador (31,200 MT), Mexico (19,200 MT), Canada (16,600 MT), and Morocco (13,200 MT).
Soybean Oil: Net sales of 3,200 MT for 2020/2021 were up 48 percent from the previous week and up noticeably from the prior 4-week average. Increases were reported for Venezuela (3,000 MT) and Canada (200 MT). Exports of 3,500 MT were up noticeably from the previous week and up 42 percent from the prior 4-week average. The destinations were primarily to Venezuela (3,000 MT) and Canada (300 MT).
Cotton: Net sales of 17,100 RB for 2020/2021 were up noticeably from the previous week, but down 45 percent from the prior 4-week average. Increases primarily for Mexico (9,300 RB), South Korea (4,200 RB, including decreases of 100 RB), Vietnam (2,800 RB, including 400 RB switched from Japan and decreases of 5,100 RB), China (900 RB), and Bangladesh (700 RB, including 900 switched from Pakistan and decreases of 200 RB), were primarily offset by reductions for Malaysia (600 RB), Japan (300 RB), and El Salvador (300 RB). For 2021/2022, net sales of 149,300 RB primarily for Costa Rica (36,500 RB), Pakistan (35,300 RB), Turkey (35,300 RB), China (15,800 RB), and Thailand (13,300 RB), were offset by reductions for Indonesia (700 RB), Honduras (600 RB), and Guatemala (300 RB). Exports of 229,500 RB were down 4 percent from the previous week and 5 percent from the prior 4-week average. Exports were primarily to Vietnam (42,400 RB), China (35,500 RB), Turkey (34,100 RB), Pakistan (25,000 RB), and Indonesia (17,400 RB). Net sales of Pima totaling 2,400 RB were down 42 percent from the previous week and 49 percent from the prior 4-week average. Increases reported for India (1,700 RB), Peru (400 RB), Colombia (200 RB), Pakistan (100 RB), and Vietnam (100 RB switched from China), were offset by reductions for China (100 RB). For 2021/2022, net sales of 9,100 RB were primarily for China (6,600 RB), India (1,800 RB), Egypt (400 RB), and Guatemala (200 RB). Exports of 8,700 RB were down 7 percent from the previous week and 18 percent from the prior 4-week average. The destinations were primarily to Vietnam (3,000 RB), India (3,000 RB), Austria (800 RB), Brazil (700 RB), and Peru (400 RB).
Exports for Own Account: For 2020/2021, the outstanding balance of 4,700 RB is for China.
Hides and Skins: Net sales of 265,200 pieces for 2021 were down 32 percent from the previous week and 28 percent from the prior 4-week average. Increases were primarily for China (181,100 whole cattle hides, including decreases of 6,400 pieces), Taiwan (32,700 whole cattle hides, including decreases of 100 pieces), South Korea (23,100 whole cattle hides, including decreases of 800 pieces), Mexico (20,400 whole cattle hides, including decreases of 700 pieces), and Japan (5,000 whole cattle hides). Exports of 331,700 pieces were down 15 percent from the previous week and 16 percent from the prior 4-week average. Whole cattle hides exports were primarily to China (246,000 pieces), South Korea (23,300 pieces), Mexico (22,100 pieces), Ethiopia (16,700 pieces), and Thailand (9,200 pieces).
Net sales of 49,200 wet blues for 2021 were down 6 percent from the previous week and 72 percent from the prior 4-week average. Increases primarily for Thailand (17,600 unsplit, including decreases of 400 unsplit), Vietnam (14,800 unsplit), China (10,100 unsplit), Italy (5,600 unsplit, including decreases of 800 unsplit and 300 grain splits), and Mexico (2,200 unsplit, including decreases of 800 unsplit), were offset by reductions for Taiwan (100 unsplit). Exports of 68,200 wet blues were down 58 percent from the previous week and 54 percent from the prior 4-week average. The destinations were to Italy (19,300 unsplit and 1,900 grain splits), Vietnam (14,000 unsplit), Taiwan (8,800 unsplit), Mexico (4,400 unsplit and 4,200 grain splits), and Thailand (8,000 unsplit). Net sales of 225,500 splits reported for Vietnam (228,900 pounds, including decreases of 11,100 pounds) and China (900 pounds, including decreases of 1,200 pounds), were offset by reductions for Taiwan (2,400 pounds) and Italy (1,900 pounds). Exports of 569,300 pounds were to Vietnam (312,000 pounds), Taiwan (126,600 pounds), China (80,700 pounds), and Italy (50,000 pounds).
Beef: Net sales of 15,000 MT reported for 2021 were down 33 percent from the previous week and 26 percent from the prior 4-week average. Increases were primarily for Japan (4,000 MT, including decreases of 600 MT), South Korea (3,300 MT, including decreases of 700 MT), China (2,300 MT, including decreases of 100 MT), Canada (1,200 MT, including decreases of 200 MT), and Indonesia (1,100 MT). Total net sales for 2022, of 100 MT were for Japan. Exports of 20,400 MT were up 6 percent from the previous week and 10 percent from the prior 4-week average. The destinations were primarily to South Korea (6,800 MT), Japan (4,600 MT), China (3,600 MT), Mexico (1,400 MT), and Taiwan (1,200 MT).
Pork: Net sales of 38,800 MT reported for 2021 were up 1 percent from the previous week and 32 percent from the prior 4-week average. Increases primarily for China (18,300 MT, including decreases of 200 MT), Mexico (9,200 MT, including decreases of 1,100 MT), Japan (3,300 MT, including decreases of 500 MT), South Korea (3,100 MT, including decreases of 300 MT), and Canada (1,600 MT, including decreases of 400 MT), were offset by reductions for Nicaragua (200 MT) and Chile (100 MT). Exports of 28,400 MT were down 5 percent from the previous week and 2 percent from the prior 4-week average. The destinations were primarily to Mexico (12,100 MT), China (4,900 MT), Japan (4,000 MT), Canada (1,900 MT), and South Korea (1,300 MT).
Terry Reilly
Senior Commodity Analyst – Grain and Oilseeds
Futures International
One Lincoln Center
18 W 140 Butterfield Rd.
Oakbrook Terrace, Il. 60181
W: 312.604.1366
ICE IM: treilly1
Skype: fi.treilly

Trading of futures, options, swaps and other derivatives is risky and is not suitable for all persons. All of these investment products are leveraged, and you can lose more than your initial deposit. Each investment product is offered only to and from jurisdictions where solicitation and sale are lawful, and in accordance with applicable laws and regulations in such jurisdiction. The information provided here should not be relied upon as a substitute for independent research before making your investment decisions. Futures International, LLC is merely providing this information for your general information and the information does not take into account any particular individual’s investment objectives, financial situation, or needs. All investors should obtain advice based on their unique situation before making any investment decision. The contents of this communication and any attachments are for informational purposes only and under no circumstances should they be construed as an offer to buy or sell, or a solicitation to buy or sell any future, option, swap or other derivative. The sources for the information and any opinions in this communication are believed to be reliable, but Futures International, LLC does not warrant or guarantee the accuracy of such information or opinions. Futures International, LLC and its principals and employees may take positions different from any positions described in this communication. Past results are not necessarily indicative of future results.