PDF attached
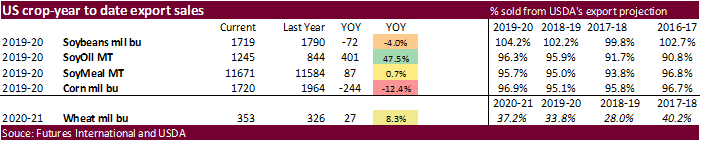
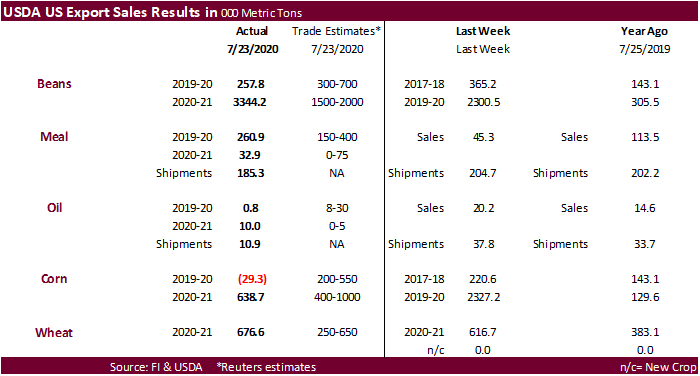
USDA new-crop soybean export sales exceeded expectations while old-crop were below. Soybean meal export sales were within trade estimates but shipments were slow. Soybean oil sales were poor along with lackluster shipments. Corn export sales showed net reductions for old crop and new-crop were 639,000 tons, within expectations. Wheat sales were once again very good. Sorghum sales were poor for old crop but excellent for new-crop of 163,000 tons. Pork sales were 39,600 tons.
This summary is based on reports from exporters for the period July 17-23, 2020.
Wheat: Net sales of 676,600 metric tons (MT) for 2020/2021 were up 10 percent from the previous week and 30 percent from the prior 4-week average. Increases were primarily for the Philippines (132,400 MT, including 16,000 MT switched from unknown destinations and decreases of 9,500 MT), Taiwan (102,800 MT, including decreases of 1,000 MT), Brazil (62,100 MT), Mexico (60,400 MT, including decreases of 65,100 MT), and Japan (60,200 MT). Exports of 505,400 MT were down 4 percent from the previous week and 2 percent from the prior 4-week average. The destinations were primarily to the Philippines (93,400 MT), Thailand (62,800 MT), Mexico (62,200 MT), Brazil (62,100 MT), and Chile (46,500 MT).
Corn: Net sales reductions of 29,300 MT for 2019/2020–a marketing-year low–were down noticeably from the previous week and from the prior 4-week average. Increases primarily for Colombia (41,800 MT, including decreases of 3,200 MT), unknown destinations (27,600 MT), Japan (13,100 MT, including decreases of 2,500 MT), Taiwan (13,000 MT), and Guatemala (11,400 MT, including 4,000 MT switched from Costa Rica, 4,000 MT switched from El Salvador, and 2,000 MT switched from Nicaragua), were offset by reductions primarily for Canada (53,700 MT), Mexico (44,100 MT), Panama (22,100 MT), and El Salvador (14,300 MT). For 2020/2021, net sales of 638,700 MT primarily for unknown destinations (245,900 MT), Mexico (112,000 MT), Japan (100,000 MT), Canada (75,700 MT), and Honduras (32,000 MT), were offset by reductions for Colombia (4,000 MT). Exports of 971,200 MT were down 8 percent from the previous week and 15 percent from the prior 4-week average. The destinations were primarily to Mexico (360,800 MT), Japan (355,100 MT), China (67,900 MT), Guatemala (66,500 MT), and Colombia (58,800 MT).
Optional Origin Sales: For 2019/2020, new exports for own account totaling 65,000 MT were to South Korea. The current outstanding balance of 455,000 MT is for South Korea (325,000 MT), Vietnam (65,000 MT), and Taiwan (65,000 MT). For 2020/2021, the current outstanding balance of 260,000 MT is for Vietnam (195,000 MT) and South Korea (65,000 MT).
Barley: No net sales for 2020/2021 were reported for the week. Exports of 300 MT were to South Korea.
Sorghum: Net sales of 4,300 MT for 2019/2020 were down 95 percent from the previous week and from the prior 4-week average. Increases reported for China (71,400 MT, including 68,000 MT switched from unknown destinations) and Japan (900 MT), were offset by reductions for unknown destinations (68,000 MT). For 2020/2021, net sales of 163,000 MT were for unknown destinations (98,000 MT) and China (65,000 MT). Exports of 82,600 MT were down 33 percent from the previous week and 12 percent from the prior 4-week average. The destinations were to China (71,700 MT) and Japan (10,900 MT).
Rice: Net sales of 23,000 MT for 2019/2020 were up 78 percent from the previous week and 18 percent from the prior 4-week average. Increases were primarily for Haiti (15,300 MT), Canada (1,900 MT), the Dominican Republic (1,900 MT), Saudi Arabia (1,800 MT), and Mexico (600 MT). For 2020/2021, net sales of 6,000 MT were primarily for Costa Rica. Exports of 12,000 MT were down 78 percent from the previous week and 67 percent from the prior 4-week average. The destinations were primarily to Canada (3,400 MT), Saudi Arabia (2,900 MT), Japan (1,700 MT), Israel (1,000 MT), and Mexico (800 MT).
Soybeans: Net sales of 257,800 MT for 2019/2020 were down 29 percent from the previous week and 45 percent from the prior 4-week average. Increases primarily for Germany (152,400 MT), Egypt (151,200 MT, including 38,000 MT switched from unknown destinations and decreases of 800 MT), the Netherlands (116,900 MT, including 55,000 MT switched from unknown destinations), Bangladesh (59,000 MT, switched from unknown destinations), and Indonesia (47,100 MT, including decreases of 10,400 MT), were offset by reductions primarily for unknown destinations (323,600 MT) and China (64,300 MT). For 2020/2021, net sales of 3,344,200 MT primarily for China (1,989,000 MT), unknown destinations (1,232,900 MT), Mexico (64,800 MT), Egypt (43,000 MT), and Taiwan (39,000 MT), were offset by reductions for Switzerland (60,000 MT). Exports of 674,500 MT were up 44 percent from the previous week and 42 percent from the prior 4-week average. The destinations were primarily to Germany (152,400 MT), China (135,600 MT), Mexico (113,400 MT), the Netherlands (56,900 MT), and Algeria (41,800 MT).
Exports for Own Account: For 2019/2020, the current exports for own account outstanding balance is 2,100 MT, all Canada.
Export Adjustments: Accumulated export of soybeans to the Netherland were adjusted down 18,000 MT for week ending February 6th, 26,072 MT for week ending February 27th, 64,651 MT for week ending March 5th, and 43,644 MT for week ending March 12th. The correct destination for these shipments is Germany and is included in this week’s report.
Soybean Cake and Meal: Net sales of 260,900 MT for 2019/2020 were up noticeably from the previous week and from the prior 4-week average. Increases primarily for the Philippines (137,300 MT), Mexico (33,800 MT), Australia (25,000 MT), Canada (24,400 MT, including decreases of 300 MT), and Colombia (20,000 MT, including decreases of 200 MT), were offset by reductions for El Salvador (5,200 MT), Panama (3,400 MT), Belgium (1,500 MT), and the Dominican Republic (800 MT). For 2020/2021, net sales of 32,900 MT primarily for Canada (14,300 MT), Guatemala (11,800 MT), El Salvador (4,200 MT), Panama (3,400 MT), and the Philippines (2,000 MT), were offset by reductions for Morocco (5,000 MT). Exports of 185,300 MT were down 10 percent from the previous week and 19 percent from the prior 4-week average. The destinations were primarily to Colombia (41,700 MT), Morocco (30,600 MT), Canada (21,900 MT), Guatemala (21,800 MT), and Mexico (18,700 MT).
Soybean Oil: Net sales of 800 MT for 2019/2020 were primarily for Canada (300 MT), Mexico (300 MT), and the Dominican Republic (200 MT). For 2020/2021, total net sales of 10,000 MT were for South Korea. Exports of 10,900 MT were down 71 percent from the previous week and 34 percent from the prior 4-week average. The destinations were primarily to Colombia (3,000 MT), Guatemala (2,400 MT), Nicaragua (2,100 MT), El Salvador (1,900 MT), and Canada (800 MT).
Cotton: Net sales of 118,700 RB for 2019/2020 were up noticeably from the previous week and from the prior 4-week average. Increases primarily for Vietnam (76,500 RB, including 2,200 RB switched from China and 800 RB switched from South Korea), China (22,100 RB), Bangladesh (17,600 RB), Turkey (4,000 RB), and Brazil (3,900 RB, switched from Ecuador), were offset by reductions for Ecuador (3,900 RB), Pakistan (2,500 RB), Mexico (2,100 RB), the Philippines (1,900 RB), and India (1,800 RB). For 2020/2021, net sales of 9,500 RB primarily for Vietnam (3,000 RB), Pakistan (2,600 RB), Turkey (1,500 RB), Thailand (1,400 RB), and Bangladesh (1,100 RB), were offset by reductions for Japan (400 RB). Exports of 320,800 RB were up 18 percent from the previous week and 8 percent from the prior 4-week average. Exports were primarily to China (105,100 RB), Vietnam (93,100 RB), Turkey (41,700 RB), Bangladesh (25,400 RB), and Pakistan (18,500 RB). Net sales of Pima totaling 9,100 RB were down 20 percent from the previous week, but up 48 percent from the prior 4-week average. Increases primarily for China (5,700 RB), Pakistan (1,700 RB), Italy (1,400 RB), Thailand (1,100 RB), and Turkey (1,000 RB), were offset by reductions for India (3,500 RB). For 2020/2021, total net sales of 500 RB were for Peru. Exports of 7,800 RB were up noticeably from the previous week and from the prior 4-week average. The destinations were primarily to China (3,100 RB), Pakistan (1,100 RB), Peru (900 RB), India (800 RB), and Bangladesh (700 RB).
Exports for Own Account: For 2019/2020, new exports for own account totaling 26,800 RB were to Vietnam (17,300 RB), Pakistan (4,800 RB), China (3,300 RB), and Bangladesh (1,400 RB). Exports for own account totaling 15,300 RB were primarily to Vietnam (10,900 RB) were applied to new or outstanding sales. Decreases were reported for Indonesia (4,300 RB). The current exports for own account outstanding balance of 31,300 RB is for China (14,300 RB), Vietnam (10,200 RB), Indonesia (3,900 RB), Bangladesh (2,500 RB), and Pakistan (400 RB).
Hides and Skins: Net sales of 447,600 pieces for 2020 were up 4 percent from the previous week, but down 12 percent from the prior 4-week average. Increases primarily for China (343,100 whole cattle hides, including decreases of 12,000 pieces), Mexico (60,100 whole cattle hides, including decreases of 900 pieces), South Korea (32,000 whole cattle hides, including decreases of 2,300 pieces), Turkey (8,100 whole cattle hides), and Vietnam (3,400 whole cattle hides), were offset by reductions primarily for Indonesia (200 whole cattle hides) and Brazil (100 whole cattle hides). Exports of 544,400 pieces reported for 2020 were up 41 percent from the previous week and 23 percent from the prior 4-week average. Whole cattle hides exports were primarily to China (421,100 pieces), Mexico (53,100 pieces), South Korea (47,700 pieces), Brazil (11,400 pieces), and Vietnam (4,500 pieces).
Net sales of 133,100 wet blues for 2020 were down 16 percent from the previous week, but up noticeably from the prior 4-week average. Increases primarily for Brazil (39,900 grain splits), China (39,800 unsplit, including decreases of 200 unsplit), Thailand (20,000 unsplit), Italy (15,100 unsplit, including decreases of 300 unsplit), and Vietnam (11,200 unsplit), were offset by reductions for Taiwan(2,400 unsplit). Exports of 100,400 wet blues for 2020 were up 23 percent from the previous week and 40 percent from the prior 4-week average. The destinations were primarily to Italy (42,800 unsplit and 6,400 grain splits), China (13,600 unsplit), Thailand (12,400 unsplit), Vietnam (7,600 unsplit), and Mexico (6,000 grain splits). Net sales of 237,800 splits were for China (166,300 pounds, including decreases of 3,700 pounds) and Vietnam (71,500 pounds, including decreases of 5,200 pounds). Exports of 394,900 pounds were to Vietnam.
Beef: Net sales of 29,500 MT reported for 2020–a marketing-year high–were up 89 percent from the previous week and 81 percent from the prior 4-week average. Increases primarily for South Korea (11,500 MT, including decreases of 600 MT), Japan (10,600 MT, including decreases of 400 MT), Taiwan (1,500 MT, including decreases of 200 MT), China (1,400 MT), and Hong Kong (1,300 MT, including decreases of 100 MT), were offset by reductions primarily for Chile (100 MT) and the Philippines (100 MT). For 2021, net sales of 1,200 MT were primarily for Mexico (1,100 MT) and the Philippines (100 MT). Exports of 18,300 MT were up 14 percent from the previous week and 19 percent from the prior 4-week average. The destinations were primarily to Japan (6,600 MT), South Korea (5,700 MT), Taiwan (1,400 MT), Canada (1,200 MT), and Hong Kong (1,000 MT).
Pork: Net sales of 39,600 MT reported for 2020 were up 24 percent from the previous week and 12 percent from the prior 4-week average. Increases primarily for China (17,800 MT, including decreases of 1,200 MT), Mexico (15,400 MT, including decreases of 200 MT), Canada (2,300 MT, including decreases of 400 MT), Japan (900 MT, including decreases of 1,800 MT), and the Philippines (800 MT, including 200 MT switched from Vietnam), were offset by reductions primarily for Australia (400 MT). For 2021, total net sales of 400 MT were for Australia. Exports of 31,500 MT were down 12 percent from the previous week and 3 percent from the prior 4-week average. The destinations were primarily to China (10,200 MT), Mexico (9,200 MT), Japan (4,400 MT), Canada (2,300 MT), and South Korea (1,000 MT).
U.S. EXPORT SALES FOR WEEK ENDING 7/23/2020
|
|
CURRENT MARKETING YEAR |
NEXT MARKETING YEAR |
||||||
|
COMMODITY |
NET SALES |
OUTSTANDING SALES |
WEEKLY EXPORTS |
ACCUMULATED EXPORTS |
NET SALES |
OUTSTANDING SALES |
||
|
CURRENT YEAR |
YEAR |
CURRENT YEAR |
YEAR |
|||||
|
|
THOUSAND METRIC TONS |
|||||||
|
WHEAT |
|
|
|
|
|
|
|
|
|
HRW |
210.9 |
1,732.0 |
1,532.4 |
174.4 |
1,792.4 |
2,025.0 |
0.0 |
0.0 |
|
SRW |
37.5 |
659.9 |
853.8 |
53.2 |
266.7 |
320.9 |
0.0 |
0.0 |
|
HRS |
247.1 |
1,808.3 |
1,393.2 |
208.8 |
1,047.1 |
821.4 |
0.0 |
0.0 |
|
WHITE |
158.1 |
1,280.4 |
998.8 |
49.9 |
646.1 |
568.7 |
0.0 |
0.0 |
|
DURUM |
23.0 |
207.0 |
303.7 |
19.0 |
177.8 |
59.4 |
0.0 |
0.0 |
|
TOTAL |
676.6 |
5,687.6 |
5,081.9 |
505.4 |
3,930.2 |
3,795.3 |
0.0 |
0.0 |
|
BARLEY |
0.0 |
36.3 |
48.8 |
0.3 |
2.4 |
7.9 |
0.0 |
0.0 |
|
CORN |
-29.3 |
5,677.7 |
3,894.6 |
971.2 |
38,003.4 |
45,990.7 |
638.7 |
8,327.6 |
|
SORGHUM |
4.3 |
723.9 |
150.8 |
82.6 |
3,640.7 |
1,502.6 |
163.0 |
984.0 |
|
SOYBEANS |
257.8 |
7,448.7 |
7,784.9 |
674.5 |
39,329.7 |
40,940.1 |
3,344.2 |
13,731.2 |
|
SOY MEAL |
260.9 |
1,794.6 |
2,046.1 |
185.3 |
9,876.5 |
9,538.2 |
32.9 |
557.3 |
|
SOY OIL |
0.8 |
215.2 |
127.3 |
10.9 |
1,029.8 |
716.6 |
10.0 |
21.0 |
|
RICE |
|
|
|
|
|
|
|
|
|
L G RGH |
0.0 |
93.3 |
182.8 |
0.0 |
1,329.4 |
1,347.8 |
6.0 |
75.5 |
|
M S RGH |
0.0 |
23.6 |
14.7 |
0.0 |
72.9 |
88.6 |
0.0 |
5.7 |
|
L G BRN |
0.0 |
9.9 |
2.0 |
0.2 |
59.1 |
39.9 |
0.0 |
0.0 |
|
M&S BR |
0.1 |
31.7 |
0.1 |
0.1 |
87.6 |
152.8 |
0.0 |
0.0 |
|
L G MLD |
19.7 |
66.9 |
184.2 |
5.3 |
864.8 |
863.1 |
0.0 |
0.0 |
|
M S MLD |
3.1 |
80.6 |
89.5 |
6.4 |
667.6 |
571.9 |
0.0 |
0.1 |
|
TOTAL |
23.0 |
305.9 |
473.3 |
12.0 |
3,081.4 |
3,064.1 |
6.0 |
81.3 |
|
COTTON |
|
THOUSAND RUNNING BALES |
||||||
|
UPLAND |
118.7 |
3,340.7 |
2,657.1 |
320.8 |
13,784.2 |
12,886.2 |
9.5 |
3,546.3 |
|
PIMA |
9.1 |
136.8 |
82.5 |
7.8 |
466.6 |
642.9 |
0.5 |
38.5 |
Terry Reilly
Senior Commodity Analyst – Grain and Oilseeds
Futures International │190 S LaSalle St., Suite 410│Chicago, IL 60603
W: 312.604.1366
AIM: fi_treilly
ICE IM: treilly1
Skype: fi.treilly

Trading of futures, options, swaps and other derivatives is risky and is not suitable for all persons. All of these investment products are leveraged, and you can lose more than your initial deposit. Each investment product is offered only to and from jurisdictions where solicitation and sale are lawful, and in accordance with applicable laws and regulations in such jurisdiction. The information provided here should not be relied upon as a substitute for independent research before making your investment decisions. Futures International, LLC is merely providing this information for your general information and the information does not take into account any particular individual’s investment objectives, financial situation, or needs. All investors should obtain advice based on their unique situation before making any investment decision. The contents of this communication and any attachments are for informational purposes only and under no circumstances should they be construed as an offer to buy or sell, or a solicitation to buy or sell any future, option, swap or other derivative. The sources for the information and any opinions in this communication are believed to be reliable, but Futures International, LLC does not warrant or guarantee the accuracy of such information or opinions. Futures International, LLC and its principals and employees may take positions different from any positions described in this communication. Past results are not necessarily indicative of future results.