PDF attached
USDA Export Sales
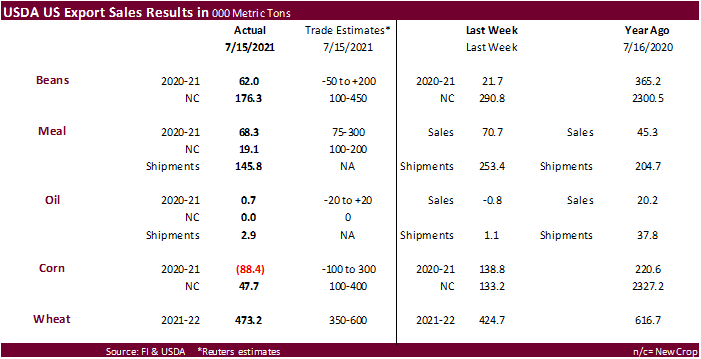
USDA export sales were poor for corn, soybean meal (marketing year low) and soybean oil. Soybeans were on the low side of expectations and wheat was within. The report is viewed negative for the soybean complex and corn. Pork sales were ok at 24,500 tons and included 10k for Mexico. There were 52,200 tons of sorghum sales, for Japan and Mexico.
U.S. EXPORT SALES FOR WEEK ENDING 07/15/2021
|
|
CURRENT MARKETING YEAR |
NEXT MARKETING YEAR |
||||||
|
COMMODITY |
NET SALES |
OUTSTANDING SALES |
WEEKLY EXPORTS |
ACCUMULATED EXPORTS |
NET SALES |
OUTSTANDING SALES |
||
|
CURRENT YEAR |
YEAR |
CURRENT YEAR |
YEAR |
|||||
|
|
THOUSAND METRIC TONS |
|||||||
|
WHEAT |
|
|
|
|
|
|
|
|
|
HRW |
137.0 |
1,631.1 |
1,695.6 |
119.5 |
858.9 |
1,618.0 |
0.0 |
0.0 |
|
SRW |
184.6 |
967.4 |
675.6 |
101.7 |
332.6 |
213.6 |
5.0 |
5.0 |
|
HRS |
113.5 |
1,533.0 |
1,770.1 |
165.3 |
742.3 |
838.3 |
0.0 |
0.0 |
|
WHITE |
38.0 |
1,065.1 |
1,172.2 |
84.5 |
408.2 |
496.2 |
0.0 |
0.0 |
|
DURUM |
0.0 |
8.4 |
203.0 |
0.0 |
41.7 |
158.8 |
0.0 |
0.0 |
|
TOTAL |
473.2 |
5,205.1 |
5,516.5 |
471.0 |
2,383.7 |
3,324.8 |
5.0 |
5.0 |
|
BARLEY |
0.0 |
23.5 |
36.6 |
0.2 |
1.6 |
2.1 |
0.0 |
0.0 |
|
CORN |
-88.5 |
9,019.4 |
6,678.2 |
1,003.5 |
60,751.2 |
37,032.1 |
47.7 |
16,127.4 |
|
SORGHUM |
-52.2 |
710.9 |
802.2 |
59.0 |
6,467.4 |
3,558.1 |
0.0 |
1,594.9 |
|
SOYBEANS |
62.0 |
3,132.2 |
7,865.4 |
164.1 |
58,855.8 |
38,529.1 |
176.3 |
9,864.9 |
|
SOY MEAL |
68.3 |
2,069.7 |
1,719.0 |
145.8 |
9,519.9 |
9,691.2 |
19.1 |
1,057.3 |
|
SOY OIL |
0.7 |
16.9 |
225.2 |
2.9 |
660.3 |
1,018.9 |
0.0 |
0.6 |
|
RICE |
|
|
|
|
|
|
|
|
|
L G RGH |
40.5 |
189.8 |
93.3 |
35.5 |
1,611.3 |
1,329.4 |
5.0 |
5.0 |
|
M S RGH |
0.0 |
8.0 |
23.6 |
0.3 |
25.9 |
72.9 |
0.0 |
7.0 |
|
L G BRN |
0.1 |
11.5 |
10.1 |
0.4 |
40.0 |
58.8 |
0.0 |
0.7 |
|
M&S BR |
0.1 |
0.7 |
31.7 |
22.3 |
156.2 |
86.5 |
0.0 |
0.0 |
|
L G MLD |
29.7 |
46.8 |
52.4 |
18.0 |
645.5 |
859.5 |
0.3 |
0.3 |
|
M S MLD |
2.8 |
113.0 |
83.9 |
3.8 |
579.8 |
661.3 |
0.1 |
12.3 |
|
TOTAL |
73.2 |
369.7 |
294.9 |
80.3 |
3,058.6 |
3,068.5 |
5.4 |
25.3 |
|
COTTON |
|
THOUSAND RUNNING BALES |
||||||
|
UPLAND |
40.0 |
1,825.3 |
3,542.8 |
246.1 |
14,365.5 |
13,463.4 |
251.9 |
2,972.4 |
|
PIMA |
3.4 |
103.3 |
135.6 |
10.4 |
733.8 |
458.8 |
0.9 |
5.4 |
This summary is based on reports from exporters for the period July 9-15, 2021.
Wheat: Net sales of 473,200 metric tons (MT) for 2021/2022 were up 11 percent from the previous week and 44 percent from the prior 4-week average. Increases primarily for China (135,300 MT, including decreases of 3,300 MT), the Philippines (122,800 MT, including decreases of 1,000 MT), Mexico (118,400 MT, including decreases of 2,800 MT), Nigeria (43,700 MT), and Ecuador (41,800 MT, including 41,300 MT switched from unknown destinations), were offset by reductions primarily for Vietnam (53,000 MT). Total net sales for 2022/2023, of 5,000 MT were for unknown destinations. Exports of 471,000 MT were up 29 percent from the previous week and 28 percent from the prior 4-week average. The destinations were primarily to the Philippines (118,800 MT), Mexico (67,700 MT), China (63,500 MT), Nigeria (48,700 MT), and Ecuador (41,800 MT).
Corn: Net sales reductions of 88,500 MT for 2020/2021 were down noticeably from the previous week and from the prior 4-week average. Increases primarily for Japan (57,300 MT, including 43,700 MT switched from unknown destinations and 12,000 MT – late), Panama (20,700 MT), Colombia (10,800 MT, including decreases of 200 MT), Nicaragua (7,500 MT, switched from Honduras), and Canada (6,700 MT), were more than offset by reductions primarily for China (160,000 MT). For 2021/2022, net sales of 47,700 MT were primarily for Japan (18,000 MT), Honduras (9,100 MT), Mexico (9,000 MT), Nicaragua (7,500 MT), and El Salvador (1,300 MT). Exports of 1,003,500 MT were down 6 percent from the previous week and 22 percent from the prior 4-week average. The destinations were primarily to China (526,000 MT), Mexico (235,900 MT), Japan (95,400 MT, including 12,000 MT – late), Venezuela (47,100 MT), and Nicaragua (27,400 MT).
Optional Origin Sales: For 2020/2021, the current outstanding balance of 30,500 MT is for unknown destinations. For 2021/2022, the current outstanding balance of 60,000 MT is for unknown destinations.
Late Reporting: For 2020/2021, net sales and exports totaling 12,000 MT of corn were reported late to Japan.
Barley: No net sales were reported for the week. Exports of 200 MT for 2021/2022 were unchanged from the previous week, but down 25 percent from the prior 4-week average. The destination was to Canada.
Sorghum: Net sales reductions of 52,200 MT for 2020/2021 resulting in increases for Mexico (900 MT) and Japan (100 MT), were more than offset by reductions for China (53,200 MT). Exports of 59,000 MT were down 17 percent from the previous week, but up noticeably from the prior 4-week average. The destinations were to China (58,800 MT) and Mexico (200 MT).
Rice: Net sales of 73,200 MT for 2020/2021 were up noticeably from the previous week and from the prior 4-week average. Increases primarily for Haiti (27,500 MT), Venezuela (25,100 MT), Mexico (16,100 MT), Canada (2,000 MT), and Jordan (1,400 MT), were offset by reductions for Guatemala (1,000 MT). For 2021/2022, net sales of 5,400 MT were primarily for Guatemala (5,000 MT), Costa Rica (200 MT), and Leeward Windward Islands (100 MT). Exports of 80,300 MT were up 24 percent from the previous week and 53 percent from the prior 4-week average. The destinations were primarily to Venezuela (26,300 MT), South Korea (22,200 MT), Haiti (15,300 MT), Honduras (5,500 MT), and Mexico (4,400 MT).
Exports for Own Account: For 2020/2021, the current exports for own account outstanding balance is 100 MT, all Canada.
Soybeans: Net sales of 62,000 MT for 2020/2021 were up noticeably from the previous week, but down 22 percent from the prior 4-week average. Increases primarily for Japan (85,300 MT, including 53,200 MT switched from unknown destinations and decreases of 4,400 MT), Mexico (13,100 MT, including decreases of 11,300 MT), Colombia (9,100 MT, including 8,500 MT switched from unknown destinations), Malaysia (5,600 MT), and Taiwan (5,000 MT), were offset by reductions primarily for unknown destinations (58,200 MT). For 2021/2022, net sales of 176,300 MT were reported for unknown destinations (97,000 MT), Mexico (67,400 MT), China 6,000 MT), Taiwan (5,000 MT), and Vietnam (900 MT). Exports of 164,100 MT were down 17 percent from the previous week and 19 percent from the prior 4-week average. The destinations were primarily to Mexico (60,300 MT), Japan (57,300 MT), Indonesia (22,000 MT), Colombia (9,100 MT), and Vietnam (4,400 MT).
Exports for Own Account: For 2020/2021, the current exports for own account outstanding balance is 5,800 MT, all Canada.
Soybean Cake and Meal: Net sales of 68,300 MT for 2020/2021–a marketing-year low–were down 3 percent from the previous week and 70 percent from the prior 4-week average. Increases primarily for Ireland (28,500 MT, including 30,000 MT switched from Poland and decreases of 1,500 MT), Colombia (25,000 MT), unknown destinations (12,500 MT), Panama (7,100 MT), and Canada (6,700 MT, including decreases of 900 MT), were offset by reductions primarily for Poland (30,000 MT), the French West Indies (6,500 MT), and Nicaragua (5,500 MT). For 2021/2022, net sales of 19,100 MT were primarily for Canada (15,500 MT), Mexico (2,800 MT), and Guatemala (500 MT). Exports of 145,800 MT were down 43 percent from the previous week and 19 percent from the prior 4-week average. The destinations were primarily to the Philippines (49,400 MT), Ireland (28,500 MT), Canada (21,300 MT), Mexico (17,100 MT), and Honduras (7,500 MT).
Soybean Oil: Net sales of 700 MT for 2020/2021 were down noticeably from the previous week and down 16 percent from the prior 4-week average. Increases were reported for Mexico (400 MT) and Canada (300 MT). Exports of 2,900 MT were up noticeably from the previous week, but down 13 percent from the prior 4-week average. The destinations were to Mexico (2,400 MT) and Canada (500 MT).
Cotton: Net sales of 40,000 RB for 2020/2021 were up 16 percent from the previous week, but down 22 percent from the prior 4-week average. Increases primarily for Turkey (15,700 RB, including 500 RB switched from Vietnam and decreases of 600 RB), China (13,200 RB, including 4,100 RB switched from Hong Kong), Pakistan (4,600 RB, including 600 RB switched from Vietnam and 5,100 RB – late), Indonesia (3,700 RB, including 1,100 RB switched from Thailand, 1,000 RB from Vietnam, 900 RB from Pakistan, 700 RB from Japan, and decreases of 1,300 RB), and Vietnam (2,600 RB), were offset by reductions primarily for Hong Kong (4,100 RB) and Mexico (1,000 RB). For 2021/2022, net sales of 251,900 RB primarily for Turkey (100,500 RB), Pakistan (73,500 RB), Vietnam (36,300 RB), Mexico (24,500 RB), and China (13,900 RB), were offset by reductions primarily for the Philippines (2,600 RB) and Japan (2,100 RB). Exports of 246,100 RB were up 32 percent from the previous week and 2 percent from the prior 4-week average. Exports were primarily to Vietnam (55,700 RB), Turkey (42,300 RB), Mexico (29,700 RB), Pakistan (24,300 RB, including 5,100 RB – late), and China (22,200 RB). Net sales of Pima totaling 3,400 RB were down 42 percent from the previous week and 39 percent from the prior 4-week average. Increases were reported for China (1,300 RB), Italy (1,100 RB), and India (1,000 RB, including decreases of 100 RB). For 2021/2022, net sales of 900 RB were reported for Taiwan (400 RB), Bangladesh (400 RB), and Japan (100 RB). Exports of 10,400 RB were up noticeably from the previous week, but down 13 percent from the prior 4-week average. The destinations were primarily to India (4,500 RB), China (2,700 RB), Egypt (900 RB), Thailand (900 RB), and Honduras (900 RB).
Exports for Own Account: For 2020/2021, the current exports for own account outstanding balance of 5,700 RB is for China (4,700 RB) and Vietnam (1,000 RB).
Late Reporting: For 2020/2021, net sales and exports totaling 5,100 RB of upland cotton were reported late for Pakistan.
Hides and Skins: Net sales of 355,800 pieces for 2021 were up 6 percent from the previous week, but down 32 percent from the prior 4-week average. Increases were primarily for China (192,300 whole cattle hides, including decreases of 6,600 pieces), South Korea (71,200 whole cattle hides, including decreases of 1,100 pieces), Mexico (41,000 whole cattle hides, including decreases of 1,400 pieces), Taiwan (26,500 whole cattle hides), and Brazil (14,900 whole cattle hides). Exports of 525,500 pieces were up 85 percent from the previous week and 54 percent from the prior 4-week average. Whole cattle hides exports were primarily to China (364,000 pieces), South Korea (83,000 pieces), Mexico (36,800 pieces), Thailand (27,600 pieces), and Brazil (8,100 pieces).
Net sales of 278,300 wet blues for 2021 were up 7 percent from the previous week and 58 percent from the prior 4-week average. Increases were primarily for China (73,400 unsplit, 14,700 grain splits, and decreases of 100 unsplit), Vietnam (80,400 unsplit, including decreases of 200 unsplit), Italy (52,400 unsplit, 100 grain splits, and decreases of 100 unsplit), Thailand (24,400 unsplit, including decreases of 400 unsplit), and Taiwan (23,600 unsplit). For 2022, net sales of 29,200 unsplit were reported for Italy (21,600 unsplit), Vietnam (4,000 unsplit), and China (3,600 unsplit). Exports of 185,600 wet blues were up 50 percent from the previous week and 41 percent from the prior 4-week average. The destinations were to China (40,800 unsplit and 18,000 grain splits), Italy (37,500 unsplit and 3,200 grain splits), Vietnam (28,700 unsplit), Taiwan (15,000 unsplit), and Thailand (14,400 unsplit). Net sales of 157,500 splits resulting in increases for China (159,400 pounds), were offset by reductions for Vietnam (1,800 pounds). Exports of 204,000 pounds were to Vietnam (160,000 pounds) and China (44,000 pounds).
Beef: Net sales of 25,100 MT reported for 2021 were up noticeably from the previous week and up 63 percent from the prior 4-week average. Increases primarily for South Korea (8,600 MT, including decreases of 500 MT), Japan (5,200 MT, including decreases of 600 MT), China (4,100 MT, including decreases of 100 MT), Canada (2,400 MT, including decreases of 100 MT), and Mexico (1,500 MT, including decreases of 100 MT), were offset by reductions for Belgium (100 MT). Total net sales for 2022, of 300 MT were for Japan. Exports of 21,400 MT–a marketing-year high–were up 38 percent from the previous week and 22 percent from the prior 4-week average. The destinations were primarily to South Korea (5,900 MT), Japan (5,500 MT), China (4,000 MT), Taiwan (1,500 MT), and Mexico (1,400 MT).
Pork: Net sales of 24,500 MT reported for 2021 were up noticeably from the previous week, but down 12 percent from the prior 4-week average. Increases primarily for Mexico (10,000 MT, including decreases of 900 MT), Japan (5,200 MT, including decreases of 200 MT), Canada (4,000 MT, including decreases of 500 MT), Colombia (1,900 MT, including decreases of 100 MT), and Chile (900 MT, including decreases of 100 MT), were offset by reductions for China (100 MT) and Peru (100 MT). Exports of 30,800 MT were up 22 percent from the previous week and 1 percent from the prior 4-week average. The destinations were primarily to Mexico (12,000 MT), China (5,400 MT), Japan (4,400 MT), South Korea (1,900 MT), and Canada (1,700 MT).
Terry Reilly
Senior Commodity Analyst – Grain and Oilseeds
Futures International
One Lincoln Center
18 W 140 Butterfield Rd.
Oakbrook Terrace, Il. 60181
W: 312.604.1366
ICE IM: treilly1
Skype: fi.treilly

Trading of futures, options, swaps and other derivatives is risky and is not suitable for all persons. All of these investment products are leveraged, and you can lose more than your initial deposit. Each investment product is offered only to and from jurisdictions where solicitation and sale are lawful, and in accordance with applicable laws and regulations in such jurisdiction. The information provided here should not be relied upon as a substitute for independent research before making your investment decisions. Futures International, LLC is merely providing this information for your general information and the information does not take into account any particular individual’s investment objectives, financial situation, or needs. All investors should obtain advice based on their unique situation before making any investment decision. The contents of this communication and any attachments are for informational purposes only and under no circumstances should they be construed as an offer to buy or sell, or a solicitation to buy or sell any future, option, swap or other derivative. The sources for the information and any opinions in this communication are believed to be reliable, but Futures International, LLC does not warrant or guarantee the accuracy of such information or opinions. Futures International, LLC and its principals and employees may take positions different from any positions described in this communication. Past results are not necessarily indicative of future results.