PDF attached
U.S. EXPORT SALES FOR WEEK ENDING 7/9/2020
|
|
CURRENT MARKETING YEAR |
NEXT MARKETING YEAR |
||||||
|
COMMODITY |
NET SALES |
OUTSTANDING SALES |
WEEKLY EXPORTS |
ACCUMULATED EXPORTS |
NET SALES |
OUTSTANDING SALES |
||
|
CURRENT YEAR |
YEAR |
CURRENT YEAR |
YEAR |
|||||
|
|
THOUSAND METRIC TONS |
|||||||
|
WHEAT |
|
|
|
|
|
|
|
|
|
HRW |
349.7 |
1,871.1 |
1,642.9 |
304.2 |
1,312.0 |
1,509.3 |
0.0 |
0.0 |
|
SRW |
14.4 |
535.5 |
837.3 |
89.7 |
207.6 |
277.0 |
0.0 |
0.0 |
|
HRS |
280.8 |
1,680.0 |
1,297.1 |
184.6 |
772.1 |
639.8 |
0.0 |
0.0 |
|
WHITE |
103.0 |
1,151.1 |
994.3 |
57.5 |
468.6 |
404.1 |
0.0 |
0.0 |
|
DURUM |
16.5 |
190.0 |
173.2 |
5.5 |
136.7 |
59.4 |
0.0 |
0.0 |
|
TOTAL |
764.4 |
5,427.7 |
4,944.9 |
641.4 |
2,896.9 |
2,889.6 |
0.0 |
0.0 |
|
BARLEY |
-3.0 |
36.9 |
46.3 |
0.3 |
1.8 |
5.5 |
0.0 |
0.0 |
|
CORN |
981.1 |
7,508.6 |
4,913.0 |
1,014.3 |
35,981.2 |
44,708.0 |
655.4 |
5,361.7 |
|
SORGHUM |
72.7 |
848.3 |
201.5 |
70.6 |
3,434.9 |
1,447.7 |
53.0 |
646.0 |
|
SOYBEANS |
313.0 |
7,967.5 |
9,278.8 |
575.3 |
38,340.3 |
39,381.3 |
767.6 |
8,086.5 |
|
SOY MEAL |
177.2 |
1,878.4 |
2,175.3 |
204.4 |
9,486.5 |
9,208.3 |
27.8 |
470.2 |
|
SOY OIL |
5.7 |
242.8 |
145.7 |
2.6 |
981.1 |
680.0 |
0.0 |
11.0 |
|
RICE |
|
|
|
|
|
|
|
|
|
L G RGH |
0.4 |
94.7 |
230.0 |
4.9 |
1,323.3 |
1,264.0 |
12.5 |
69.5 |
|
M S RGH |
0.0 |
23.6 |
14.8 |
0.0 |
72.9 |
88.6 |
0.0 |
5.7 |
|
L G BRN |
0.1 |
10.4 |
2.4 |
0.8 |
58.0 |
39.3 |
0.0 |
0.0 |
|
M&S BR |
0.1 |
31.7 |
0.1 |
0.0 |
87.5 |
152.4 |
0.0 |
0.0 |
|
L G MLD |
15.2 |
65.2 |
158.8 |
5.6 |
840.5 |
840.0 |
0.0 |
0.0 |
|
M S MLD |
2.8 |
111.7 |
127.2 |
6.8 |
632.0 |
528.2 |
0.0 |
0.1 |
|
TOTAL |
18.5 |
337.2 |
533.3 |
18.2 |
3,014.2 |
2,912.4 |
12.5 |
75.2 |
|
COTTON |
|
THOUSAND RUNNING BALES |
||||||
|
UPLAND |
-17.5 |
3,827.2 |
3,093.4 |
311.7 |
13,192.1 |
12,276.7 |
29.1 |
3,525.9 |
|
PIMA |
5.8 |
126.5 |
95.5 |
0.8 |
456.5 |
628.1 |
0.0 |
37.5 |
This summary is based on reports from exporters for the period July 3-9, 2020.
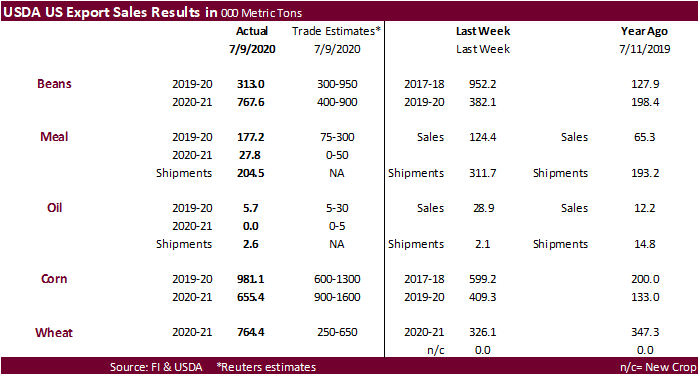
Wheat: Net sales of 764,400 metric tons (MT) for 2020/2021–a marketing-year high–were up noticeably from the previous week and up 77 percent from the prior 4-week average. Increases primarily for China (323,700 MT), Mexico (132,800 MT, including 22,000 MT switched from unknown destinations and decreases of 5,100 MT), Indonesia (81,500 MT), Japan (67,300 MT), and the Philippines (66,000 MT), were offset by reductions for unknown destinations (41,300 MT), Venezuela (18,000 MT), Malaysia (1,700 MT), and Nicaragua (200 MT). Exports of 641,400 MT were up 56 percent from the previous week and 23 percent from the prior 4-week average. The destinations were primarily to China (113,700 MT), Taiwan (94,500 MT), Japan (92,000 MT), Mexico (83,800 MT), and the Philippines (66,000 MT).
Corn: Net sales of 981,100 MT for 2019/2020 were up noticeably from the previous week and from the prior 4-week average. Increases primarily for China (768,300 MT), Colombia (109,800 MT), Peru (74,700 MT, including 68,400 MT switched from unknown destinations), Saudi Arabia (71,500 MT, including 65,000 MT switched from unknown destinations), and Japan (52,500 MT, including 42,300 MT switched from unknown destinations and decreases of 800 MT), were offset by reductions primarily for unknown destinations (145,700 MT), Nicaragua (14,000 MT), Guatemala (8,400 MT), Costa Rica (8,400 MT), and South Korea (2,200 MT). For 2020/2021, net sales of 655,400 MT primarily for China (600,000 MT), Japan (54,000 MT), Guatemala (32,500 MT), Honduras (20,900 MT), and Costa Rica (8,000 MT), were offset by reductions for unknown destinations (62,000 MT). Exports of 1,014,300 MT were down 7 percent from the previous week and 14 percent from the prior 4-week average. The destinations were primarily to Mexico (275,400 MT), Japan (228,000 MT), China (119,700 MT), Peru (96,400 MT), and Saudi Arabia (71,500 MT).
Optional Origin Sales: For 2019/2020, the current outstanding balance of 325,000 MT is for South Korea (195,000 MT), Vietnam (65,000 MT), and Taiwan (65,000 MT). For 2020/2021, the current outstanding balance of 195,000 MT is for Vietnam.
Barley: Net sales reductions of 3,000 MT for 2020/2021–a marketing-year low–were reported for Japan. Exports of 300 MT were primarily to South Korea (200 MT) and Taiwan (100 MT).
Sorghum: Net sales of 72,700 MT for 2019/2020 were up 35 percent from the previous week and 50 from the prior 4-week average. Increases reported for China (135,100 MT, including 66,000 MT switched from unknown destinations), were offset by reductions for unknown destinations (62,400 MT). For 2020/2021, total net sales of 53,000 MT were for unknown destinations. Exports of 70,600 MT were up 38 percent from the previous week, but down 44 percent from the prior 4-week average. The destination was China.
Rice: Net sales of 18,500 MT for 2019/2020 were down 14 percent from the previous week, but up 56 from the prior 4-week average. Increases were primarily for Haiti (11,200 MT), Canada (3,200 MT, including decreases of 100 MT), Mexico (1,800 MT), Saudi Arabia (600 MT), and Qatar (400 MT). For 2020/2021, total net sales of 12,500 MT were for Nicaragua. Exports of 18,200 MT were down 14 percent from the previous week and 63 percent from the prior 4-week average. The destinations were primarily to Mexico (5,700 MT), Japan (3,800 MT), Canada (3,600 MT), Saudi Arabia (2,800 MT), and Taiwan (600 MT).
Exports for Own Account: For 2019/2020, the current exports for own account outstanding balance is 100 MT, all Canada.
Soybeans: Net sales of 313,000 MT for 2019/2020 were down 67 percent from the previous week and 46 percent from the prior 4-week average. Increases primarily for Indonesia (95,500 MT, including 68,000 MT switched from unknown destinations), Egypt (75,000 MT), Pakistan (58,300 MT, including 60,000 MT switched from unknown destinations and decreases of 1,700 MT), Mexico (55,700 MT, including 47,500 MT switched from unknown destinations and decreases of 1,300 MT), and Tunisia (37,100 MT, including 32,000 MT switched from China), were offset by reductions for Algeria (35,000 MT), unknown destinations (19,500 MT), China (5,800 MT), and Panama (300 MT). For 2020/2021, net sales of 767,600 MT were primarily for China (389,000 MT), unknown destinations (176,000 MT), Spain (75,000 MT), Algeria (35,000 MT), and Mexico (19,600 MT). Exports of 575,300 MT were up 23 percent from the previous week and 49 percent from the prior 4-week average. The destinations were primarily to China (227,900 MT), Indonesia (89,100 MT), Mexico (70,700 MT), Tunisia (67,100 MT), and Pakistan (58,300 MT).
Exports for Own Account: For 2019/2020, the current exports for own account outstanding balance is 2,100 MT, all Canada.
Soybean Cake and Meal: Net sales of 177,200 MT for 2019/2020 were up 43 percent from the previous week and 54 percent from the prior 4-week average. Increases primarily for Japan (33,000 MT, including 3,000 MT switched from unknown destinations), Colombia (31,000 MT), the Dominican Republic (30,000 MT), Canada (20,400 MT), and the Philippines (19,400 MT), were offset by reductions primarily for unknown destinations (8,000 MT). For 2020/2021, net sales of 27,800 MT were for Honduras (12,000 MT), El Salvador (6,300 MT), Costa Rica (6,000 MT), the Philippines (2,500 MT), and unknown destinations (1,000 MT). Exports of 204,400 MT were down 34 percent from the previous week and 18 percent from the prior 4-week average. The destinations were primarily to the Philippines (94,100 MT), Mexico (31,600 MT), Canada (27,800 MT), Guatemala (9,800 MT), and Panama (6,600 MT).
Soybean Oil: Net sales of 5,700 MT for 2019/2020 were primarily for Guatemala (4,200 MT, including decreases of 3,000 MT), Mexico (800 MT), the Dominican Republic (500 MT), and Canada (200 MT). Exports of 2,600 MT were up 25 percent from the previous week, but down 87 percent from the prior 4-week average. The destinations were primarily to Mexico (1,500 MT), Trinidad and Tobago (700 MT), and Canada (300 MT).
Cotton: Net sales reductions of 17,500 RB for 2019/2020 were down noticeably from the previous week and from the prior 4-week average. Increases primarily for Vietnam (26,500 RB, including 4,600 RB switched from China, 2,200 RB switched from South Korea, and 1,000 RB switched from Hong Kong), Pakistan (6,400 RB), and Indonesia (2,100 RB, including 1,700 RB switched from Taiwan and 200 RB switched from Japan), were more than offset by reductions primarily for China (38,600 RB), El Salvador (4,000 RB), Peru (3,600 RB), Thailand (2,900 RB), and Bangladesh (1,300 RB). For 2020/2021, net sales of 29,100 RB primarily for China (8,800 RB), South Korea (6,600 RB), Bangladesh (4,400 RB), El Salvador (4,000 RB), and Indonesia (3,700 RB), were offset by reductions for Pakistan (500 RB). Exports of 311,700 RB were down 5 percent from the previous week and 2 percent from the prior 4-week average. Exports were primarily to Vietnam (94,500 RB), China (91,700 RB), Turkey (36,700 RB), Pakistan (32,900 RB), and Bangladesh (12,700 RB). Net sales of Pima totaling 5,800 RB were up noticeably from the previous week and up 39 percent from the prior 4-week average. Increases were primarily for China (1,800 RB), Egypt (1,300 RB), Pakistan (1,100 RB), India (600 RB), and Turkey (400 RB). Exports of 800 RB–a marketing-year low–were down 89 percent from the previous week and 88 percent from the prior 4-week average. The destinations were to Pakistan (400 RB), Honduras (300 RB), and Indonesia (100 RB).
Exports for Own Account: For 2019/2020, new exports for own account totaling 400 RB were to Vietnam. Exports for own account totaling 6,800 RB to Vietnam (4,700 RB), China (900 RB), Pakistan (600 RB), and Bangladesh (600 RB) were applied to new or outstanding sales. The current exports for own account outstanding balance of 18,400 RB is for China (8,500 RB), Indonesia (8,200 RB), Bangladesh (1,000 RB), and Vietnam (700 RB).
Hides and Skins: Net sales of 573,900 pieces for 2020 were down 9 percent from the previous week, but up 16 percent from the prior 4-week average. Increases primarily for China (438,300 whole cattle hides, including decreases of 17,900 pieces), South Korea (69,700 whole cattle hides, including decreases of 300 pieces), Mexico (26,000 whole cattle hides, including decreases of 2,500 pieces), Brazil (14,300 whole cattle hides), and Thailand (8,700 whole cattle hides, including decreases of 4,100 pieces), were offset by reductions for Indonesia (300 pieces). Exports of 464,100 pieces reported for 2020 were down 10 percent from the previous week, but up 4 percent from the prior 4-week average. Whole cattle hides exports were primarily to China (369,700 pieces), South Korea (41,000 pieces), Mexico (21,700 pieces), Thailand (19,000 pieces), and Indonesia (6,600 pieces). In addition, exports of 1,300 kip skins were to Canada.
Net sales of 12,500 wet blues for 2020 resulting in increases for China (63,600 unsplit and 4,400 grain splits), Italy (4,600 unsplit), India (1,900 grain splits), Taiwan (1,600 grain splits), and South Korea (1,500 grain splits), were more than offset by reductions for Mexico (64,900 grain splits). Exports of 80,900 wet blues for 2020 were up 73 percent from the previous week and 17 percent from the prior 4-week average. The destinations were primarily to China (40,100 unsplit), Italy (28,000 unsplit), Thailand (4,000 unsplit), Taiwan (3,200 unsplit), and Vietnam (2,900 unsplit). Net sales of 244,400 splits were for China (240,600 pounds) and Vietnam (3,800 pounds). Exports of 40,000 pounds were to Vietnam.
Beef: Net sales of 27,800 MT reported for 2020 were up noticeably from the previous week and up 68 percent from the prior 4-week average. Increases were primarily for South Korea (7,900 MT, including decreases of 400 MT), Japan (6,300 MT, including decreases of 400 MT), Mexico (3,600 MT, including decreases of 100 MT), Taiwan (2,500 MT, including decreases of 100 MT), and Canada (2,000 MT, including decreases of 200 MT). Exports of 15,500 MT were up 3 percent from the previous week and 9 percent from the prior 4-week average. The destinations were primarily to Japan (5,200 MT), South Korea (5,100 MT), Taiwan (1,200 MT), Canada (1,000 MT), and Mexico (800 MT).
Pork: Net sales of 38,500 MT reported for 2020 were up 22 percent from the previous week and 16 percent from the prior 4-week average. Increases were primarily for Mexico (10,100 MT, including decreases of 400 MT), China (8,000 MT, including decreases of 800 MT), Canada (5,700 MT, including decreases of 400 MT), Japan (3,700 MT, including decreases of 300 MT), and South Korea (3,300 MT, including decreases of 300 MT). Exports of 29,300 MT were down 13 percent from the previous week and 8 percent from the prior 4-week average. The destinations were primarily to China (12,300 MT), Mexico (7,600 MT), Japan (2,700 MT, including 100 MT late – see below), Canada (2,100 MT), and South Korea (1,600 MT).
Terry Reilly
Senior Commodity Analyst – Grain and Oilseeds
Futures International │190 S LaSalle St., Suite 410│Chicago, IL 60603
W: 312.604.1366
AIM: fi_treilly
ICE IM: treilly1
Skype: fi.treilly

Trading of futures, options, swaps and other derivatives is risky and is not suitable for all persons. All of these investment products are leveraged, and you can lose more than your initial deposit. Each investment product is offered only to and from jurisdictions where solicitation and sale are lawful, and in accordance with applicable laws and regulations in such jurisdiction. The information provided here should not be relied upon as a substitute for independent research before making your investment decisions. Futures International, LLC is merely providing this information for your general information and the information does not take into account any particular individual’s investment objectives, financial situation, or needs. All investors should obtain advice based on their unique situation before making any investment decision. The contents of this communication and any attachments are for informational purposes only and under no circumstances should they be construed as an offer to buy or sell, or a solicitation to buy or sell any future, option, swap or other derivative. The sources for the information and any opinions in this communication are believed to be reliable, but Futures International, LLC does not warrant or guarantee the accuracy of such information or opinions. Futures International, LLC and its principals and employees may take positions different from any positions described in this communication. Past results are not necessarily indicative of future results.