PDF attached
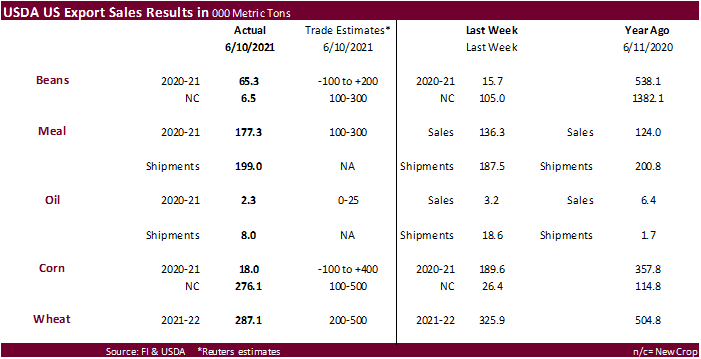
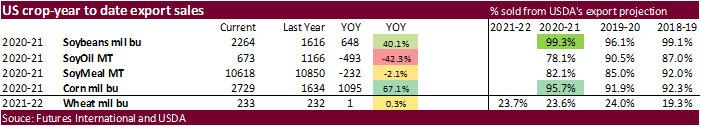
USDA export sales were on the low side for many of the major commodities, but good meal shipments may provide a positive undertone for that commodity coupled by unwinding of oil/meal spreads. Soybean sales were only 65,300 tons, within expectations, and not a surprise as commitments is running 99 percent of USDA’s projection. Corn sales of 18,000 old crop and 276,100 tons new crop were poor. All-wheat sales cooled last week to 287,100 tons from 325,900 tons, negative in our opinion. Soybean meal sales improved to 177,300 tons and shipments were 199,000. Soybean oil commitments were only 2,300 tons and shipments were off from the previous week at 8,000 tons. We look for sales to improve next week amid break in futures prices.
U.S. EXPORT SALES FOR WEEK ENDING 6/10/2021
|
|
CURRENT MARKETING YEAR |
NEXT MARKETING YEAR |
||||||
|
COMMODITY |
NET SALES |
OUTSTANDING SALES |
WEEKLY EXPORTS |
ACCUMULATED EXPORTS |
NET SALES |
OUTSTANDING SALES |
||
|
CURRENT YEAR |
YEAR AGO |
CURRENT YEAR |
YEAR AGO |
|||||
|
|
THOUSAND METRIC TONS |
|||||||
|
WHEAT |
|
|
|
|
|
|
|
|
|
HRW |
130.6 |
1,587.0 |
2,038.7 |
150.6 |
210.2 |
288.5 |
0.0 |
0.0 |
|
SRW |
25.0 |
1,015.6 |
571.1 |
4.6 |
4.6 |
17.5 |
0.0 |
0.0 |
|
HRS |
81.6 |
1,642.3 |
1,767.1 |
63.4 |
85.3 |
130.0 |
0.0 |
0.0 |
|
WHITE |
50.4 |
1,111.5 |
1,059.4 |
53.7 |
108.5 |
174.5 |
0.0 |
0.0 |
|
DURUM |
-0.5 |
8.4 |
238.2 |
26.3 |
26.3 |
48.5 |
0.0 |
0.0 |
|
TOTAL |
287.1 |
5,364.7 |
5,674.4 |
298.6 |
434.8 |
658.9 |
0.0 |
0.0 |
|
BARLEY |
0.0 |
24.7 |
40.2 |
0.0 |
0.0 |
0.5 |
0.0 |
0.0 |
|
CORN |
18.0 |
14,742.5 |
10,361.1 |
1,661.6 |
54,573.3 |
31,129.7 |
276.1 |
15,369.9 |
|
SORGHUM |
-5.0 |
889.2 |
941.3 |
116.0 |
6,336.9 |
3,071.9 |
0.0 |
1,594.9 |
|
SOYBEANS |
65.3 |
3,724.9 |
7,593.0 |
148.3 |
57,893.0 |
36,385.4 |
6.5 |
7,562.1 |
|
SOY MEAL |
177.3 |
1,961.4 |
2,369.3 |
199.0 |
8,656.9 |
8,480.8 |
7.8 |
649.5 |
|
SOY OIL |
2.2 |
29.2 |
265.5 |
8.0 |
644.0 |
900.5 |
0.0 |
0.6 |
|
RICE |
|
|
|
|
|
|
|
|
|
L G RGH |
18.0 |
193.2 |
158.1 |
13.5 |
1,469.9 |
1,245.8 |
0.0 |
0.0 |
|
M S RGH |
0.0 |
15.9 |
26.2 |
0.2 |
25.0 |
70.2 |
0.0 |
0.0 |
|
L G BRN |
0.8 |
13.3 |
12.6 |
0.6 |
38.3 |
55.4 |
0.0 |
0.0 |
|
M&S BR |
0.1 |
45.2 |
38.0 |
0.1 |
111.4 |
80.9 |
0.0 |
0.0 |
|
L G MLD |
17.6 |
32.6 |
58.9 |
45.3 |
601.1 |
824.8 |
0.0 |
0.0 |
|
M S MLD |
1.3 |
163.6 |
144.8 |
18.5 |
522.4 |
584.5 |
0.0 |
0.0 |
|
TOTAL |
37.8 |
463.8 |
438.7 |
78.3 |
2,768.1 |
2,861.6 |
0.0 |
0.0 |
|
COTTON |
|
THOUSAND RUNNING BALES |
||||||
|
UPLAND |
111.3 |
2,788.1 |
4,864.9 |
303.8 |
13,158.8 |
11,958.0 |
102.9 |
2,144.4 |
|
PIMA |
2.3 |
135.5 |
131.2 |
12.0 |
675.4 |
434.4 |
0.0 |
4.0 |
This summary is based on reports from exporters for the period June 4-June 10, 2021.
Wheat: Net sales of 287,100 metric tons (MT) were reported for delivery in marketing year 2021/2022. Increases primarily for Japan (95,100 MT, including decreases of 300 MT), unknown destinations (72,000 MT), Mexico (49,600 MT, including decreases of 100 MT), Thailand (34,000 MT), and the Dominican Republic (14,600 MT), were offset by reductions primarily for Guatemala (2,000 MT) and Italy (600 MT). Exports of 298,600 MT were primarily to Nigeria (77,500 MT), Taiwan (42,700 MT), the Philippines (34,500 MT), Japan (34,200 MT), and Nicaragua (32,000 MT).
Optional Origin Sales: For 2021/2022, options were exercised to export 63,900 MT to Spain from other than the United States.
Corn: Net sales of 18,000 MT for 2020/2021 were down 91 percent from the previous week and 95 percent from the prior 4-week average. Increases primarily for Japan (69,900 MT, including 138,200 MT switched from unknown destinations and decreases of 70,500 MT), Saudi Arabia (57,500 MT), Colombia (44,000 MT, including 40,000 MT switched from unknown destinations), Mexico (35,700 MT, including decreases of 7,300 MT), and Nicaragua (31,400 MT, including 20,900 MT switched from El Salvador, 7,500 MT switched from Guatemala, and decreases of 4,500 MT), were offset by reductions primarily for unknown destinations (152,200 MT) and Costa Rica (96,700 MT). For 2021/2022, net sales of 276,100 MT were primarily for Mexico (100,000 MT), Costa Rica (97,400 MT), Guatemala (42,200 MT), Taiwan (21,500 MT), and Jamaica (6,900 MT). Exports of 1,661,600 MT were up 1 percent from the previous week, but down and 16 percent from the prior 4-week average. The destinations were primarily to China (615,000 MT), Japan (550,300 MT), Mexico (348,100 MT), Colombia (44,000 MT), and Morocco (34,400 MT).
Optional Origin Sales: For 2020/2021, the current outstanding balance of 30,500 MT is for unknown destinations. For 2021/2022, the current outstanding balance of 60,000 MT is for unknown destinations.
Barley: No net sales or exports were reported for the week.
Sorghum: Net sales reduction of 5,000 MT for 2020/2021 resulting in increases for China (63,000 MT, including 68,000 MT switched from unknown destinations and decreases of 5,000 MT), were more than offset by reductions for unknown destinations (68,000 MT). Exports of 116,000 MT were up noticeably from the previous week, but down 10 percent from the prior 4-week average. The destination was China.
Rice: Net sales of 37,800 MT for 2020/2021 were up 28 percent from the previous week, but down 19 percent from the prior 4-week average. Increases were primarily for Haiti (14,700 MT, including decreases of 600 MT), Mexico (7,900 MT, including decreases of 100 MT), Guatemala (5,000 MT), Honduras (5,000 MT), and Canada (2,200MT, including decreases of 400 MT). Exports of 78,300 MT were up 20 percent from the previous week and 29 percent from the prior 4-week average. The destinations were primarily to Haiti (37,400 MT), Japan (13,600 MT), Panama (10,200 MT), Mexico (4,500 MT), and Canada (3,100 MT).
Exports for Own Account: For 2020/2021, exports for own account totaling 100 MT to Canada were applied to new or outstanding sales.
Soybeans: Net sales of 65,300 MT for 2020/2021 were up noticeably from the previous week and up 51 percent from the prior 4-week average. Increases primarily for Japan (15,500 MT, including 11,000 MT switched from unknown destinations), Colombia (15,000 MT, including 10,000 MT switched from unknown destinations), Indonesia (12,300 MT, including decreases of 1,500 MT), Saudi Arabia (9,500 MT), and Canada (9,400 MT), were offset by reductions for unknown destinations (10,000 MT). For 2021/2022, net sales of 6,500 MT resulting in increases for unknown destinations (29,500 MT) and Taiwan (20,000 MT), were offset by reductions for China (43,000 MT). Exports of 148,300 MT–a marketing-year low–were down 47 percent from the previous week and 48 percent from the prior 4-week average. The destinations were primarily to Japan (40,500 MT), Mexico (32,700 MT), Venezuela (17,700 MT), Indonesia (16,500 MT), and Colombia (12,500 MT).
Exports for Own Account: For 2020/2021, the current exports for own account outstanding balance is 5,800 MT, all Canada.
Soybean Cake and Meal: Net sales of 177,300 MT for 2020/2021 were up 30 percent from the previous week, but down 4 percent from the prior 4-week average. Increases primarily for Vietnam (50,000 MT), Ireland (40,000 MT), Canada (28,400 MT, including decreases of 1,900 MT), Colombia (16,000 MT), and Mexico (9,500 MT, including decreases of 4,700 MT), were offset by reductions primarily for Honduras (3,000 MT) and Belgium (2,800 MT). For 2021/2022, net sales of 7,800 MT were for Jamaica (6,500 MT), Mexico (1,000 MT), and Canada (300 MT). Exports of 199,000 MT were up 6 percent from the previous week and 5 percent from the prior 4-week average. The destinations were primarily to the Philippines (68,800 MT), the Dominican Republic (31,300 MT), Canada (26,300 MT), Mexico (21,100 MT), and Cote D’Ivoire (16,500 MT).
Soybean Oil: Net sales of 2,200 MT for 2020/2021 were down 31 percent from the previous week, but up noticeably from the prior 4-week average. Increases reported for Mexico (1,900 MT) and Canada (700 MT, including decreases of 300 MT), were offset by reductions for Guatemala (400 MT). Exports of 8,000 MT were down 57 percent from the previous week and 26 percent from the prior 4-week average. The destinations were primarily to Guatemala (6,700 MT) and Canada (1,200 MT).
Cotton: Net sales of 111,300 RB for 2020/2021 were up 3 percent from the previous week, but down 22 percent from the prior 4-week average. Increases primarily for Pakistan (53,000 RB, including decreases of 100 RB), Turkey (17,800 RB), Indonesia (9,700 RB, including 400 RB switched from Japan), Mexico (6,500 RB, including decreases of 6,600 RB), and Vietnam (5,900 RB, including 400 RB switched from Japan), were offset by reductions for the Philippines (100 RB). For 2021/2022, net sales of 102,900 RB primarily for Pakistan (84,600 RB), Turkey (7,900 RB), Indonesia (5,300 RB), Vietnam (4,800 RB), and Japan (3,600 RB), were offset by reductions for China (8,800 RB). Exports of 303,800 RB were up 18 percent from the previous week, but down 6 percent from the prior 4-week average. Exports were primarily to Vietnam (97,800 RB), Turkey (49,100 RB), China (38,100 RB), Pakistan (31,200 RB), and Mexico (20,600 RB). Net sales of Pima totaling 2,300 RB–a marketing-year low–were down 40 percent from the previous week and 71 percent from the prior 4-week average. Increases were primarily for China (900 RB), Bangladesh (400 RB), Thailand (400 RB), Germany (300 RB), and Vietnam (200 RB). Exports of 12,000 RB were down 28 percent from the previous week and 13 percent from the prior 4-week average. The destinations were primarily to India (4,200 RB), Turkey (3,000 RB), Honduras (1,000 RB), Egypt (1,000 RB), and Japan (900 RB).
Exports for Own Account: For 2020/2021, the current exports for own account outstanding balance of 11,100 RB is for China (6,200 RB), Vietnam (4,500 RB), and Bangladesh (400 RB).
Hides and Skins: Net sales of 240,900 pieces for 2021 were down 49 percent from the previous week and 39 percent from the prior 4-week average. Increases primarily for China (149,300 whole cattle hides, including decreases of 2,100 pieces), South Korea (38,500 whole cattle hides, including decreases of 1,200 pieces), Mexico (26,300 whole cattle hides, including decreases of 600 pieces), and Indonesia (13,900 whole cattle hides, including decreases of 100 pieces), were offset by reductions for Italy (200 pieces). Exports of 355,800 pieces were up 1 percent from the previous week, but down 3 percent from the prior 4-week average. Whole cattle hides exports were primarily to China (213,400 pieces), South Korea (62,000 pieces), Mexico (32,900 pieces), and Thailand (20,100 pieces).
Net sales of 62,900 wet blues for 2021 were down 46 percent from the previous week and 54 percent from the prior 4-week average. Increases primarily for Vietnam (15,300 unsplit, including decreases of 100 unsplit), Italy (12,000 grain splits), Taiwan (12,000 unsplit), China (9,800 unsplit), and Mexico (7,900 MT grain splits and 1,000 unsplit), were offset by reductions for Italy (1,700 unsplit). Exports of 191,700 wet blues were up 76 percent from the previous week and 46 percent from the prior 4-week average. The destinations were primarily to Vietnam (62,400 unsplit), Italy (44,300 unsplit and 3,600 grain splits), China (39,700 unsplit), Thailand (19,200 unsplit), and Mexico (11,800 grain splits and 7,300 unsplit). Net sales reductions of 2,000 splits were reported for China (1,700 pounds) and Taiwan (300 pounds). Exports of 242,700 pounds were to Vietnam (200,000 pounds) and Taiwan (42,700 pounds).
Beef: Net sales of 12,800 MT reported for 2021 were down 20 percent from the previous week and 36 percent from the prior 4-week average. Increases primarily for Japan (4,400 MT, including decreases of 600 MT), China (3,600 MT, including decreases of 100 MT), South Korea (1,700 MT, including decreases of 500 MT), Taiwan (1,200 MT, including decreases of 200 MT), and Canada (600 MT, including decreases of 200 MT), were offset by reductions for Turks and Caicos Islands (100 MT). Exports of 17,800 MT were down 16 percent from the previous week and 2 percent from the prior 4-week average. The destinations were primarily to Japan (5,300 MT), South Korea (4,900 MT), China (3,000 MT), Taiwan (1,300 MT), and Mexico (1,000 MT).
Pork: Net sales of 29,300 MT reported for 2021 were up 49 percent from the previous week and 8 percent from the prior 4-week average. Increases primarily for Mexico (19,100 MT, including decreases of 700 MT), Japan (5,300 MT, including decreases 200 MT), South Korea (2,300 MT, including decreases of 200), Canada (1,100 MT, including decreases of 600 MT), and the Dominican Republic (700 MT), were offset by reductions for China (400 MT). Exports of 38,100 MT were up 39 percent from the previous week and 4 percent from the prior 4-week average. The destinations were primarily to Mexico (15,600 MT), China (8,800 MT), Japan (4,500 MT), South Korea (2,900 MT), and Canada (1,500 MT).
Terry Reilly
Senior Commodity Analyst – Grain and Oilseeds
Futures International
One Lincoln Center
18 W 140 Butterfield Rd.
Oakbrook Terrace, Il. 60181
W: 312.604.1366
ICE IM: treilly1
Skype: fi.treilly

Trading of futures, options, swaps and other derivatives is risky and is not suitable for all persons. All of these investment products are leveraged, and you can lose more than your initial deposit. Each investment product is offered only to and from jurisdictions where solicitation and sale are lawful, and in accordance with applicable laws and regulations in such jurisdiction. The information provided here should not be relied upon as a substitute for independent research before making your investment decisions. Futures International, LLC is merely providing this information for your general information and the information does not take into account any particular individual’s investment objectives, financial situation, or needs. All investors should obtain advice based on their unique situation before making any investment decision. The contents of this communication and any attachments are for informational purposes only and under no circumstances should they be construed as an offer to buy or sell, or a solicitation to buy or sell any future, option, swap or other derivative. The sources for the information and any opinions in this communication are believed to be reliable, but Futures International, LLC does not warrant or guarantee the accuracy of such information or opinions. Futures International, LLC and its principals and employees may take positions different from any positions described in this communication. Past results are not necessarily indicative of future results.