PDF attached
USDA export sales
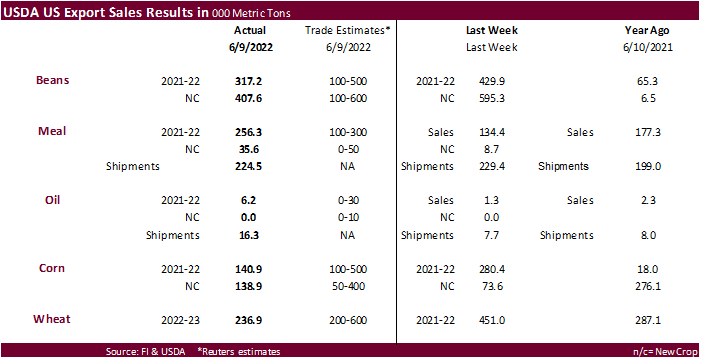
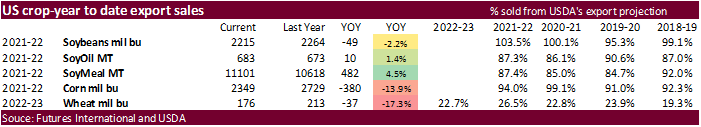
USDA export sales were within expectations for most of the major commodities. Soybean commitments are near USDA’s projection, but corn is running well below.
This summary is based on reports from exporters for the period June 3 – June 9, 2022.
Wheat: Net sales of 236,900 metric tons (MT) for 2022/2023 primarily for Brazil (78,000 MT, including 50,000 MT switched from Switzerland), Mexico (58,800 MT, including decreases of 200 MT), Ecuador (49,600 MT, including 48,000 MT switched from unknown destinations), Chile (48,000 MT), and Nigeria (34,600 MT, including 33,600 MT switched from unknown destinations), were offset by reductions primarily for unknown destinations (56,300 MT), Switzerland (50,000 MT), and Guatemala (16,900 MT). Exports of 370,100 MT were primarily to Mexico (80,400 MT), Japan (58,500 MT), Ecuador (49,600 MT), Nigeria (34,600 MT), and Chile (33,000 MT).
Corn: Net sales of 140,900 MT for 2021/2022–a marketing-year low–were down 50 percent from the previous week and 45 percent from the prior 4-week average. Increases primarily for Mexico (124,500 MT, including decreases of 36,600 MT), Japan (117,200 MT, including 112,300 MT switched from unknown destinations and decreases of 700 MT), South Korea (72,400 MT, including 68,000 MT switched from unknown destinations and decreases of 1,200 MT), the Lee Ward Windward Islands (10,100 MT, including 9,300 MT switched from unknown destinations and 700 MT switched from Barbados), and China (4,900 MT), were offset by reductions primarily for unknown destinations (189,400 MT). Net sales of 138,900 MT for 2022/2023 primarily for Mexico (77,000 MT), Japan (50,000 MT), unknown destinations (6,100 MT), and Colombia (4,000 MT), were offset by reductions for El Salvador (1,300 MT). Exports of 1,387,100 MT were unchanged from the previous week, but down 10 percent from the prior 4-week average. The destinations were primarily to Mexico (459,700 MT), China (412,900 MT), Japan (230,500 MT), South Korea (137,800 MT), and Canada (63,600 MT).
Optional Origin Sales: For 2021/2022, the current outstanding balance of 218,300 MT is for unknown destinations (175,000 MT), Italy (34,300 MT), and Saudi Arabia (9,000 MT). For 2022/2023, the current outstanding balance of 35,400 MT is for Italy.
Barley: No net sales were reported for the week. Exports of 1,000 MT were to Japan.
Sorghum: Net sales of 2,100 MT for 2021/2022 were down 79 percent from the previous week and down noticeably from the prior 4-week average. Increases reported for China (67,100 MT, including 65,000 MT switched from unknown destinations), were offset by reductions for unknown destinations (65,000 MT). Exports of 133,400 MT were down 39 percent from the previous week and 28 percent from the prior 4-week average. The destination was China.
Rice: Net sales of 78,400 MT for 2021/2022 were up noticeably from the previous week and from the prior 4-week average. Increases primarily for Mexico (24,400 MT), Haiti (22,400 MT, including decreases of 100 MT), Colombia (17,700 MT, including decreases of 100 MT), Panama (9,900 MT), and Canada (2,500 MT), were offset by reductions for Saudi Arabia (900 MT). Exports of 103,800 MT were up noticeably from the previous week and from the prior 4-week average. The destinations were primarily to Mexico (27,000 MT), Colombia (26,900 MT), Japan (12,100 MT), Panama (9,900 MT), and Nicaragua (9,500 MT).
Late reporting: For 2021/2022, exports totaling 100 MT of long grain, milled rice were reported late to Liberia.
Soybeans: Net sales of 317,200 MT for 2021/2022 were down 26 percent from the previous week and 16 percent from the prior 4-week average. Increases primarily for China (135,400 MT, including decreases of 1,600 MT), Japan (83,000 MT, including 50,000 MT switched from China, 37,500 MT switched from unknown destinations, and decreases of 9,000 MT), the Netherlands (68,500 MT, including 63,000 MT switched from unknown destinations), Mexico (58,900 MT, including 47,500 MT switched from unknown destinations and decreases of 6,000 MT), and Bangladesh (57,700 MT, including 55,000 MT switched from unknown destinations), were offset by reductions for unknown destinations (191,500 MT). Net sales of 407,600 MT for 2022/2023 were primarily for unknown destinations (196,500 MT), China (132,000 MT), Japan (50,000 MT), Colombia (14,000 MT), and Mexico (9,900 MT). Exports of 708,700 MT were up 49 percent from the previous week and 23 percent from the prior 4-week average. The destinations were primarily to Mexico (184,800 MT), Egypt (109,500 MT), Japan (93,600 MT), China (74,600 MT), and the Netherlands (68,500 MT).
Export for Own Account: For 2021/2022, exports for own account totaling 57,300 MT to Canada were applied to new or outstanding sales. The current exports for own account outstanding balance is 6,300 MT, all Canada.
Soybean Cake and Meal: Net sales of 256,300 MT for 2021/2022 were up 91 percent from the previous week and 32 percent from the prior 4-week average. Increases primarily for Colombia (65,900 MT, including decreases of 200 MT), the Philippines (47,000 MT, including decreases of 600 MT), Honduras (31,500 MT, including decreases of 35,400 MT), Japan (29,300 MT), and Nicaragua (26,200 MT), were offset by reductions primarily for Ireland (9,000 MT) and unknown destinations (5,500 MT). Net sales of 35,600 MT for 2022/2023 primarily for the Philippines (44,000 MT), were offset by reductions for Costa Rica (8,700 MT). Exports of 224,500 MT were down 2 percent from the previous week, but up 15 percent from the prior 4-week average. The destinations were primarily to Ecuador (61,800 MT), the Philippines (52,300 MT), Mexico (35,200 MT), Canada (28,800 MT), and Colombia (11,800 MT).
Soybean Oil: Net sales of 6,200 MT for 2021/2022 were up noticeably from the previous week and from the prior 4-week average. Increases reported for Venezuela (6,400 MT), were offset by reductions for Canada (200 MT). Exports of 16,300 MT were up noticeably from the previous week and from the prior 4-week average. The destinations were to Venezuela (10,900 MT), Jamaica (3,500 MT), Mexico (1,000 MT), and Canada (900 MT).
Cotton: Net sales of 26,500 RB for 2021/2022–a marketing-year low–were down 90 percent from the previous week and 86 percent from the prior 4-week average. Increases primarily for China (7,300 RB), Pakistan (4,900 RB, including decreases of 100 RB), Vietnam (4,600 RB, including 500 RB switched from South Korea), Bangladesh (3,800 RB), and Mexico (3,300 RB, including decreases of 3,300 RB), were offset by reductions for South Korea (300 RB). Net sales of 380,200 RB for 2022/2023 primarily for China (363,700 RB) and Vietnam (11,400 RB), were offset by reductions for Mexico (100 RB). Exports of 335,800 RB were unchanged from the previous week, but down 9 percent from the prior 4-week average. The destinations were primarily to China (128,700 RB), Vietnam (48,300 RB), India (29,300 RB), Pakistan (26,800 RB), and Turkey (23,100 RB). Net sales of Pima totaling 900 RB were up noticeably from the previous week, but down 50 percent from the prior 4-week average. Increases were primarily for India (300 RB) and Turkey (300 RB). Total net sales of 300 RB for 2022/2023 were reported for Turkey. Exports of 6,700 RB were down 40 percent from the previous week and 36 percent from the prior 4-week average. The destinations were primarily to India (4,000 RB), Bangladesh (900 RB), China (400 RB), Indonesia (400 RB), and Pakistan (300 RB).
Optional Origin Sales: For 2021/2022, options were exercised to export 4,100 RB to Vietnam from the United States. The current outstanding balance of 18,900 RB is for Vietnam (16,400 RB) and Pakistan (2,500 RB).
Export for Own Account: For 2021/2022, new exports for own account totaling 18,400 MT were to China (15,000 RB) and Vietnam (3,300 RB). Exports for own account totaling 100 RB to Vietnam were applied to new or outstanding sales. The current exports for own account outstanding balance of 18,300 RB is for China (15,000 RB) and Vietnam (3,300).
Hides and Skins: Net sales of 570,000 pieces for 2022 were up 67 percent from the previous week and 33 percent from the prior 4-week average. Increases were primarily for China (236,900 whole cattle hides, including decreases of 12,600 pieces), South Korea (91,700 whole cattle hides, including decreases of 3,900 pieces), Mexico (87,800 whole cattle hides, including decreases of 1,300 pieces), Thailand (42,200 whole cattle hides, including decreases of 1,100 pieces), and Indonesia (40,700 whole cattle hides). In addition, total net sales of 8,400 kip skins were reported for Belgium. Exports of 510,000 pieces were up 43 percent from the previous week and 25 percent from the prior 4-week average. Whole cattle hides exports were primarily to China (250,600 pieces), South Korea (104,200 pieces), Mexico (65,100 pieces), Thailand (39,200 pieces), and Turkey (21,400 pieces).
Net sales of 179,000 wet blues for 2022 were up 29 percent from the previous week and 5 percent from the prior 4-week average. Increases primarily for Thailand (60,700 unsplit, including decreases of 400 unsplit), Italy (44,900 unsplit, including decreases of 100 unsplit and 100 grain splits), Vietnam (41,900 unsplit), China (20,500 unsplit, including decreases of 7,000 unsplit), and Taiwan (9,600 unsplit), were offset by reductions for Brazil (3,800 unsplit). Exports of 184,500 wet blues were up 22 percent from the previous week and 31 percent from the prior 4-week average. The destinations were primarily to China (63,200 unsplit), Vietnam (40,500 unsplit), Italy (30,200 unsplit and 3,800 grain splits), Mexico (22,200 unsplit and 2,300 grain splits), and Thailand (12,100 unsplit). Net sales of 300 splits were down 99 percent from the previous week and down noticeably from the prior 4-week average. Increases reported for Vietnam (1,400 pounds) and Taiwan (1,100 pounds), were offset by reductions for China (2,200 pounds). Exports of 575,700 pounds were up noticeably from the previous week and up 20 percent from the prior 4-week average. The destinations were primarily to Vietnam (240,000 pounds) and China (168,700 pounds).
Beef: Net sales of 17,400 MT for 2022 were down 2 percent from the previous week and 12 percent from the prior 4-week average. Increases were primarily for Japan (5,200 MT, including decreases of 600 MT), China (4,600 MT, including decreases of 100 MT), South Korea (3,500 MT, including decreases of 600 MT), Mexico (1,900 MT), and the Netherlands (400 MT). Exports of 19,800 MT were up 14 percent from the previous week and 7 percent from the prior 4-week average. The destinations were primarily to Japan (5,100 MT), South Korea (5,000 MT), China (4,000 MT), Taiwan (1,100 MT), and Canada (1,000 MT).
Pork: Net sales of 27,600 MT for 2022 were up 65 percent from the previous week and 1 percent from the prior 4-week average. Increases were primarily for Mexico (14,700 MT, including decreases of 200 MT), China (3,800 MT, including decreases of 200 MT), Japan (3,700 MT, including decreases of 200 MT), Colombia (2,400 MT), and South Korea (1,700 MT, including decreases of 200 MT). Exports of 27,800 MT were up 14 percent from the previous week, but down 7 percent from the prior 4-week average. The destinations were primarily to Mexico (12,800 MT), China (3,700 MT), Japan (3,500 MT), South Korea (2,700 MT), and Colombia (1,500 MT).
U.S. EXPORT SALES FOR WEEK ENDING 6/2/2022
|
|
CURRENT MARKETING YEAR |
NEXT MARKETING YEAR |
||||||
|
COMMODITY |
NET SALES |
OUTSTANDING SALES |
WEEKLY EXPORTS |
ACCUMULATED EXPORTS |
NET SALES |
OUTSTANDING SALES |
||
|
CURRENT YEAR |
YEAR |
CURRENT YEAR |
YEAR |
|||||
|
WHEAT |
THOUSAND METRIC TONS |
|||||||
|
HRW |
99.3 |
1,160.1 |
1,606.9 |
62.8 |
62.8 |
59.6 |
0.0 |
0.0 |
|
SRW |
110.7 |
919.6 |
995.2 |
31.2 |
31.2 |
0.0 |
0.0 |
0.0 |
|
HRS |
120.3 |
1,367.0 |
1,624.1 |
60.0 |
60.0 |
21.9 |
0.0 |
0.0 |
|
WHITE |
120.7 |
835.8 |
1,114.8 |
58.0 |
58.0 |
54.7 |
0.0 |
0.0 |
|
DURUM |
0.0 |
64.4 |
35.2 |
0.0 |
0.0 |
0.0 |
0.0 |
0.0 |
|
TOTAL |
451.0 |
4,346.8 |
5,376.2 |
212.0 |
212.0 |
136.3 |
0.0 |
0.0 |
|
BARLEY |
0.0 |
13.8 |
24.7 |
0.0 |
0.0 |
0.0 |
0.0 |
0.0 |
|
CORN |
280.4 |
11,840.2 |
16,386.1 |
1,381.6 |
47,681.9 |
52,911.7 |
73.5 |
5,760.4 |
|
SORGHUM |
10.2 |
914.6 |
1,010.2 |
217.7 |
5,889.7 |
6,220.9 |
0.0 |
0.0 |
|
SOYBEANS |
429.9 |
9,883.4 |
3,807.9 |
476.5 |
50,077.1 |
57,732.9 |
595.3 |
12,697.4 |
|
SOY MEAL |
134.4 |
2,606.5 |
1,983.0 |
229.4 |
8,237.8 |
8,457.9 |
8.7 |
420.0 |
|
SOY OIL |
1.3 |
98.1 |
35.0 |
7.7 |
578.7 |
636.0 |
0.0 |
0.0 |
|
RICE |
|
|
|
|
|
|
|
|
|
L G RGH |
1.7 |
125.3 |
188.7 |
0.3 |
1,139.8 |
1,456.4 |
0.7 |
6.7 |
|
M S RGH |
0.0 |
7.5 |
16.1 |
0.0 |
13.4 |
24.8 |
0.0 |
0.0 |
|
L G BRN |
0.2 |
5.0 |
13.1 |
0.4 |
49.0 |
37.6 |
0.0 |
0.0 |
|
M&S BR |
0.0 |
9.9 |
45.2 |
0.1 |
77.6 |
111.3 |
0.0 |
0.0 |
|
L G MLD |
4.8 |
62.0 |
60.3 |
23.0 |
705.7 |
555.8 |
0.0 |
0.0 |
|
M S MLD |
0.9 |
169.6 |
180.8 |
0.8 |
350.6 |
503.9 |
0.0 |
0.0 |
|
TOTAL |
7.6 |
379.3 |
504.2 |
24.6 |
2,336.1 |
2,689.8 |
0.7 |
6.7 |
|
COTTON |
|
THOUSAND RUNNING BALES |
|
|||||
|
UPLAND |
259.2 |
5,073.4 |
2,980.6 |
335.9 |
10,438.8 |
12,854.9 |
102.9 |
3,362.8 |
|
PIMA |
0.4 |
73.8 |
145.2 |
11.1 |
403.1 |
663.4 |
0.0 |
52.8 |
|
FINAL 2021/22 MARKETING YEAR |
||||
|
COMMODITY |
NET SALES |
CARRYOVER SALES 1/ |
05/31/2022 EXPORTS |
ACCUMULATED EXPORTS |
|
WHEAT |
|
|
|
|
|
HRW |
5.9 |
308.4 |
65.9 |
7,172.4 |
|
SRW |
1.4 |
87.7 |
25.9 |
2,785.9 |
|
HRS |
-39.3 |
228.8 |
34.9 |
5,253.7 |
|
WHITE |
4.6 |
115.3 |
12.1 |
3,260.5 |
|
DURUM |
0.0 |
0.0 |
0.0 |
196.3 |
|
TOTAL |
-27.5 |
740.3 |
138.8 |
18,668.9 |
|
BARLEY |
0.0 |
5.2 |
0.0 |
15.3 |
|
|
|
|
|
|
Terry Reilly
Senior Commodity Analyst – Grain and Oilseeds
Futures International
One Lincoln Center
18 W 140 Butterfield Rd.
Oakbrook Terrace, Il. 60181
W: 312.604.1366
ICE IM: treilly1
Skype: fi.treilly

Trading of futures, options, swaps and other derivatives is risky and is not suitable for all persons. All of these investment products are leveraged, and you can lose more than your initial deposit. Each investment product is offered only to and from jurisdictions where solicitation and sale are lawful, and in accordance with applicable laws and regulations in such jurisdiction. The information provided here should not be relied upon as a substitute for independent research before making your investment decisions. Futures International, LLC is merely providing this information for your general information and the information does not take into account any particular individual’s investment objectives, financial situation, or needs. All investors should obtain advice based on their unique situation before making any investment decision. The contents of this communication and any attachments are for informational purposes only and under no circumstances should they be construed as an offer to buy or sell, or a solicitation to buy or sell any future, option, swap or other derivative. The sources for the information and any opinions in this communication are believed to be reliable, but Futures International, LLC does not warrant or guarantee the accuracy of such information or opinions. Futures International, LLC and its principals and employees may take positions different from any positions described in this communication. Past results are not necessarily indicative of future results.