PDF attached
USDA export sales
Soybean corn export sales were slow but in a range of expectations. Soybean meal and oil sales were near expectations but meal shipments were down from the previous week. SBO shipment were also up to 18,600 tons from 9,300 tons previous week. Corn export sales were near the low end of expectations while wheat was withing expectations. We see the sales report slightly supportive for SBO while other markets continue to firm from positioning ahead of the USDA report due out later.
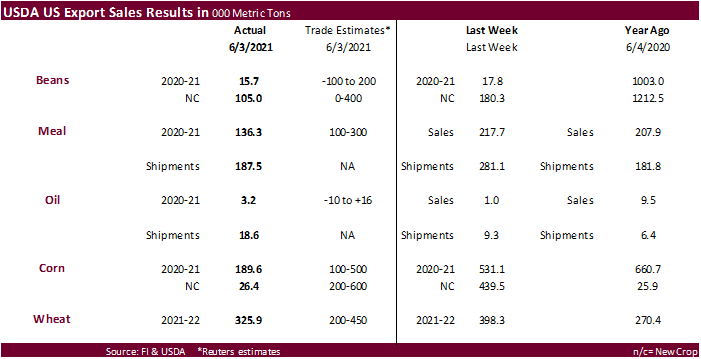
This summary is based on reports from exporters for the period May 28-June 3, 2021.
Wheat: Net sales of 325,900 MT for the 2021/2022 marketing year, which began June 1, were primarily for South Korea (80,300 MT), the Philippines (60,200 MT, including decreases of 32,900 MT), unknown destinations (45,000 MT), Honduras (39,500 MT), and Nigeria (37,300 MT). A total of 837,100 MT in sales were carried over from the 2020/2021 marketing year, which ended May 31. Exports for the period ending May 31, of 459,500 MT brought accumulated exports to 24,806,600 MT, virtually unchanged from the prior year’s total of 24,812,200 MT. The destinations were primarily to the Philippines (177,600 MT), Mexico (65,200 MT), China (63,000 MT), Nigeria (36,800 MT), and Thailand (29,900 MT). Exports for June 1- 3, totaled 136,300 MT, with Japan (34,900 MT), the Dominican Republic (26,400 MT), Thailand (24,500 MT), Mexico (22,900 MT), and the Philippines (16,600 MT) being the primary destinations.
Optional Origin Sales: For 2021/2022, new optional origin sales of 63,900 MT were reported for Spain. The current outstanding balance of 63,900 MT is for Spain.
Corn: Net sales of 189,600 MT for 2020/2021 were down 64 percent from the previous week and 39 percent from the prior 4-week average. Increases primarily for Japan (203,700 MT, including 199,900 MT switched from unknown destinations and decreases of 53,800 MT), China (66,200 MT, including decreases of 300 MT), Colombia (58,200 MT, including 50,000 MT switched from unknown destinations and decreases of 150,000 MT), Mexico (20,000 MT, including decreases of 1,300 MT), and El Salvador (19,300 MT, including 13,400 MT switched from Guatemala), were offset by reductions primarily for unknown destinations (195,700 MT). For 2021/2022, net sales of 26,400 MT were for Costa Rica (16,300 MT), unknown destinations (7,600 MT), and Taiwan (2,500 MT). Exports of 1,647,000 MT were down 23 percent from the previous week and 15 percent from the prior 4-week average. The destinations were primarily to China (542,500 MT), Mexico (368,000 MT), Japan (357,800 MT), Colombia (146,200 MT), and South Korea (116,200 MT).
Optional Origin Sales: For 2020/2021, options were exercised to export 50,000 MT to unknown destinations from the United States. The current outstanding balance of 30,500 MT is for unknown destinations. For 2021/2022, the current outstanding balance of 60,000 MT is for unknown destinations.
Barley: No net sales were reported for the 2021/2022 marketing year, which began June 1. A total of 2,600 MT in sales were carried over from the 2020/2021 marketing year, which ended May 31. Accumulated exports were 26,800 MT, down 35 percent from the prior year’s total of 41,100 MT. There were no exports for the period ending May 31 and no exports for the period ending June 1.
Sorghum: Net sales reduction of 4,200 MT for 2020/2021 resulting in increases for China (50,800 MT, including 55,000 MT switched from unknown destinations and decreases of 4,200 MT), were more than offset by reductions for unknown destinations (55,000 MT). Exports of 53,300 MT were down 77 percent from the previous week and 67 percent from the prior 4-week average. The destinations were China (53,100 MT) and South Korea (200 MT).
Rice: Net sales of 29,500 MT for 2020/2021 were up 21 percent from the previous week, but down 36 percent from the prior 4-week average. Increases primarily for Haiti (15,200 MT, including decreases of 200 MT), Mexico (6,400 MT), Honduras (5,100 MT), Canada (1,400 MT), and Belgium (400 MT), were offset by reductions for Costa Rica (100 MT). Exports of 65,400 MT were up 92 percent from the previous week and 27 percent from the prior 4-week average. The destinations were primarily to Mexico (25,200 MT), Costa Rica (17,400 MT), Haiti (15,700 MT), Japan (2,200 MT), and Canada (1,900 MT).
Exports for Own Account: For 2020/2021, the current exports for own account outstanding balance is 100 MT, all Canada.
Soybeans: Net sales of 15,700 MT for 2020/2021 were down 12 percent from the previous week and 75 percent from the prior 4-week average. Increases primarily for Indonesia (68,100 MT, including 80,000 MT switched from unknown destinations and decreases of 14,700 MT), Mexico (58,500 MT, including decreases of 1,300 MT), Malaysia (18,200 MT, including 12,000 MT switched from unknown destinations), Canada (10,100 MT), and Vietnam (3,700 MT, including decreases of 700 MT), were offset by reductions primarily for unknown destinations (86,900 MT) and Hong Kong (66,000 MT). For 2021/2022, net sales of 105,000 MT were for Hong Kong (66,000 MT), Taiwan (22,000 MT), and unknown destinations (17,000 MT). Exports of 278,700 MT were up 26 percent from the previous week, but down 2 percent from the prior 4-week average. The destinations were primarily to Indonesia (85,400 MT), Mexico (78,000 MT), Canada (22,800 MT), Colombia (21,800 MT), and Malaysia (16,900 MT).
Exports for Own Account: For 2020/2021, the current exports for own account outstanding balance is 5,800 MT, all Canada.
Soybean Cake and Meal: Net sales of 136,300 MT for 2020/2021 were down 37 percent from the previous week and 20 percent from the prior 4-week average. Increases primarily for Mexico (44,900 MT, including decreases of 5,200 MT), Canada (26,700 MT), Japan (25,200 MT, including decreases of 100 MT), Cote D’Ivoire (15,000 MT), and Costa Rica (9,600 MT, including decreases of 8,600 MT), were offset by reductions primarily for Guatemala (5,100 MT) and Colombia (1,400 MT). For 2021/2022, net sales of 3,900 MT were for Canada (2,400 MT) and Mexico (1,500 MT). Exports of 187,500 MT were down 33 percent from the previous week and 2 percent from the prior 4-week average. The destinations were primarily to the Philippines (49,800 MT), Mexico (31,400 MT), Honduras (25,300 MT), Morocco (18,000 MT), and Canada (16,400 MT).
Soybean Oil: Net sales of 3,200 MT for 2020/2021 were up noticeably from the previous week and from the prior 4-week average. Increases were for Venezuela (3,000 MT) and Mexico (100 MT). Exports of 18,600 MT were up 99 percent from the previous week and up noticeably from the prior 4-week average. The destinations were primarily to South Korea (15,000 MT), Guatemala (2,600 MT), and Mexico (600 MT).
Cotton: Net sales of 108,200 RB for 2020/2021 were down 40 percent from the previous week and 16 percent from the prior 4-week average. Increases primarily for Pakistan (47,100 RB), Vietnam (21,800 RB, including 1,900 RB switched from China, 400 RB switched from Japan, and decreases of 100 RB), China (18,800 RB, including 2,200 RB switched from Vietnam and decreases of 200 RB), Turkey (7,900 RB), and Singapore (3,400 RB), were offset by reductions for Malaysia (1,800 RB) and El Salvador (1,200 RB). For 2021/2022, net sales of 21,400 RB were for Pakistan (15,000 RB), Vietnam (3,100 RB), Malaysia (1,800 RB), Bangladesh (1,100 RB), and Japan (400 RB). Exports of 258,400 RB were down 30 percent from the previous week and 21 percent from the prior 4-week average. Exports were primarily to China (60,400 RB), Vietnam (44,700 RB), Pakistan (31,300 RB), Turkey (29,500 RB), and Mexico (23,900 RB). Net sales of Pima totaling 3,900 RB were down 47 percent from the previous week and 51 percent from the prior 4-week average. Increases were primarily for India (2,000 RB), Turkey (600 RB), Greece (400 RB), Pakistan (300 RB), and Indonesia (300 RB). Exports of 16,700 RB were up 23 percent from the previous week and 15 percent from the prior 4-week average. The destinations were primarily to China (8,100 RB), India (5,100 RB), Turkey (1,300 RB), Pakistan (1,200 RB), and Italy (300 RB).
Exports for Own Account: For 2020/2021, exports for own account totaling 2,500 RB to China (1,400 RB) and Vietnam (1,100 RB) were applied to new or outstanding sales. The current exports for own account outstanding balance of 11,100 RB is for China (6,200 RB), Vietnam (4,500 RB), and Bangladesh (400 RB).
Hides and Skins: Net sales of 469,200 pieces for 2021 were up noticeably from the previous week and up 27 percent from the prior 4-week average. Increases primarily for China (368,400 whole cattle hides, including decreases of 3,000 pieces), South Korea (33,500 whole cattle hides, including decreases of 200 pieces), Mexico (20,400 whole cattle hides, including decreases of 600 pieces), Thailand (15,000 whole cattle hides, including decreases of 400 pieces), and Indonesia (7,200 whole cattle hides), were offset by reductions for Italy (200 pieces). In addition, total net sales of 2,000 calf skins were for Italy. Exports of 353,000 pieces were down 16 percent from the previous week and 9 percent from the prior 4-week average. Whole cattle hides exports were primarily to China (233,700 pieces), South Korea (46,100 pieces), Mexico (23,600 pieces), Thailand (16,800 pieces), and Brazil (10,400 pieces).
Net sales of 116,500 wet blues for 2021 were down 57 percent from the previous week and 5 percent from the prior 4-week average. Increases primarily for China (41,500 unsplit, including decreases of 200 pieces), Italy (31,700 unsplit, including decreases of 45,600 pieces), Vietnam (28,800 unsplit), Brazil (7,600 unsplit), and Mexico (7,200 MT), were offset by reductions for Thailand (300 unsplit). Exports of 108,900 wet blues were down 48 percent from the previous week and 22 percent from the prior 4-week average. The destinations were primarily to Vietnam (33,600 unsplit), Italy (20,200 unsplit and 5,500 grain splits), China (17,500 unsplit), Thailand (16,700 unsplit), and Taiwan (4,600 unsplit and 3,500 grain splits). Net sales reductions of 900 splits resulting in increases for China (2,500 pounds), were more than offset by reductions for Vietnam (1,700 pounds) and Taiwan (1,700 pounds). Exports of 325,400 pounds were to Vietnam (198,000 pounds) and Taiwan (127,400 pounds).
Beef: Net sales of 16,100 MT reported for 2021 were up 28 percent from the previous week, but down 17 percent from the prior 4-week average. Increases primarily for Japan (4,800 MT, including decreases of 600 MT), South Korea (4,000 MT, including decreases of 500 MT), Mexico (2,500 MT), China (2,300 MT, including decreases of 100 MT), and Indonesia (1,000 MT), were offset by reductions for Honduras (100 MT). Exports of 21,100 MT–a marketing-year high–were up 70 percent from the previous week and 22 percent from the prior 4-week average. The destinations were primarily to South Korea (5,400 MT), Japan (5,200 MT), China (4,600 MT), Mexico (1,500 MT), and Canada (1,300 MT).
Pork: Net sales of 19,700 MT reported for 2021 were down 19 percent from the previous week and 24 percent from the prior 4-week average. Increases primarily for China (8,100 MT, including decreases of 700 MT), Mexico (6,400 MT, including decreases 1,500 MT), Colombia (1,600 MT), Japan (1,300 MT, including decreases of 600 MT), and South Korea (900 MT, including decreases of 300 MT), were offset by reductions for Australia (200 MT). Exports of 27,500 MT–a marketing-year low–were down 25 percent from the previous week and 32 percent from the prior 4-week average. The destinations were primarily to Mexico (10,100 MT), China (6,600 MT), Japan (3,500 MT), South Korea (2,600 MT), and Canada (1,100 MT).
June 10, 2021 1 FOREIGN AGRICULTURAL SERVICE/USDA
U.S. EXPORT SALES FOR WEEK ENDING 6/3/2021
|
|
CURRENT MARKETING YEAR |
NEXT MARKETING YEAR |
|||||||||||
|
COMMODITY |
NET SALES |
OUTSTANDING SALES |
WEEKLY EXPORTS |
ACCUMULATED EXPORTS |
NET SALES |
OUTSTANDING SALES |
|||||||
|
CURRENT YEAR |
YEAR |
CURRENT YEAR |
YEAR |
||||||||||
|
WHEAT |
THOUSAND METRIC TONS |
||||||||||||
|
HRW |
105.0 |
1,606.9 |
1,976.3 |
59.6 |
59.6 |
121.8 |
0.0 |
0.0 |
|||||
|
SRW |
82.9 |
995.2 |
529.5 |
0.0 |
0.0 |
2.1 |
0.0 |
0.0 |
|||||
|
HRS |
82.0 |
1,624.1 |
1,751.9 |
21.9 |
21.9 |
18.0 |
0.0 |
0.0 |
|||||
|
WHITE |
56.0 |
1,114.8 |
1,136.5 |
54.7 |
54.7 |
9.0 |
0.0 |
0.0 |
|||||
|
DURUM |
0.0 |
35.2 |
261.9 |
0.0 |
0.0 |
21.4 |
0.0 |
0.0 |
|||||
|
TOTAL |
325.9 |
5,376.2 |
5,656.1 |
136.3 |
136.3 |
172.4 |
0.0 |
0.0 |
|||||
|
BARLEY |
0.0 |
24.7 |
40.2 |
0.0 |
0.0 |
0.5 |
0.0 |
0.0 |
|||||
|
CORN |
189.6 |
16,386.1 |
10,880.7 |
1,647.0 |
52,911.7 |
30,252.2 |
26.4 |
15,093.8 |
|||||
|
SORGHUM |
-4.2 |
1,010.2 |
1,160.3 |
53.3 |
6,220.9 |
2,856.1 |
0.0 |
1,594.9 |
|||||
|
SOYBEANS |
15.7 |
3,807.9 |
7,442.4 |
278.7 |
57,744.6 |
35,997.8 |
105.0 |
7,555.6 |
|||||
|
SOY MEAL |
136.3 |
1,983.0 |
2,446.1 |
187.5 |
8,457.9 |
8,280.0 |
3.9 |
641.6 |
|||||
|
SOY OIL |
3.2 |
35.0 |
260.8 |
18.6 |
636.0 |
898.8 |
0.0 |
0.6 |
|||||
|
RICE |
|
|
|
|
|
|
|
|
|||||
|
L G RGH |
10.1 |
188.7 |
187.2 |
42.1 |
1,456.4 |
1,216.7 |
0.0 |
0.0 |
|||||
|
M S RGH |
0.0 |
16.1 |
36.9 |
0.0 |
24.8 |
65.3 |
0.0 |
0.0 |
|||||
|
L G BRN |
0.2 |
13.1 |
12.6 |
0.5 |
37.6 |
55.2 |
0.0 |
0.0 |
|||||
|
M&S BR |
0.1 |
45.2 |
41.4 |
0.1 |
111.3 |
77.4 |
0.0 |
0.0 |
|||||
|
L G MLD |
17.0 |
60.3 |
46.3 |
16.2 |
555.8 |
819.4 |
0.0 |
0.0 |
|||||
|
M S MLD |
2.1 |
180.8 |
163.1 |
6.5 |
503.9 |
564.1 |
0.0 |
0.0 |
|||||
|
TOTAL |
29.5 |
504.2 |
487.5 |
65.4 |
2,689.8 |
2,798.0 |
0.0 |
0.0 |
|||||
|
COTTON |
|
THOUSAND RUNNING BALES |
|
||||||||||
|
UPLAND |
108.2 |
2,980.6 |
5,115.6 |
258.4 |
12,854.9 |
11,609.7 |
21.4 |
2,041.5 |
|||||
|
PIMA |
3.9 |
145.2 |
132.2 |
16.7 |
663.4 |
428.4 |
0.0 |
4.0 |
|||||
|
FINAL 2020/21 MARKETING YEAR |
|
||||||||||||
|
COMMODITY |
NET SALES |
CARRYOVER SALES 1/ |
05/31/2021 EXPORTS |
ACCUMULATED EXPORTS |
|
||||||||
|
WHEAT |
|
|
|
|
|
||||||||
|
HRW |
-1.3 |
301.4 |
91.0 |
8,422.4 |
|
||||||||
|
SRW |
-29.6 |
50.4 |
46.6 |
1,790.3 |
|
||||||||
|
HRS |
27.4 |
289.3 |
162.7 |
7,500.1 |
|
||||||||
|
WHITE |
2.0 |
169.2 |
157.3 |
6,438.2 |
|
||||||||
|
DURUM |
0.1 |
26.8 |
1.9 |
655.7 |
|
||||||||
|
TOTAL |
-1.4 |
837.1 |
459.5 |
24,806.6 |
|
||||||||
|
BARLEY |
0.0 |
2.6 |
0.0 |
26.8 |
|
||||||||
|
|
|
|
|
|
|
||||||||
Terry Reilly
Senior Commodity Analyst – Grain and Oilseeds
Futures International
One Lincoln Center
18 W 140 Butterfield Rd.
Oakbrook Terrace, Il. 60181
W: 312.604.1366
ICE IM: treilly1
Skype: fi.treilly

Trading of futures, options, swaps and other derivatives is risky and is not suitable for all persons. All of these investment products are leveraged, and you can lose more than your initial deposit. Each investment product is offered only to and from jurisdictions where solicitation and sale are lawful, and in accordance with applicable laws and regulations in such jurisdiction. The information provided here should not be relied upon as a substitute for independent research before making your investment decisions. Futures International, LLC is merely providing this information for your general information and the information does not take into account any particular individual’s investment objectives, financial situation, or needs. All investors should obtain advice based on their unique situation before making any investment decision. The contents of this communication and any attachments are for informational purposes only and under no circumstances should they be construed as an offer to buy or sell, or a solicitation to buy or sell any future, option, swap or other derivative. The sources for the information and any opinions in this communication are believed to be reliable, but Futures International, LLC does not warrant or guarantee the accuracy of such information or opinions. Futures International, LLC and its principals and employees may take positions different from any positions described in this communication. Past results are not necessarily indicative of future results.