PDF attached
Mexico cancelled new-crop corn
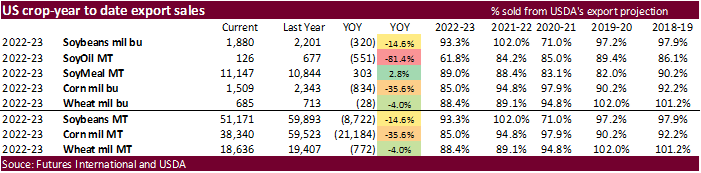
USDA export sales
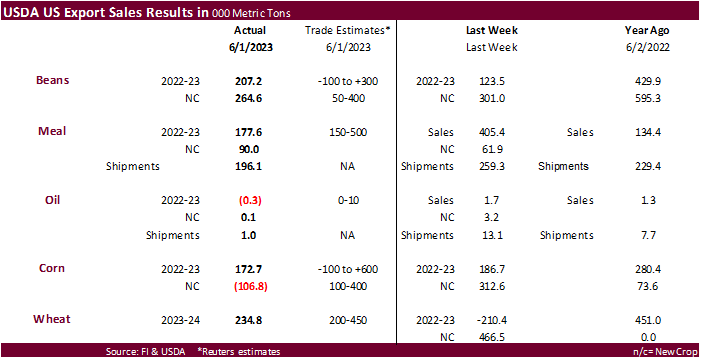
U.S. EXPORT SALES FOR WEEK ENDING 6/1/2023
|
|
CURRENT MARKETING YEAR |
NEXT MARKETING YEAR |
||||||
|
COMMODITY |
NET SALES |
OUTSTANDING SALES |
WEEKLY EXPORTS |
ACCUMULATED EXPORTS |
NET SALES |
OUTSTANDING SALES |
||
|
CURRENT YEAR |
YEAR AGO |
CURRENT YEAR |
YEAR AGO |
|||||
|
WHEAT |
THOUSAND METRIC TONS |
|||||||
|
HRW |
18.2 |
674.0 |
1,160.1 |
53.4 |
53.4 |
62.8 |
0.0 |
0.0 |
|
SRW |
56.6 |
1,076.2 |
919.6 |
26.7 |
26.7 |
31.2 |
0.0 |
0.0 |
|
HRS |
152.8 |
1,123.1 |
1,367.0 |
81.9 |
81.9 |
60.0 |
0.0 |
0.0 |
|
WHITE |
7.2 |
628.4 |
835.8 |
28.1 |
28.1 |
58.0 |
0.0 |
0.0 |
|
DURUM |
0.0 |
94.4 |
64.4 |
0.0 |
0.0 |
0.0 |
0.0 |
0.0 |
|
TOTAL |
234.8 |
3,596.1 |
4,346.8 |
190.1 |
190.1 |
212.0 |
0.0 |
0.0 |
|
BARLEY |
0.0 |
9.3 |
13.8 |
0.0 |
0.0 |
0.0 |
0.0 |
0.0 |
|
CORN |
172.7 |
6,553.3 |
11,840.2 |
1,244.7 |
31,785.5 |
47,681.9 |
-106.8 |
2,958.4 |
|
SORGHUM |
65.2 |
436.2 |
914.6 |
50.8 |
1,405.9 |
5,889.7 |
0.2 |
63.2 |
|
SOYBEANS |
207.2 |
2,792.8 |
9,883.4 |
247.6 |
48,377.8 |
50,008.7 |
264.6 |
3,117.3 |
|
SOY MEAL |
177.6 |
2,740.5 |
2,606.5 |
196.1 |
8,406.8 |
8,237.8 |
90.0 |
606.9 |
|
SOY OIL |
-0.3 |
49.2 |
98.1 |
1.0 |
77.0 |
578.7 |
0.1 |
3.9 |
|
RICE |
|
|
|
|
|
|
|
|
|
L G RGH |
1.5 |
104.2 |
125.3 |
49.0 |
623.3 |
1,139.8 |
16.0 |
22.0 |
|
M S RGH |
0.0 |
32.7 |
7.5 |
0.7 |
25.3 |
13.4 |
0.0 |
5.0 |
|
L G BRN |
0.1 |
5.5 |
5.0 |
0.5 |
18.7 |
49.0 |
0.0 |
0.0 |
|
M&S BR |
0.0 |
21.6 |
9.9 |
0.0 |
24.0 |
77.6 |
0.0 |
0.0 |
|
L G MLD |
9.1 |
94.7 |
62.0 |
19.9 |
623.5 |
705.7 |
0.0 |
40.0 |
|
M S MLD |
0.7 |
75.2 |
169.6 |
0.7 |
240.2 |
350.6 |
0.0 |
40.2 |
|
TOTAL |
11.4 |
333.9 |
379.3 |
70.8 |
1,555.0 |
2,336.1 |
16.0 |
107.2 |
|
COTTON |
|
THOUSAND RUNNING BALES |
|
|||||
|
UPLAND |
480.4 |
3,730.1 |
5,073.4 |
317.0 |
9,781.0 |
10,438.8 |
30.8 |
1,715.9 |
|
PIMA |
2.1 |
41.0 |
73.8 |
11.7 |
272.2 |
403.1 |
0.0 |
4.7 |
|
FINAL 2022/23 MARKETING YEAR |
||||
|
COMMODITY |
NET SALES |
CARRYOVER SALES 1/ |
05/31/2023 EXPORTS |
ACCUMULATED EXPORTS |
|
WHEAT |
|
|
|
|
|
HRW |
-8.6 |
236.1 |
28.7 |
4,872.4 |
|
SRW |
-0.7 |
149.8 |
19.3 |
2,694.9 |
|
HRS |
12.7 |
321.8 |
28.2 |
5,381.9 |
|
WHITE |
0.9 |
154.2 |
9.6 |
4,413.9 |
|
DURUM |
0.7 |
15.5 |
1.4 |
395.4 |
|
TOTAL |
5.0 |
877.4 |
87.3 |
17,758.5 |
|
BARLEY |
0.0 |
3.3 |
0.0 |
8.7 |
|
|
|
|
|
|
Export Sales Highlights
This summary is based on reports from exporters for the period May 26-June 1, 2023.
Wheat: Net sales of 234,800 metric tons (MT) for the 2023/2024 marketing year, which began June 1, primarily for Taiwan (56,000 MT), Colombia (40,800 MT, including decreases of 9,700 MT), Mexico (36,400 MT, including decreases of 11,400 MT), Jamaica (22,000 MT), and the Philippines (21,500 MT), were offset by reductions for the Dominican Republic (1,400 MT). A total of 877,400 MT in sales were carried over from the 2022/2023 marketing year, which ended May 31. Exports for the period ending May 31, of 87,300 MT brought accumulated exports to 17,758,500 MT, down 5 percent from the prior year’s total of 18,668,900 MT. The destinations were primarily to South Korea (35,200 MT), Thailand (18,600 MT), Colombia (17,400 MT), Mexico (14,400 MT), and Japan (700 MT). Exports for June 1 of 190,100 MT were primarily to the Philippines (71,500 MT), Mexico (44,600 MT), Venezuela (21,000 MT), Sri Lanka (19,800 MT), and Honduras (16,800 MT).
Corn: Net sales of 172,700 MT for 2022/2023 were down 8 percent from the previous week, but up noticeably from the prior 4-week average. Increases primarily for Japan (117,500 MT, including 66,200 MT switched from unknown destinations and decreases of 7,600 MT), Mexico (44,700 MT, including decreases of 59,200 MT), South Korea (32,000 MT, including 30,000 MT switched from unknown destinations and decreases of 1,700 MT), Honduras (28,500 MT, including 6,500 MT switched from Costa Rica and decreases of 37,500 MT), and El Salvador (22,600 MT, including 16,600 MT switched from Nicaragua), were offset by reductions for unknown destinations (89,600 MT), Nicaragua (16,600 MT), and Colombia (3,600 MT). Net sales reductions of 106,800 MT for 2023/2024 resulting in increases for Canada (22,000 MT) and Mexico (10,700 MT), were more than offset by reductions for Mexico (119,900 MT), Honduras (19,100 MT), and Guatemala (500 MT). Exports of 1,244,700 MT were down 13 percent from the previous week and 4 percent from the prior 4-week average. The destinations were primarily to China (403,400 MT), Mexico (276,900 MT), Japan (198,400 MT), South Korea (161,300 MT), and Honduras (43,500 MT).
Barley: No net sales were reported for the 2023/2024 marketing year, which began June 1. A total of 3,300 MT in sales were carried over from the 2022/2023 marketing year, which ended May 31. Accumulated exports were 8,700 MT, down 43 percent from the prior year’s total of 15,300 MT. There were no exports for the period ending May 31 and June 1.
Sorghum: Net sales of 65,200 MT for 2022/2023 were down 50 percent from the previous week, but up 43 percent from the prior 4-week average. Increases reported for unknown destinations (68,000 MT), were offset by reductions for China (2,800 MT). Total net sales of 200 MT for 2023/2024 were for Japan. Exports of 50,800 MT were up 39 percent from the previous week, but down 21 percent from the prior 4-week average. The destination was to China.
Rice: Net sales of 11,400 MT for 2022/2023 were down 32 percent from the previous week, but unchanged from the prior 4-week average. Increases were primarily for Saudi Arabia (8,600 MT), Honduras (1,500 MT), Canada (1,000 MT), Mexico (200 MT), and American Samoa (100 MT). Total net sales of 16,000 MT for 2023/2024 were for Honduras. Exports of 70,800 MT were up noticeably from the previous week and from the prior 4-week average. The destinations were primarily to Panama (29,600 MT), Honduras (17,100 MT), Haiti (10,000 MT), Saudi Arabia (9,200 MT), and Mexico (3,300 MT).
Soybeans: Net sales of 207,200 MT for 2022/2023 were up 68 percent from the previous week and up noticeably from the prior 4-week average. Increases primarily for Japan (97,100 MT, including 26,000 MT switched from unknown destinations and decreases of 1,000 MT), Germany (68,700 MT, including 62,000 MT switched from unknown destinations), Egypt (32,800 MT, including 31,000 MT switched from unknown destinations), South Korea (21,000 MT, including 20,000 MT switched from unknown destinations), and Canada (10,900 MT), were offset by reductions for unknown destinations (47,900 MT) and Mexico (1,400 MT). Net sales of 264,600 MT for 2023/2024 were primarily for China (131,000 MT), Mexico (60,000 MT), Taiwan (25,700 MT), Japan (20,000 MT), and Thailand (15,800 MT). Exports of 247,600 MT were up 7 percent from the previous week, but down 7 percent from the prior 4-week average. The destinations were primarily to Germany (68,700 MT), Mexico (47,900 MT), Japan (46,200 MT), Egypt (32,800 MT), and South Korea (21,200 MT).
Optional Origin Sales: For 2022/2023, the current outstanding balance of 300 MT, all South Korea.
Export for Own Account: For 2022/2023, the current exports for own account outstanding balance of 1,600 MT are for Canada (1,400 MT) and Taiwan (200 MT).
Soybean Cake and Meal: Net sales of 177,600 MT for 2022/2023 were down 56 percent from the previous week and 42 percent from the prior 4-week average. Increases primarily for Colombia (46,000 MT, including decreases of 400 MT), the Dominican Republic (36,000 MT), Israel (28,500 MT), Ecuador (20,000 MT), and El Salvador (11,800 MT, including 12,000 MT switched from Nicaragua and decreases of 200 MT), were offset by reductions for Nicaragua (8,800 MT), Belgium (1,300 MT), and Trinidad and Tobago (300 MT). Total net sales of 90,000 MT for 2023/2024 were for Ecuador. Exports of 196,100 MT were down 24 percent from the previous week and 18 percent from the prior 4-week average. The destinations were primarily to the Philippines (49,400 MT), Mexico (31,800 MT), Saudi Arabia (25,000 MT), Canada (22,300 MT), and El Salvador (11,800 MT).
Late Reporting: For 2022/2023, exports of 1,172 MT of soybean cake and meal were late to Panama.
Soybean Oil: Net sales reductions of 300 MT for 2022/2023 were down noticeably from the previous week and from the prior 4-week average. Increases for Sri Lanka (300 MT), were more than offset by reductions for Canada (500 MT) and Mexico (100 MT). Total net sales of 100 MT for 2023/2024 were for Mexico. Exports of 1,000 MT were down 93 percent from the previous week and 79 percent from the prior 4-week average. The destinations were primarily to Canada (500 MT), Sri Lanka (200 MT), and the Dominican Republic (200 MT).
Cotton: Net sales of 480,400 RB for 2022/2023–a marketing-year high–were up 79 percent from the previous week and up noticeably from the prior 4-week average. Increases primarily for China (384,700 RB), Pakistan (51,600 RB, including 900 RB switched from China and decreases of 100 RB), Turkey (18,800 RB, including 900 RB switched from South Korea and decreases of 100 RB), Bangladesh (13,300 RB), and Vietnam (6,500 RB, including 2,400 RB switched from China, 1,500 RB switched from South Korea, and decreases of 100 RB), were offset by reductions for South Korea (2,400 RB) and Guatemala (2,000 RB). Net sales of 30,800 RB for 2023/2024 were primarily for Turkey (20,700 RB), Peru (4,000 RB), Guatemala (2,700 RB), China (2,200 RB), and Indonesia (900 RB). Exports of 317,000 RB were up 12 percent from the previous week and 4 percent from the prior 4-week average. The destinations were primarily to Turkey (89,500 RB), Vietnam (75,800 RB), Pakistan (33,700 RB), China (32,700 RB), and Mexico (16,100 RB). Net sales of Pima totaling 2,100 RB for 2022/2023 were down 43 percent from the previous week and 71 percent from the prior 4-week average. Increases were primarily for Vietnam (900 RB) and India (900 RB). Exports of 11,700 RB were down 56 percent from the previous week and 35 percent from the prior 4-week average. The destinations were to India (8,200 RB), Vietnam (1,300 RB), Bangladesh (900 RB), Pakistan (900 RB), and Turkey (400 RB).
Optional Origin Sales: For 2022/2023, options were exercised to export 800 RB to Malaysia. The current outstanding balance of 300 RB, all Malaysia.
Export for Own Account: For 2022/2023, decreases of 6,500 RB were for China. The current exports for own account outstanding balance of 105,800 RB are for China (74,200 RB), Vietnam (21,500 RB), Pakistan (5,000 RB), South Korea (2,400 RB), India (1,500 RB), and Turkey (1,200 RB).
Hides and Skins: Net sales of 396,800 pieces for 2023 were down 13 percent from the previous week and 18 percent from the prior 4-week average. Increases were primarily for China (317,800 whole cattle hides, including decreases of 5,200 pieces), Mexico (48,500 whole cattle hides, including decreases of 2,300 pieces), South Korea (13,300 whole cattle hides, including decreases of 1,300 pieces), Thailand (5,000 whole cattle hides), and Turkey (5,000 whole cattle hides). Exports of 455,200 pieces were up 18 percent from the previous week and 14 percent from the prior 4-week average. Whole cattle hides exports were primarily to China (300,900 pieces), South Korea (63,400 pieces), Mexico (36,500 pieces), Brazil (32,400 pieces), and Thailand (9,500 pieces).
Net sales of 210,100 wet blues for 2023 were up noticeably from the previous week and from the prior 4-week average. Increases primarily for China (81,600 unsplit, including decreases of 200 unsplit), Hong Kong (50,000 unsplit), Italy (42,000 unsplit, including decreases of 10,500 unsplit), Taiwan (11,700 unsplit), and Vietnam (9,600 unsplit), were offset by reductions for India (200 unsplit) and Brazil (100 grain splits). Exports of 93,600 wet blues were down 33 percent from the previous week and 29 percent from the prior 4-week average. The destinations were primarily to Italy (28,800 unsplit), Vietnam (16,100 unsplit), Hong Kong (12,000 unsplit), China (11,400 unsplit), and Thailand (8,500 unsplit). Net sales of 35,600 splits reported for China (42,000 pounds), were offset by reductions for Hong Kong (3,500 pounds) and Vietnam (2,900 pounds). Exports of 73,900 pounds were to Hong Kong (37,100 pounds) and Vietnam (36,800 pounds).
Beef: Net sales of 12,800 MT for 2023 were down 29 percent from the previous week and 27 percent from the prior 4-week average. Increases primarily for Japan (3,900 MT, including decreases of 400 MT), South Korea (3,900 MT, including decreases of 400 MT), Mexico (1,900 MT), Taiwan (1,000 MT, including decreases of 200 MT), and Canada (900 MT), were offset by reductions for China (100 MT). Exports of 15,400 MT were down 3 percent from the previous week and 6 percent from the prior 4-week average. The destinations were primarily to Japan (4,000 MT), South Korea (3,700 MT), China (2,500 MT), Mexico (1,200 MT), and Canada (1,200 MT).
Pork: Net sales of 25,500 MT for 2023 were up 13 percent from the previous week, but down 11 percent from the prior 4-week average. Increases primarily for Mexico (9,100 MT, including decreases of 800 MT), China (8,100 MT, including decreases of 300 MT), Japan (3,200 MT, including decreases of 300 MT), South Korea (2,000 MT, including decreases of 800 MT), and Colombia (1,500 MT, including decreases of 100 MT), were offset by reductions for Nicaragua (500 MT), Australia (500 MT), and Taiwan (100 MT). Exports of 25,100 MT were down 26 percent from the previous week and 31 percent from the prior 4-week average. The destinations were primarily to Mexico (7,400 MT), Japan (4,000 MT), China (3,900 MT), South Korea (2,600 MT), and Canada (1,500 MT).
| Terry Reilly Senior Commodity Analyst – Grain and Oilseeds |
| Futures International One Lincoln Center 18W140 Butterfield Rd. Suite 1450 Oakbrook terrace, Il. 60181 |
| Work: 312.604.1366 ICE IM: treilly1 Skype IM: fi.treilly |
| treilly@futures-int.com
|
| DISCLAIMER: The contents of this communication and any attachments are for informational purposes only and under no circumstances should they be construed as an offer to buy or sell, or a solicitation to buy or sell any future, option, swap or other derivative. The sources for the information and any opinions in this communication are believed to be reliable, but Futures International, LLC does not warrant or guarantee the accuracy of such information or opinions. This communication may contain links to third party websites which are not under the control of FI and FI is not responsible for their content. Trading of futures, options, swaps and other derivatives is risky and is not suitable for all persons. All of these investment products are leveraged, and you can lose more than your initial deposit. Each investment product is offered only to and from jurisdictions where solicitation and sale are lawful, and in accordance with applicable laws and regulations in such jurisdiction. The information provided here should not be relied upon as a substitute for independent research before making your investment decisions. Futures International, LLC is merely providing this information for your general information and the information does not take into account any particular individual’s investment objectives, financial situation, or needs. All investors should obtain advice based on their unique situation before making any investment decision. Futures International, LLC and its principals and employees may take positions different from any positions described in this communication. Past results are not necessarily indicative of future results. |