PDF attached
No surprises. US soybean oil shipments were very good and meal commitments were at the high end of expectations. Sorghum sales were 93,300 tons and pork sales just over 17,000 tons. China posted an increase in pork sales of 3,400 tons.
U.S. EXPORT SALES FOR WEEK ENDING 5/28/2020
|
|
CURRENT MARKETING YEAR |
NEXT MARKETING YEAR |
||||||
|
COMMODITY |
NET SALES |
OUTSTANDING SALES |
WEEKLY EXPORTS |
ACCUMULATED EXPORTS |
NET SALES |
OUTSTANDING SALES |
||
|
CURRENT YEAR |
YEAR AGO |
CURRENT YEAR |
YEAR |
|||||
|
|
THOUSAND METRIC TONS |
|||||||
|
WHEAT |
|
|
|
|
|
|
|
|
|
HRW |
133.2 |
641.3 |
808.2 |
487.3 |
9,526.2 |
8,591.2 |
151.3 |
1,460.0 |
|
SRW |
3.3 |
128.8 |
128.6 |
49.8 |
2,317.8 |
3,203.5 |
38.7 |
424.4 |
|
HRS |
37.7 |
1,040.1 |
376.2 |
119.4 |
6,960.3 |
6,776.2 |
101.4 |
749.4 |
|
WHITE |
5.1 |
614.2 |
290.8 |
96.2 |
4,750.9 |
5,163.7 |
135.9 |
583.3 |
|
DURUM |
0.2 |
43.4 |
24.4 |
0.2 |
922.1 |
479.3 |
10.0 |
253.0 |
|
TOTAL |
179.5 |
2,467.8 |
1,628.1 |
752.8 |
24,477.3 |
24,214.0 |
437.3 |
3,470.2 |
|
BARLEY |
0.0 |
9.2 |
18.7 |
0.5 |
41.1 |
42.5 |
0.5 |
31.5 |
|
CORN |
637.5 |
11,461.2 |
7,867.7 |
1,346.8 |
29,014.6 |
40,370.5 |
27.5 |
3,412.5 |
|
SORGHUM |
93.3 |
1,320.9 |
465.6 |
94.7 |
2,625.9 |
1,094.7 |
0.0 |
195.0 |
|
SOYBEANS |
495.2 |
6,731.3 |
11,769.2 |
483.0 |
35,926.0 |
34,912.8 |
607.4 |
2,939.8 |
|
SOY MEAL |
558.9 |
2,419.9 |
2,735.6 |
291.5 |
8,103.2 |
8,270.2 |
25.0 |
304.9 |
|
SOY OIL |
9.4 |
257.7 |
149.8 |
75.9 |
892.4 |
606.7 |
0.0 |
11.0 |
|
RICE |
|
|
|
|
|
|
|
|
|
L G RGH |
8.3 |
251.2 |
245.6 |
23.0 |
1,240.2 |
1,066.2 |
0.0 |
0.0 |
|
M S RGH |
0.0 |
32.6 |
21.4 |
4.3 |
63.9 |
64.2 |
0.0 |
0.0 |
|
L G BRN |
0.5 |
12.6 |
3.7 |
8.3 |
55.0 |
37.3 |
0.0 |
0.0 |
|
M&S BR |
2.6 |
42.6 |
5.0 |
16.6 |
76.1 |
141.8 |
0.0 |
0.0 |
|
L G MLD |
15.5 |
46.3 |
198.1 |
17.3 |
823.3 |
721.0 |
0.0 |
0.0 |
|
M S MLD |
1.7 |
169.1 |
171.9 |
6.1 |
545.2 |
462.0 |
0.0 |
0.0 |
|
TOTAL |
28.6 |
554.4 |
645.7 |
75.6 |
2,803.8 |
2,492.5 |
0.0 |
0.0 |
|
COTTON |
|
THOUSAND RUNNING BALES |
||||||
|
UPLAND |
-10.1 |
5,010.3 |
4,804.6 |
237.9 |
11,315.4 |
10,288.6 |
12.4 |
2,834.3 |
|
PIMA |
0.5 |
143.5 |
176.3 |
2.1 |
413.8 |
534.5 |
0.0 |
33.8 |
Export Sales Highlights
This summary is based on reports from exporters for the period May 22-28, 2020.
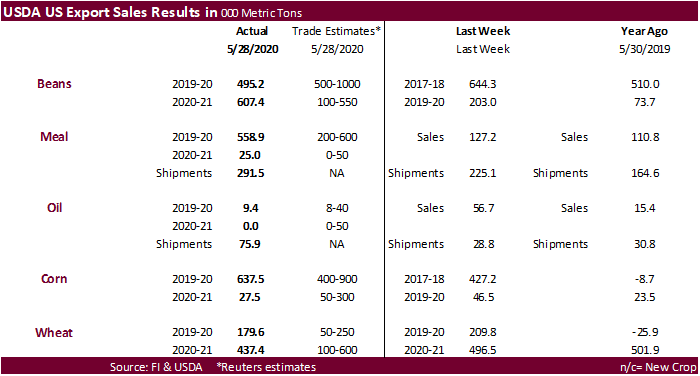
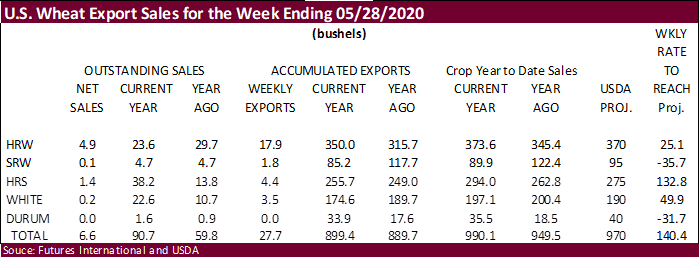
· Wheat: Net sales of 179,500 metric tons for 2019/2020 were down 14 percent from the previous week and from the prior 4-week average. Increases primarily for Ecuador (194,700 MT, late – see below), China (74,000 MT, including 65,000 MT switched from unknown destinations), Guinea-Conakry (32,000 MT, switched from unknown destinations), Nigeria (14,500 MT, including 11,000 MT switched from unknown destinations), and the Philippines (5,800 MT), were offset by reductions primarily for unknown destinations (105,000 MT) and Singapore (44,600 MT). For 2020/2021, net sales of 437,300 MT primarily for the Philippines (110,000 MT), Nigeria (83,100 MT), Yemen (70,000 MT), Japan (65,700 MT), and Brazil (55,000 MT), were offset by reductions for unknown destinations (61,600 MT) and Chile (5,000 MT). Exports of 752,800 MT–a marketing-year high–were up 34 percent from the previous week and 61 percent from the prior 4-week average. The destinations were primarily to Ecuador (194,700 MT, late – see below), China (189,000 MT), the Philippines (79,700 MT), Nigeria (49,500 MT), and Mexico (44,600 MT). Late Reporting: For 2019/2020, net sales totaling 194,700 MT were reported late. These sales were reported for Ecuador. For 2019/2020, exports totaling 194,700 MT were reported late. The destinations were to Ecuador.
· Corn: Net sales of 637,500 MT for 2019/2020 were up 49 percent from the previous week, but down 19 percent from the prior 4-week average. Increases primarily for Japan (248,900 MT, including 62,800 MT switched from unknown destinations and decreases of 49,800 MT), Colombia (214,700 MT, including 147,100 MT switched from unknown destinations, decreases of 400 MT, and late 12,000 MT – see below), South Korea (143,300 MT), Mexico (76,600 MT, including decreases of 13,000 MT), and Canada (21,600 MT, including decreases of 300 MT), were offset by reductions for unknown destinations (59,300 MT), Jamaica (54,500 MT), Guatemala (13,000 MT), and El Salvador (2,100 MT). For 2020/2021, net sales of 27,500 MT were for unknown destinations (12,000 MT), Colombia (7,000 MT), El Salvador (5,200 MT), Canada (2,400 MT), and Guatemala (900 MT). Exports of 1,346,800 MT were up 27 percent from the previous week and 7 percent from the prior 4-week average. The destinations were primarily to Japan (447,900 MT), Mexico (233,300 MT), South Korea (206,800 MT), Colombia (190,700 MT, late 12,000 MT – see below), and Guatemala (60,800 MT). Optional Origin Sales: For 2019/2020, options were exercised to export 69,000 MT to South Korea from the United States. The current outstanding balance of 643,000 MT is for South Korea (383,000 MT), Vietnam (195,000 MT), and Taiwan (65,000 MT). Late Reporting: For 2019/2020, net sales totaling 34,500 MT were reported late. These sales were reported for Panama (15,000 MT), Colombia (12,000 MT), and Venezuela (7,500 MT). For 2019/2020, exports totaling 34,500 MT were reported late. The destinations were to Panama (15,000 MT), Colombia (12,000 MT), and Venezuela (7,500 MT).
· Barley: No net sales for 2019/2020 were reported for the week. For 2020/2021, total net sales of 500 MT were for Taiwan. Exports of 500 MT were up 90 percent from the previous week and 12 percent from the prior 4-week average. The destination was Japan.
· Sorghum: Net sales of 93,300 MT for 2019/2020 were down 48 percent from the previous week, but up 19 percent from the prior 4-week average. Increases were for China (70,100 MT, including 68,000 MT switched from unknown destinations), unknown destinations (22,000 MT), and Japan (1,200 MT). Exports of 94,700 MT were down 33 percent from the previous week and 37 percent from the prior 4-week average. The destinations were primarily to China (72,900 MT) and Japan (21,200 MT).
· Rice: Net sales of 28,600 MT for 2019/2020 were up noticeably from the previous week, but down 46 percent from the prior 4-week average. Increases were primarily for Colombia (12,000 MT), Mexico (8,700 MT, including decreases of 400 MT), South Korea (2,600 MT), Canada (1,700 MT, including decreases of 100 MT), and Saudi Arabia (1,300 MT). Exports of 75,600 MT were up noticeably from the previous week and up 1 percent from the prior 4-week average. The destinations were primarily to South Korea (18,400 MT), Colombia (12,000 MT), Mexico (11,800 MT), Honduras (10,900 MT), and the United Kingdom (7,000 MT). Exports for Own Account: For 2019/2020, the current exports for own account outstanding balance is 100 MT, all Canada.
· Soybeans: Net sales of 495,200 MT for 2019/2020 were down 23 percent from the previous week and 36 percent from the prior 4-week average. Increases primarily for China (201,000 MT, including decreases of 66,000 MT), Egypt (189,400 MT, including 180,000 MT switched from unknown destinations), Indonesia (62,500 MT, including 55,000 MT switched from unknown destinations and decreases of 200 MT), Japan (42,200 MT, including 32,000 MT switched from unknown destinations and decreases of 1,900 MT), and Taiwan (39,900 MT, including decreases of 1,100 MT), were offset by reductions for unknown destinations (79,000 MT) and Panama (5,800 MT). For 2020/2021, net sales of 607,400 MT were primarily for unknown destinations (329,000 MT) and China (264,000 MT). Exports of 483,000 MT were up 46 percent from the previous week and 14 percent from the prior 4-week average. The destinations were primarily to Egypt (189,400 MT), Indonesia (73,000 MT), Japan (72,700 MT), Mexico (66,800 MT), and Vietnam (17,900 MT). Exports for Own Account: For 2019/2020, the current exports for own account outstanding balance is 2,100 MT, all Canada.
· Soybean Cake and Meal: Net sales of 558,900 MT for 2019/2020 were up noticeably from the previous week and from the prior 4-week average. Increases primarily for the Philippines (392,700 MT, including 246,000 MT switched from unknown destinations), Libya (60,000 MT), Colombia (48,500 MT, including decreases of 2,600 MT and late 32,300 MT – see below), the Dominican Republic (27,300 MT, including decreases of 100 MT), and Venezuela (19,400 MT and late 10,400 MT – see below), were offset by reductions for unknown destinations (30,000 MT), Guatemala (7,900 MT), and Australia (7,000 MT). For 2020/2021, net sales of 25,000 MT for Colombia (19,300 MT), Thailand (3,200 MT), Guatemala (2,500 MT), El Salvador (1,800 MT), and Mexico (1,400 MT), were offset by reductions for unknown destinations (3,200 MT). Exports of 291,500 MT were up 30 percent from the previous week and 34 percent from the prior 4-week average. The destinations were primarily to the Philippines (81,300 MT), Colombia (65,800 MT), Guatemala (31,400 MT), Mexico (27,900 MT), and Canada (19,400 MT). Late Reporting: For 2019/2020, net sales totaling 48,300 MT were reported late. These sales were reported for Colombia (32,300 MT), Venezuela (10,400 MT), and Panama (5,600 MT). Exports totaling 48,300 MT were reported late. The destinations were to Colombia (32,300 MT), Venezuela (10,400 MT), and Panama (5,600 MT).
· Soybean Oil: Net sales of 9,400 MT for 2019/2020 primarily for Colombia (7,000 MT), Honduras (2,200 MT), Canada (1,100 MT), Trinidad (700 MT), and Mexico (600 MT), were offset by reductions for South Korea (2,600 MT). Exports of 75,900 MT were up noticeably from the previous week and from the prior 4-week average. The destinations were to South Korea (42,400 MT), the Dominican Republic (24,000 MT), Colombia (8,200 MT), Mexico (900 MT), and Canada (300 MT).
· Cotton: Net sales reductions of 10,100 RB for 2019/2020 were down noticeably from the previous week and from the prior 4-week average. Increases for Taiwan (3,300 RB, including 900 RB switched from Bangladesh and decreases of 100 RB), Bangladesh (3,200 RB), Indonesia (1,500 RB, including 2,100 RB switched from Malaysia and decreases of 100 RB), South Korea (1,300 RB, including decreases of 200 RB), and Thailand (400 RB, including decreases of 400 RB), were offset by reductions primarily for Turkey (12,200 RB), Vietnam (4,400 RB), and Malaysia (2,100 RB). For 2020/2021, net sales of 12,400 RB for Vietnam (8,800 RB), China (5,500 RB), Turkey (4,400 RB), Pakistan (1,100 RB), and Egypt (900 RB), were offset by reductions for Honduras (6,100 RB) and Peru (2,200 RB). Exports of 237,900 RB were down 11 percent from the previous week and 16 percent from the prior 4-week average. Exports were primarily to Vietnam (84,900 RB), China (45,100 RB), Pakistan (43,900 RB), Turkey (24,000 RB), and South Korea (10,200 RB). Net sales of Pima totaling 500 RB were down 95 percent from the previous week and 85 percent from the from the prior 4-week average. Increases for Djibouti (2,200 RB, switched from China), Turkey (400 RB), and Peru (200 RB), were offset by reductions for China (2,200 RB) and India (100 RB). Exports of 2,100 RB were up 57 percent from the previous week, but down 50 percent from the prior 4-week average. The destinations were primarily to Indonesia (900 RB), Pakistan (700 RB), and India (400 RB). Exports for Own Account: For 2019/2020, the current exports for own account outstanding balance of 31,800 RB is for Vietnam (11,900 RB), China (10,700 RB), Indonesia (8,200 RB), and Bangladesh (1,000 RB).
· Hides and Skins: Net sales of 392,700 pieces for 2020 were down 9 percent from the previous week, but up 21 percent from the prior 4-week average. Increases primarily for China (348,200 whole cattle hides, including decreases of 3,500 pieces), South Korea (35,300 whole cattle hides, including decreases of 1,100 pieces), Vietnam (4,400 whole cattle hides), Mexico (3,300 whole cattle hides, including decreases of 200 pieces), and Taiwan (2,600 whole cattle hides), were offset by reductions for Indonesia (1,500 whole cattle hides). Additionally, net sales reductions were reported for Italy (300 calf skins) and Belgium (200 kip skins). Exports of 414,900 pieces reported for 2020 were down 7 percent from the previous week, but up 3 percent from the prior 4-week average. Whole cattle hides exports were primarily to China (317,000 pieces), South Korea (31,100 pieces), Mexico (20,300 pieces), Thailand (19,400 pieces), and Indonesia (10,000 pieces). In addition, there were exports to Italy (7,000 calf skins) and Belgium (1,200 kip skins).
· Net sales of 63,100 wet blues for 2020 were down 49 percent from the previous week and but up 25 percent from the prior 4-week average. Increases were reported for Vietnam (26,200 unsplit, including decreases of 100 unsplit), Italy (15,700 unsplit, including 500 unsplit), Thailand (12,700 unsplit, including decreases of 100 unsplit), China (6,100 unsplit), and the Dominican Republic (2,400 unsplit). Exports of 64,900 wet blues for 2020 were down 28 percent from the previous week and 20 percent from the prior 4-week average. The destinations were to Italy (46,400 unsplit), Thailand (8,300 unsplit), Vietnam (6,700 unsplit), Brazil (2,200 grain splits), and China (1,300 unsplit). Net sales of 617,900 splits were for Vietnam (605,600 pounds) and China (12,300 pounds). Exports of 320,300 pounds were to Vietnam.
· Beef: Net sales of 12,300 MT reported for 2020 were up 7 percent from the previous week and 97 percent from the prior 4-week average. Increases primarily for South Korea (4,300 MT, including decreases of 300 MT), Japan (4,200 MT, including decreases of 500 MT), Canada (1,500 MT), Hong Kong (700 MT, including decreases of 100 MT), and China (700 MT), were offset by reductions primarily for Chile (100 MT) and Vietnam (100 MT). Exports of 9,600 MT were down 15 percent from the previous week and 18 percent from the prior 4-week average. The destinations were primarily to Japan (3,500 MT), South Korea (2,900 MT), Hong Kong (1,000 MT), Taiwan (800 MT), and China (300 MT).
· Pork: Net sales of 17,300 MT reported for 2020 were down 16 percent from the previous week and 5 percent from the prior 4-week average. Increases were primarily for Mexico (8,500 MT, including decreases of 100 MT), China (3,400 MT, including decreases of 1,400 MT), Japan (3,100 MT, including decreases of 300 MT), Canada (800 MT, including decreases of 500 MT), and South Korea (600 MT, including decreases of 200 MT). Exports of 31,300 MT were down 9 percent from the previous week and 14 percent from the prior 4-week average. The destinations were primarily to China (13,200 MT), Mexico (7,500 MT), Japan (4,300 MT), South Korea (1,900 MT), and Canada (1,400 MT).
Terry Reilly
Senior Commodity Analyst – Grain and Oilseeds
Futures International │190 S LaSalle St., Suite 410│Chicago, IL 60603
W: 312.604.1366
AIM: fi_treilly
ICE IM: treilly1
Skype: fi.treilly

Trading of futures, options, swaps and other derivatives is risky and is not suitable for all persons. All of these investment products are leveraged, and you can lose more than your initial deposit. Each investment product is offered only to and from jurisdictions where solicitation and sale are lawful, and in accordance with applicable laws and regulations in such jurisdiction. The information provided here should not be relied upon as a substitute for independent research before making your investment decisions. Futures International, LLC is merely providing this information for your general information and the information does not take into account any particular individual’s investment objectives, financial situation, or needs. All investors should obtain advice based on their unique situation before making any investment decision. The contents of this communication and any attachments are for informational purposes only and under no circumstances should they be construed as an offer to buy or sell, or a solicitation to buy or sell any future, option, swap or other derivative. The sources for the information and any opinions in this communication are believed to be reliable, but Futures International, LLC does not warrant or guarantee the accuracy of such information or opinions. Futures International, LLC and its principals and employees may take positions different from any positions described in this communication. Past results are not necessarily indicative of future results.