PDF attached
USDA Export Sales
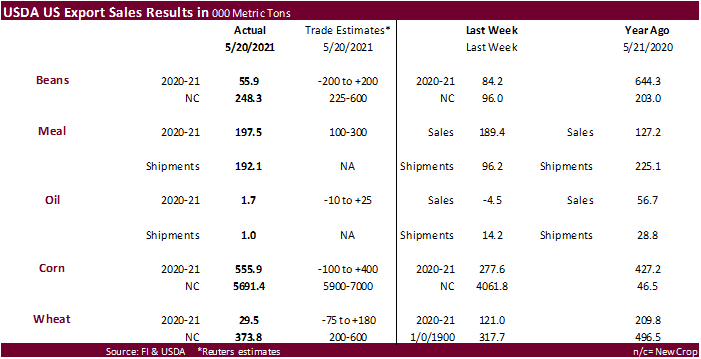
USDA reported better than expected old-crop corn export sales of 555,900 tons of corn, primarily for Mexico. China added 168,000 tons of old crop corn (66k from unknown). New crop sales were at the low end of expectations at 5.691 million tons with most for China. Sorghum sales were reductions of 81,000 tons. China cancelled 111,200 tons of sorghum. USDA reported soybean export sales at 55,900 tons old and 248,300 tons new. The new-crop sales were on the low side of expectations. Soybean meal sales were ok at 197,100 tons and SBO of 1,700 tons were poor. Shipments of meal and oil were low at 192,100 and 1,000 tons, respectively. All-wheat export sales were 29,500 tons for old crop and 373,800 tons for new-crop, lower than what we expected for new-crop. Old-crop is nearly done.
This summary is based on reports from exporters for the period May 14-May 20, 2021.
Wheat: Net sales of 29,500 metric tons (MT) for 2020/2021 were down 76 percent from the previous week and 58 percent from the prior 4-week average. Increases primarily for Canada (10,400 MT, including decreases of 2,600 MT), Burma (7,000 MT, switched from Malaysia), the Philippines (4,600 MT, including decreases of 200 MT), Indonesia (4,200 MT, including 600 MT switched from Vietnam), and Japan (2,700 MT), were offset by reductions for Malaysia (6,300 MT) and Mexico (6,100 MT). For 2021/2022, net sales of 373,800 MT primarily for Nigeria (78,000 MT), Japan (65,000 MT), the Philippines (60,000 MT), Taiwan (59,200 MT), and Vietnam (53,000 MT), were offset by reductions for unknown destinations (500 MT). Exports of 529,300 MT were down 7 percent from the previous week and 5 percent from the prior 4-week average. The destinations were primarily to Japan (92,300 MT), Mexico (85,800 MT), the Philippines (68,100 MT), China (62,900 MT), and Indonesia (57,600 MT).
Optional Origin Sales: For 2020/2021, the current outstanding balance of 63,900 MT is for Spain.
Corn: Net sales of 555,900 MT for 2020/2021 were up noticeably from the previous week and from the prior 4-week average. Increases primarily for Mexico (378,200 MT, including decreases of 2,100 MT), China (168,000 MT, including 66,000 MT switched from unknown destinations), South Korea (64,500 MT, including 65,000 MT switched from unknown destinations and decreases of 3,100 MT), Panama (23,700 MT, including 6,500 MT switched from Colombia (2,900 MT, switched from El Salvador and decreases of 8,200 MT), and Honduras (6,500 MT), were offset by reductions primarily for unknown destinations (70,500 MT). For 2021/2022, net sales of 5,691,300 MT primarily for China (5,644,000 MT), Panama (131,900 MT), Japan (50,000 MT), Costa Rica (32,000 MT), and unknown destinations (9,000 MT), were offset by reductions for Mexico (178,000 MT). Exports of 1,850,000 MT were down 17 percent from the previous week and 6 percent from the prior 4-week average. The destinations were primarily to China (847,000 MT), Mexico (379,000 MT), Colombia (200,700 MT), Japan (200,000 MT), and South Korea (61,500 MT).
Optional Origin Sales: For 2020/2021, decreases totaling 59,000 MT were reported for unknown destinations. The current outstanding balance of 209,500 MT is for unknown destinations (130,500 MT) and South Korea (79,000 MT). For 2021/2022, new optional origin sales totaling 60,000 MT were to unknown destinations. The current outstanding balance of 60,000 MT is for unknown destinations.
Barley: Total net sales of 400 MT for 2020/2021 were for South Korea. Exports of 400 MT were down 41 percent and 21 percent from the prior 4-week average. The destination was to South Korea.
Sorghum: Net sales reduction of 81,000 MT for 2020/2021–marketing-year low–resulting in increases for Eritrea (30,100 MT) and unknown destinations (100 MT), were more than offset by reductions for China (111,200 MT). For 2021/2022, net sales of 166,000 MT were for China (113,000 MT) and unknown destinations (53,000 MT). Exports of 193,500 MT were up noticeably from the previous week and up 17 percent from the prior 4-week average. The destinations were primarily to China (133,200 MT), Eritrea (30,100 MT), and unknown destinations (30,100 MT).
Rice: Net sales of 35,500 MT for 2020/2021 were down 63 percent from the previous week and 27 percent from the prior 4-week average. Increases primarily for Haiti (15,300 MT), Honduras (6,500 MT), Guatemala (2,500 MT, including decreases of 300 MT), Saudi Arabia (2,300 MT, including decreases of 200 MT), and Canada (1,900 MT), were offset by reductions for El Salvador (200 MT). Total net sales reductions for 2021/2022, of 700 MT were for Guatemala. Exports of 74,600 MT were up 8 percent from the previous week, but down 1 percent from the prior 4-week average. The destinations were primarily to Mexico (25,300 MT), Japan (14,600 MT), El Salvador (6,700 MT), Guatemala (6,500 MT), and Honduras (6,400 MT).
Exports for Own Account: For 2020/2021, the current exports for own account outstanding balance is 100 MT, all Canada.
Soybeans: Net sales of 55,900 MT for 2020/2021 were down 34 percent from the previous week and 65 percent from the prior 4-week average. Increases primarily for Indonesia (74,900 MT, including 55,000 MT switched from unknown destinations and decreases of 300 MT), Egypt (52,000 MT, switched from unknown destinations), Mexico (34,800 MT, including decreases of 200 MT), Japan (13,700 MT, including decreases of 3,500 MT), and Vietnam (13,600 MT), were offset by reductions primarily for unknown destinations (168,100 MT). For 2021/2022, net sales of 248,300 MT were primarily for Mexico (162,500 MT) and unknown destinations (45,000 MT). Exports of 294,600 MT were down 12 percent from the previous week and 4 percent from the prior 4-week average. The destinations were primarily to Indonesia (84,800 MT), Mexico (72,700 MT), Egypt (52,000 MT), Japan (32,900 MT), and Taiwan (13,200 MT).
Exports for Own Account: For 2020/2021, the current exports for own account outstanding balance is 5,800 MT, all Canada.
Soybean Cake and Meal: Net sales of 197,400 MT for 2020/2021 were up 4 percent from the previous week and 26 percent from the prior 4-week average. Increases primarily for unknown destinations (53,500 MT), the Philippines (48,600 MT), Mexico (37,600 MT, including decreases of 2,300 MT), the Dominican Republic (11,000 MT), and Sri Lanka (9,900 MT), were offset by reductions primarily for Belgium (4,300 MT) and Guatemala (2,500 MT). For 2021/2022, net sales of 76,900 MT were for Panama (46,900 MT) and Canada (30,000 MT). Exports of 192,100 MT were up noticeably from the previous week and up 13 percent from the prior 4-week average. The destinations were primarily to the Philippines (50,100 MT), Mexico (34,500 MT), Morocco (30,300 MT), Colombia (26,900 MT), and Canada (18,800 MT).
Soybean Oil: Net sales of 1,700 MT for 2020/2021 were down noticeably from the previous week, but up 14 percent from the prior 4-week average. Increases were primarily for Canada (1,400 MT, including decreases of 200 MT). Exports of 1,000 MT were down 93 percent from the previous week and 92 percent from the prior 4-week average. The destinations were to Canada (600 MT) and Mexico (400 MT).
Cotton: Net sales of 171,200 RB for 2020/2021 were up 59 percent from the previous week and up noticeably from the prior 4-week average. Increases primarily for China (42,800 RB, including 800 RB switched from Hong Kong and decreases of 1,400 RB), Pakistan (39,500 RB), Vietnam (21,900 RB, including 1,100 RB switched from Japan, 1,100 RB switched from South Korea, and decreases of 800 RB), Turkey (19,400 RB, including decreases of 2,500 RB), and Indonesia (7,600 RB, including 1,300 RB switched from Japan and decreases of 800 RB), were offset by reductions primarily for South Korea (1,100 RB) and Hong Kong (800 RB). For 2021/2022, net sales of 92,400 RB were primarily for Turkey (37,000 RB), Mexico (35,200 RB), Pakistan (6,600 RB), Thailand (6,500 RB), and South Korea (4,000 RB). Exports of 323,500 RB were down 6 percent from the previous week and 9 percent from the prior 4-week average. Exports were primarily to Vietnam (83,300 RB), China (57,900 RB), Turkey (43,800 RB), Pakistan (40,700 RB), and Indonesia (28,000 RB). Net sales of Pima totaling 12,700 RB were up 58 percent from the previous week and 81 percent from the prior 4-week average. Increases were primarily for China (7,900 RB), India (3,200 RB), and Peru (1,400 RB). Exports of 17,500 RB were up noticeably from the previous week and up 6 percent from the prior 4-week average. The destinations were primarily to India (6,500 RB), China (6,000 RB), Peru (2,600 RB), Pakistan (900 RB), and Turkey (400 RB).
Exports for Own Account: For 2020/2021, exports for own account totaling 3,800 RB to Vietnam were applied to new or outstanding sales. The current exports for own account outstanding balance of 13,600 RB is for China (7,600 RB), Vietnam (5,600 RB), and Bangladesh (400 RB).
Hides and Skins: Net sales of 624,400 pieces for 2021 were up noticeably from the previous week and from the prior 4-week average. Increases were primarily for China (484,100 whole cattle hides, including decreases of 12,700 pieces), South Korea (54,700 whole cattle hides, including decreases of 800 pieces), Thailand (39,300 whole cattle hides, including decreases of 500 pieces), Mexico (24,600 whole cattle hides, including decreases of 3,200 pieces), and Taiwan (9,800 whole cattle hides, including decreases of 200 pieces). Exports of 372,400 pieces were up 13 percent from the previous week, but down 5 percent from the prior 4-week average. Whole cattle hides exports were primarily to China (252,600 pieces), South Korea (58,700 pieces), Mexico (26,000 pieces), Thailand (14,200 pieces), and Japan (4,500 pieces).
Net sales of 104,800 wet blues for 2021 were up noticeably from the previous week, but down 12 percent from the prior 4-week average. Increases primarily for China (38,300 unsplit), Mexico (24,700 unsplit and 3,200 grain splits), Italy (20,000 unsplit), Thailand (9,800 unsplit, including decreases of 200 unsplit), and Vietnam (8,500 unsplit, including decreases of 100 pieces), were offset by reductions for China (2,300 grain splits). Exports of 67,600 wet blues were down 52 percent from the previous week and from the prior 4-week average. The destinations were primarily to Vietnam (24,300 unsplit), Italy (10,700 unsplit), Thailand (10,000 unsplit), China (9,600 unsplit), and Mexico (7,700 unsplit). Net sales of 165,900 splits were for Vietnam (120,500 pounds) and China (45,400 pounds). Exports of 120,000 pounds were to Vietnam.
Beef: Net sales of 27,900 MT reported for 2021 were up 19 percent from the previous week and 45 percent from the prior 4-week average. Increases were primarily for China (9,000 MT, including decreases of 100 MT), Japan (8,800 MT, including decreases of 500 MT), South Korea (6,000 MT, including decreases 400 MT), Indonesia (1,100 MT), and Taiwan (1,000 MT, including decreases of 100 MT). Exports of 19,400 MT were down 1 percent from the previous week, but up 4 percent from the prior 4-week average. The destinations were primarily to Japan (5,400 MT), South Korea (4,900 MT), China (3,500 MT), Taiwan (1,300 MT), and Mexico (1,300 MT).
Export Adjustments: Accumulated exports of beef to the Netherlands were adjusted down 33,589 MT for week ending May 13th. This shipment was reported in error.
Pork: Net sales of 45,900 MT reported for 2021 were up noticeably from the previous week and up 56 percent from the prior 4-week average. Increases primarily for Mexico (21,800 MT, including decreases of 700 MT), China (9,600 MT, including decreases of 400 MT), Japan (7,700 MT, including decreases of 200 MT), Canada (3,000 MT, including decreases of 400 MT), and Colombia (1,100 MT, including decreases of 100 MT), were offset by reductions for Peru (100 MT). Exports of 47,800 MT were up 38 percent from the previous week and 11 percent from the prior 4-week average. The destinations were primarily to Mexico (16,800 MT), China (13,500 MT), Japan (4,800 MT), South Korea (3,000 MT), and Canada (2,200 MT).
U.S. EXPORT SALES FOR WEEK ENDING 5/20/2021
|
|
CURRENT MARKETING YEAR |
NEXT MARKETING YEAR |
||||||
|
COMMODITY |
NET SALES |
OUTSTANDING SALES |
WEEKLY EXPORTS |
ACCUMULATED EXPORTS |
NET SALES |
OUTSTANDING SALES |
||
|
CURRENT YEAR |
YEAR |
CURRENT YEAR |
YEAR |
|||||
|
|
THOUSAND METRIC TONS |
|||||||
|
WHEAT |
|
|
|
|
|
|
|
|
|
HRW |
12.5 |
461.4 |
995.3 |
135.3 |
8,267.6 |
9,038.9 |
59.1 |
1,117.5 |
|
SRW |
-7.9 |
154.7 |
175.3 |
23.6 |
1,712.7 |
2,268.0 |
45.5 |
826.5 |
|
HRS |
19.2 |
541.5 |
1,121.8 |
162.9 |
7,229.1 |
6,840.9 |
193.2 |
1,166.7 |
|
WHITE |
3.8 |
388.2 |
705.3 |
185.5 |
6,240.7 |
4,654.7 |
76.0 |
832.0 |
|
DURUM |
2.0 |
28.6 |
43.4 |
22.0 |
653.8 |
922.0 |
0.0 |
8.4 |
|
TOTAL |
29.5 |
1,574.4 |
3,041.1 |
529.3 |
24,103.9 |
23,724.5 |
373.8 |
3,951.1 |
|
BARLEY |
0.4 |
2.2 |
9.7 |
0.4 |
26.8 |
40.6 |
0.0 |
22.2 |
|
CORN |
555.9 |
19,439.7 |
12,170.5 |
1,850.0 |
49,137.4 |
27,667.8 |
5,691.3 |
14,627.9 |
|
SORGHUM |
-81.0 |
1,306.7 |
1,322.3 |
193.5 |
5,961.3 |
2,531.1 |
166.0 |
1,410.0 |
|
SOYBEANS |
55.9 |
4,274.9 |
6,719.2 |
294.6 |
57,244.2 |
35,222.2 |
248.3 |
7,270.3 |
|
SOY MEAL |
197.4 |
2,097.7 |
2,152.6 |
192.1 |
7,989.3 |
7,811.7 |
76.9 |
637.2 |
|
SOY OIL |
1.7 |
58.8 |
324.1 |
1.0 |
608.0 |
816.6 |
0.0 |
0.6 |
|
RICE |
|
|
|
|
|
|
|
|
|
L G RGH |
8.8 |
225.5 |
266.0 |
43.7 |
1,402.8 |
1,187.2 |
-0.7 |
0.0 |
|
M S RGH |
0.0 |
16.4 |
36.9 |
0.5 |
24.5 |
59.5 |
0.0 |
0.0 |
|
L G BRN |
0.2 |
2.5 |
20.4 |
0.4 |
36.8 |
46.8 |
0.0 |
0.0 |
|
M&S BR |
0.5 |
45.4 |
56.6 |
0.5 |
110.8 |
59.6 |
0.0 |
0.0 |
|
L G MLD |
19.7 |
58.6 |
48.0 |
5.5 |
537.2 |
780.8 |
0.0 |
0.0 |
|
M S MLD |
6.3 |
201.3 |
173.5 |
24.0 |
478.2 |
539.1 |
0.0 |
0.0 |
|
TOTAL |
35.5 |
549.7 |
601.4 |
74.6 |
2,590.3 |
2,673.0 |
-0.7 |
0.0 |
|
COTTON |
|
THOUSAND RUNNING BALES |
||||||
|
UPLAND |
171.2 |
3,316.5 |
5,258.3 |
323.5 |
12,230.1 |
11,077.5 |
92.4 |
1,921.3 |
|
PIMA |
12.7 |
164.3 |
145.2 |
17.5 |
633.1 |
411.6 |
0.0 |
4.0 |
Terry Reilly
Senior Commodity Analyst – Grain and Oilseeds
Futures International
One Lincoln Center
18 W 140 Butterfield Rd.
Oakbrook Terrace, Il. 60181
W: 312.604.1366
ICE IM: treilly1
Skype: fi.treilly

Trading of futures, options, swaps and other derivatives is risky and is not suitable for all persons. All of these investment products are leveraged, and you can lose more than your initial deposit. Each investment product is offered only to and from jurisdictions where solicitation and sale are lawful, and in accordance with applicable laws and regulations in such jurisdiction. The information provided here should not be relied upon as a substitute for independent research before making your investment decisions. Futures International, LLC is merely providing this information for your general information and the information does not take into account any particular individual’s investment objectives, financial situation, or needs. All investors should obtain advice based on their unique situation before making any investment decision. The contents of this communication and any attachments are for informational purposes only and under no circumstances should they be construed as an offer to buy or sell, or a solicitation to buy or sell any future, option, swap or other derivative. The sources for the information and any opinions in this communication are believed to be reliable, but Futures International, LLC does not warrant or guarantee the accuracy of such information or opinions. Futures International, LLC and its principals and employees may take positions different from any positions described in this communication. Past results are not necessarily indicative of future results.