PDF attached
USDA Export Sales
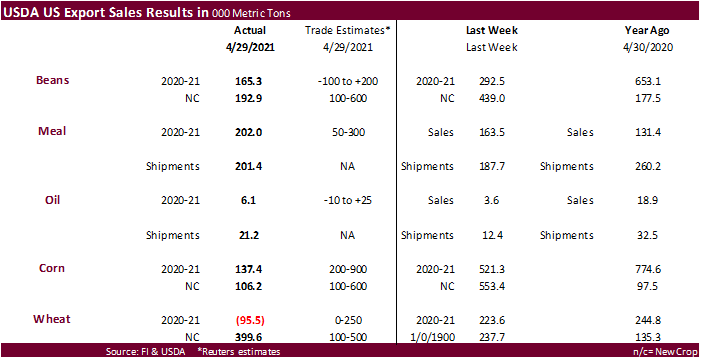
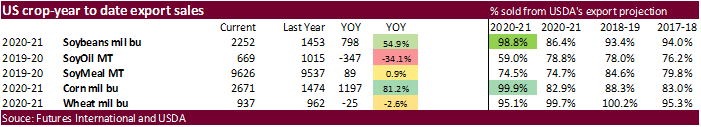
Soybean complex was within expectations while corn was poor and wheat, when combined within expectations. Sorghum sales were only 200 tons, barley 1,000 tons and pork a large 48,200 tons (China 15,000). China was very quiet for the week ending April 29. They did buy a small amount of old crop corn.
U.S. EXPORT SALES FOR WEEK ENDING 04/29/2021
FAX 202-690-3275
|
|
CURRENT MARKETING YEAR |
NEXT MARKETING YEAR |
||||||
|
COMMODITY |
NET SALES |
OUTSTANDING SALES |
WEEKLY EXPORTS |
ACCUMULATED EXPORTS |
NET SALES |
OUTSTANDING SALES |
||
|
CURRENT YEAR |
YEAR |
CURRENT YEAR |
YEAR |
|||||
|
|
THOUSAND METRIC TONS |
|||||||
|
WHEAT |
|
|
|
|
|
|
|
|
|
HRW |
-23.1 |
922.3 |
1,411.4 |
152.4 |
7,779.1 |
8,463.3 |
87.2 |
818.4 |
|
SRW |
26.2 |
235.3 |
173.4 |
45.5 |
1,600.7 |
2,225.4 |
157.9 |
706.6 |
|
HRS |
-85.5 |
909.5 |
1,243.6 |
192.6 |
6,745.7 |
6,495.7 |
93.6 |
795.1 |
|
WHITE |
-10.7 |
877.9 |
831.7 |
194.9 |
5,762.4 |
4,390.9 |
58.5 |
664.0 |
|
DURUM |
-2.4 |
69.6 |
89.8 |
0.1 |
595.0 |
851.4 |
2.4 |
7.4 |
|
TOTAL |
-95.6 |
3,014.6 |
3,749.9 |
585.6 |
22,482.9 |
22,426.7 |
399.6 |
2,991.5 |
|
BARLEY |
1.0 |
5.1 |
10.7 |
0.4 |
25.5 |
39.1 |
0.0 |
20.2 |
|
CORN |
137.4 |
24,353.6 |
13,419.4 |
2,195.1 |
43,503.3 |
24,034.2 |
106.2 |
2,791.1 |
|
SORGHUM |
0.2 |
1,634.0 |
1,483.1 |
175.9 |
5,524.2 |
2,121.6 |
55.0 |
1,191.0 |
|
SOYBEANS |
165.3 |
4,955.8 |
5,520.1 |
264.1 |
56,328.9 |
34,033.6 |
192.9 |
6,823.5 |
|
SOY MEAL |
202.0 |
2,119.2 |
2,333.7 |
201.4 |
7,506.3 |
7,203.1 |
64.7 |
450.6 |
|
SOY OIL |
6.1 |
78.1 |
304.3 |
21.2 |
590.7 |
711.0 |
0.0 |
0.6 |
|
RICE |
|
|
|
|
|
|
|
|
|
L G RGH |
11.2 |
239.1 |
293.8 |
83.4 |
1,299.3 |
1,112.9 |
0.0 |
0.0 |
|
M S RGH |
0.0 |
5.3 |
37.5 |
0.0 |
23.5 |
54.5 |
0.0 |
0.0 |
|
L G BRN |
0.4 |
2.7 |
18.7 |
0.6 |
36.0 |
44.3 |
0.0 |
0.0 |
|
M&S BR |
0.2 |
45.4 |
54.9 |
0.3 |
109.5 |
55.6 |
0.0 |
0.0 |
|
L G MLD |
13.9 |
29.5 |
81.7 |
21.8 |
523.9 |
722.1 |
0.0 |
0.0 |
|
M S MLD |
12.2 |
240.6 |
188.9 |
15.9 |
425.7 |
514.7 |
0.0 |
0.0 |
|
TOTAL |
37.9 |
562.7 |
675.6 |
122.0 |
2,418.0 |
2,504.1 |
0.0 |
0.0 |
|
COTTON |
|
THOUSAND RUNNING BALES |
||||||
|
UPLAND |
63.7 |
3,929.0 |
5,608.1 |
456.6 |
11,284.0 |
10,316.1 |
61.2 |
1,734.9 |
|
PIMA |
11.3 |
184.2 |
148.8 |
24.7 |
588.6 |
397.7 |
0.2 |
3.8 |
This summary is based on reports from exporters for the period April 23-29, 2021.
Wheat: Net sales reductions of 95,600 metric tons (MT) for 2020/2021–a marketing-year low–were down noticeably from the previous week and from the prior 4-week average. Increases primarily for Mexico (31,800 MT, including decreases of 200 MT), Haiti (27,500 MT, switched from unknown destinations), Nigeria (12,400 MT), Portugal (8,600 MT, including 9,500 MT switched from unknown destinations and decreases of 900 MT), and South Korea (4,100 MT), were more than offset by reductions primarily for unknown destinations (131,500 MT). For 2021/2022, net sales of 399,600 MT were primarily for unknown destinations (127,400 MT) and Mexico (108,900 MT). Exports of 585,600 MT were up 7 percent from the previous week and 6 percent from the prior 4-week average. The destinations were primarily to China (198,900 MT), Mexico (88,400 MT), Japan (59,200 MT), South Korea (54,100 MT), and Canada (28,700 MT).
Optional Origin Sales: For 2020/2021, new optional origin sales of 1,600 MT were reported for Spain. The current outstanding balance of 55,100 MT is for Spain.
Corn: Net sales of 137,400 MT for 2020/2021 were down 74 percent from the previous week and 72 percent from the prior 4-week average. Increases primarily for Japan (206,800 MT, including 109,600 MT switched from unknown destinations and decreases of 1,800 MT), Mexico (141,600 MT, including decreases of 9,400 MT), South Korea (121,700 MT, including 65,000 MT switched from unknown destinations and decreases of 12,800 MT), Colombia (118,600 MT, including 100,000 MT switched from unknown destinations and decreases of 37,800 MT), and China (83,100 MT, including 64,000 MT switched from unknown destinations), were offset by reductions primarily for unknown destinations (559,100 MT). For 2021/2022, net sales of 106,200 MT were reported for unknown destinations (50,800 MT), Japan (32,500 MT), and Mexico (22,900 MT). Exports of 2,195,100 MT were up 15 percent from the previous week and 19 percent from the prior 4-week average. The destinations were primarily to China (698,100 MT), Japan (448,600 MT), Mexico (293,100 MT), South Korea (255,900 MT), and Colombia (136,600 MT).
Optional Origin Sales: For 2020/2021, options were exercised to export 8,900 MT to China from other than the United States. The current outstanding balance of 268,500 MT is for unknown destinations (189,500 MT) and South Korea (79,000 MT).
Barley: Net sales of 1,000 MT for 2020/2021 were up noticeably from the previous week and from the prior 4-week average. Increases were reported for South Korea (600 MT) and Canada (400 MT). Exports of 400 MT were down 3 percent from the previous week and 17 percent from the prior 4-week average. The destinations were to South Korea (200 MT), Taiwan (100 MT), and Canada (100 MT).
Sorghum: Total net sales of 200 MT for 2020/2021 were down noticeably from the previous week and from the prior 4-week average. Increases were for China, including decreases of 6,000 MT. For 2021/2022, total net sales of 55,000 MT were for China. Exports of 175,900 MT were down 27 percent from the previous week and 54 percent from the prior 4-week average. The destination was to China.
Rice: Net sales of 37,900 MT for 2020/2021 were up 18 percent from the previous week, but down 16 percent from the prior 4-week average. Increases were primarily for Guatemala (7,500 MT), Haiti (7,200 MT), Saudi Arabia (6,700 MT), El Salvador (4,200 MT), and Israel (3,800 MT). Exports of 122,000 MT were up 49 percent from the previous week and up noticeably from the prior 4-week average. The destinations were primarily to Mexico (44,600 MT), Nicaragua (23,800 MT), Haiti (15,300 MT), El Salvador (9,200 MT), and Guatemala (7,200 MT).
Exports for Own Account: For 2020/2021, exports for own account totaling 100 MT to Canada were applied to new or outstanding sales.
Soybeans: Net sales of 165,300 MT for 2020/2021 were down 44 percent from the previous week, but up 86 percent from the prior 4-week average. Increases primarily for unknown destinations (135,500 MT), Japan (55,600 MT), Malaysia (17,600 MT, including 1,000 MT switched from Indonesia), Indonesia (11,500 MT, including decreases of 500 MT), and Colombia (1,700 MT), were offset by reductions primarily for Mexico (53,400 MT). For 2021/2022, net sales of 192,900 MT were for unknown destinations (192,000 MT) and Japan (900 MT). Exports of 264,100 MT were down 22 percent from the previous week and 20 percent from the prior 4-week average. The destinations were primarily to Mexico (95,900 MT), Malaysia (32,200 MT), Indonesia (29,500 MT), China (27,300 MT), and Costa Rica (16,700 MT).
Exports for Own Account: For 2020/2021, the current exports for own account outstanding balance is 5,800 MT, all Canada.
Soybean Cake and Meal: Net sales of 202,000 MT for 2020/2021 were up 24 percent from the previous week and 66 percent from the prior 4-week average. Increases primarily for the Philippines (83,000 MT), Mexico (44,300 MT, including decreases of 2,300 MT), the Dominican Republic (18,500 MT), Canada (16,600 MT, including decreases of 400 MT), and Morocco (12,500 MT, including decreases of 2,200 MT), were offset by reductions primarily for Jamaica (600 MT) and El Salvador (300 MT). For 2021/2022, net sales of 64,700 MT were for unknown destinations (50,000 MT) and Canada (14,700 MT). Exports of 201,400 MT were up 7 percent from the previous week, but down 5 percent from the prior 4-week average. The destinations were primarily to Mexico (40,900 MT), Ecuador (31,900 MT), Honduras (24,700 MT), Guatemala (24,100 MT), and Canada (23,400 MT).
Late Reporting: For 2020/2021, net sales and exports totaling 4,500 MT of soybean cake and meal were reported late to Venezuela.
Soybean Oil: Net sales of 6,100 MT for 2020/2021 were up 67 percent from the previous week and 3 percent from the prior 4-week average. Increases primarily for the Dominican Republic (8,000 MT), Mexico (700 MT), and Canada (300 MT), were offset by reductions for Colombia (3,000 MT). Exports of 21,200 MT were up 71 percent from the previous week and up noticeably from the prior 4-week average. The destinations were primarily to South Korea (20,000 MT), Canada (700 MT), and Mexico (400 MT).
Cotton: Net sales of 63,700 RB for 2020/2021 were down 17 percent from the previous week and 56 percent from the prior 4-week average. Increases primarily for Pakistan (16,200 RB), Bangladesh (15,400 RB), Indonesia (10,600 RB, including 400 RB switched from Japan), Mexico (9,000 RB), and Turkey (7,600 RB, including decreases of 2,800 RB), were offset by reductions for Vietnam (13,500 RB), China (4,000 RB), and Hong Kong (2,300 RB). For 2021/2022, net sales of 61,200 RB were primarily for Bangladesh (21,600 RB), Pakistan (15,400 RB), Thailand (10,600 RB), Honduras (4,600 RB), and Nicaragua (3,700 RB). Exports of 456,600 RB–a marketing-year high–were up 34 percent from the previous week and 35 percent from the prior 4-week average. Exports were primarily to China (155,000 RB, including 78,600 RB – late), Vietnam (84,100 RB), Pakistan (47,500 RB), Turkey (39,200 RB), and Mexico (27,100 RB). Net sales of Pima totaling 11,300 RB were up noticeably from the previous week and from the prior 4-week average. Increases were primarily for India (3,500 RB, including decreases of 100 RB), Turkey (3,500 RB), Vietnam (2,200 RB), Greece (900 RB), and El Salvador (400 RB). For 2021/2022, total net sales of 200 RB were for El Salvador. Exports of 24,700 RB were up 70 percent from the previous week and 37 percent from the prior 4-week average. The destinations were primarily to China (10,700 RB), India (5,700 RB), Peru (1,800 RB), Pakistan (1,600 RB), and Thailand (900 RB).
Exports for Own Account: For 2020/2021, new exports for own account totaling 4,900 RB were for Vietnam. The current exports for own account outstanding balance of 17,500 RB is for Vietnam (9,500 RB), China (7,600 RB), and Bangladesh (400 RB).
Late Reporting: For 2020/2021, exports totaling 78,600 RB of upland cotton were reported late to China.
Hides and Skins: Net sales of 275,700 pieces for 2021 were up 7 percent from the previous week, but down 15 percent from the prior 4-week average. Increases primarily for China (165,300 whole cattle hides, including decreases of 7,900 pieces), South Korea (46,900 whole cattle hides, including decreases of 900 pieces), Thailand (25,100 cattle hides, including decreases of 600 pieces), Brazil (20,000 whole cattle hides), and Mexico (8,000 whole cattle hides, including decreases of 1,100 pieces), were offset by reductions for Italy (2,000 pieces), Cambodia (200 pieces), and Spain (100 pieces). Exports of 358,100 pieces were down 21 percent from the previous week and 10 percent from the prior 4-week average. Whole cattle hides exports were primarily to China (238,300 pieces), South Korea (36,700 pieces), Thailand (33,700 pieces), Mexico (24,100 pieces), and Brazil (10,200 pieces). Exports of 1,400 kip skins were to China.
Net sales of 35,400 wet blues for 2021 were down 89 percent from the previous week and 73 percent from the prior 4-week average. Increases primarily for China (11,400 unsplit), Thailand (9,800 unsplit, including decreases of 200 unsplit), Vietnam (8,000 unsplit), and the Dominican Republic (6,400 unsplit), were offset by reductions for Italy (400 unsplit), Japan (100 unsplit), and Mexico (100 unsplit). Exports of 130,500 wet blues were down 14 percent from the previous week, but up 3 percent from the prior 4-week average. The destinations were primarily to Italy (38,400 unsplit and 3,200 grain splits), China (40,300 unsplit), Vietnam (27,800 unsplit), Thailand (13,600 unsplit), and Mexico (4,000 grain splits and 800 unsplit). Net sales of 99,500 splits reported for Vietnam (199,200 pounds, including decreases of 17,300 pounds) and China (117,700 pounds, including decreases of 12,500 pounds), were offset by reductions for Taiwan (217,400 pounds). Exports of 781,600 pounds were to Vietnam (487,000 pounds), China (210,000 pounds), and Taiwan (84,600 pounds).
Beef: Net sales of 16,900 MT reported for 2021 were down 28 percent from the previous week and 18 percent from the prior 4-week average. Increases were primarily for Japan (4,600 MT, including decreases of 500 MT), Mexico (3,000 MT, including decreases of 100 MT), Taiwan (2,900 MT, including decreases of 100 MT), South Korea (2,300 MT, including decreases of 500 MT), and Canada (2,100 MT, including decreases of 100 MT). For 2022, total net sales of 200 MT were for Canada. Exports of 18,500 MT were down 1 percent from the previous week and 3 percent from the prior 4-week average. The destinations were primarily to Japan (5,300 MT), South Korea (5,100 MT), China (3,200 MT), Mexico (1,500 MT), and Taiwan (900 MT).
Pork: Net sales of 48,200 MT reported for 2021 were up 36 percent from the previous week and up noticeably from the prior 4-week average. Increases primarily for Mexico (19,400 MT, including decreases of 500 MT), China (15,000 MT, including decreases of 1,000 MT), Japan (4,700 MT, including decreases of 200 MT), South Korea (3,300 MT, including decreases of 300 MT), and Canada (2,900 MT, including decreases of 400 MT), were offset by reductions for Australia (300 MT) and the Philippines (200 MT). Exports of 37,100 MT were down 37 percent from the previous week and 18 percent from the prior 4-week average. The destinations were primarily to Mexico (12,100 MT), China (10,500 MT), Japan (4,600 MT), South Korea (2,500 MT), and Canada (1,500 MT).
Terry Reilly
Senior Commodity Analyst – Grain and Oilseeds
Futures International
One Lincoln Center
18 W 140 Butterfield Rd.
Oakbrook Terrace, Il. 60181
W: 312.604.1366
ICE IM: treilly1
Skype: fi.treilly

Trading of futures, options, swaps and other derivatives is risky and is not suitable for all persons. All of these investment products are leveraged, and you can lose more than your initial deposit. Each investment product is offered only to and from jurisdictions where solicitation and sale are lawful, and in accordance with applicable laws and regulations in such jurisdiction. The information provided here should not be relied upon as a substitute for independent research before making your investment decisions. Futures International, LLC is merely providing this information for your general information and the information does not take into account any particular individual’s investment objectives, financial situation, or needs. All investors should obtain advice based on their unique situation before making any investment decision. The contents of this communication and any attachments are for informational purposes only and under no circumstances should they be construed as an offer to buy or sell, or a solicitation to buy or sell any future, option, swap or other derivative. The sources for the information and any opinions in this communication are believed to be reliable, but Futures International, LLC does not warrant or guarantee the accuracy of such information or opinions. Futures International, LLC and its principals and employees may take positions different from any positions described in this communication. Past results are not necessarily indicative of future results.