PDF attached
US GDP Annualized (Q/Q) Q1 A: 1.1% (est 1.9%; prev 2.6%)
US Core PCE (Q/Q) Q1 A: 4.9% (est 4.7%; prev 4.4%)
US Personal Consumption Q1 A: 3.7% (est 4.0%; prev 1.0%)
US GDP Price Index Q1 A: 4.0% (est 3.7%; prev 3.9%)
US Initial Jobless Claims Apr 22: 230K (est 248K; prev 254K)
US Continuing Claims Apr 22: 1858K (est 1870K; prev 1865K)
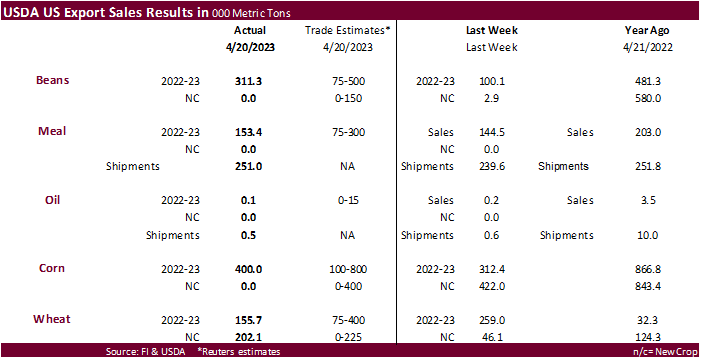
USDA export Sales were within expectations for the major commodities.
Soybean export sales of 311,300 tons were about three times the amount reported for the prior week and included Mexico, Japan and Germany. Soybean meal sales included Columbia, Venezuela, and Dominican Republic. Soybean oil sales were minimal. Corn export sales were 400,000 tons and were primarily for Mexico, Japan, and Columbia. China cancelled a corn cargo (64,300 tons). New crop all-wheat sales picked up from the previous week to 202,100 tons, high end of a range of expectations. Sorghum sales were only 1,000 tons and pork sales were a large 54,000 tons, a marketing year high, with 32,400 tons booked by Mexico.
U.S. EXPORT SALES FOR WEEK ENDING 4/20/2023
|
|
CURRENT MARKETING YEAR |
NEXT MARKETING YEAR |
||||||
|
COMMODITY |
NET SALES |
OUTSTANDING SALES |
WEEKLY EXPORTS |
ACCUMULATED EXPORTS |
NET SALES |
OUTSTANDING SALES |
||
|
CURRENT YEAR |
YEAR AGO |
CURRENT YEAR |
YEAR AGO |
|||||
|
|
THOUSAND METRIC TONS |
|||||||
|
WHEAT |
|
|
|
|
|
|
|
|
|
HRW |
22.8 |
576.0 |
1,017.8 |
68.4 |
4,480.1 |
6,472.2 |
49.4 |
173.1 |
|
SRW |
35.1 |
407.8 |
369.9 |
3.4 |
2,437.7 |
2,484.2 |
-9.5 |
475.8 |
|
HRS |
15.7 |
803.6 |
700.1 |
161.1 |
4,878.7 |
4,721.2 |
117.8 |
239.0 |
|
WHITE |
61.6 |
596.9 |
312.5 |
70.2 |
4,076.3 |
3,023.4 |
44.4 |
87.6 |
|
DURUM |
20.5 |
112.6 |
0.5 |
0.5 |
321.5 |
195.2 |
0.0 |
36.9 |
|
TOTAL |
155.7 |
2,497.0 |
2,400.8 |
303.6 |
16,194.3 |
16,896.1 |
202.1 |
1,012.3 |
|
BARLEY |
0.5 |
3.8 |
5.7 |
0.0 |
8.2 |
14.7 |
0.0 |
6.0 |
|
CORN |
400.0 |
14,780.5 |
19,383.4 |
1,076.3 |
23,671.4 |
38,132.0 |
0.0 |
2,422.4 |
|
SORGHUM |
-1.0 |
606.8 |
2,048.4 |
55.9 |
986.8 |
4,668.5 |
0.0 |
63.0 |
|
SOYBEANS |
311.3 |
3,905.4 |
10,849.1 |
453.7 |
46,721.6 |
46,728.1 |
0.0 |
1,769.8 |
|
SOY MEAL |
153.4 |
2,549.9 |
2,666.2 |
251.0 |
7,013.1 |
6,987.9 |
0.0 |
343.5 |
|
SOY OIL |
0.1 |
66.6 |
134.5 |
0.5 |
36.8 |
515.9 |
0.0 |
0.6 |
|
RICE |
|
|
|
|
|
|
|
|
|
L G RGH |
34.4 |
140.8 |
137.8 |
1.9 |
516.1 |
1,077.9 |
0.0 |
0.0 |
|
M S RGH |
0.2 |
32.8 |
9.2 |
1.1 |
22.7 |
11.8 |
0.0 |
5.0 |
|
L G BRN |
0.0 |
4.4 |
6.0 |
0.1 |
16.0 |
44.9 |
0.0 |
0.0 |
|
M&S BR |
0.0 |
21.2 |
24.1 |
14.6 |
23.6 |
63.1 |
0.0 |
0.0 |
|
L G MLD |
15.1 |
135.9 |
86.3 |
60.8 |
542.2 |
623.6 |
0.0 |
0.0 |
|
M S MLD |
1.8 |
126.6 |
223.7 |
2.0 |
202.7 |
296.6 |
0.0 |
13.0 |
|
TOTAL |
51.5 |
461.7 |
487.0 |
80.4 |
1,323.3 |
2,117.9 |
0.0 |
18.0 |
|
COTTON |
|
THOUSAND RUNNING BALES |
||||||
|
UPLAND |
194.9 |
4,186.4 |
6,325.1 |
398.4 |
7,834.7 |
8,165.9 |
19.1 |
1,456.5 |
|
PIMA |
16.7 |
94.3 |
132.3 |
20.6 |
163.6 |
331.9 |
0.0 |
4.7 |
Export Sales Highlights
This summary is based on reports from exporters for the period April 14-20, 2023.
Wheat: Net sales of 155,700 metric tons (MT) for 2022/2023 were down 40 percent from the previous week and 7 percent from the prior 4-week average. Increases primarily for Japan (119,200 MT, including decreases of 800 MT), unknown destinations (67,000 MT), Yemen (50,000 MT), Algeria (20,500 MT), and the Leeward-Windward Islands (7,000 MT, including decreases of 200 MT), were offset by reductions for the Philippines (54,100 MT), South Korea (39,300 MT), Taiwan (15,900 MT), Singapore (4,000 MT), and Barbados (100 MT). Net sales of 202,100 MT for 2023/2024 primarily for the Philippines (82,000 MT), South Korea (45,000 MT), Japan (32,700 MT), Taiwan (18,400 MT), and Honduras (15,500 MT), were offset by reductions for Mexico (5,000 MT). Exports of 303,600 MT were up 50 percent from the previous week and 23 percent from the prior 4-week average. The destinations were primarily to Japan (83,700 MT, including 35,800 MT – late), Mexico (58,000 MT), the Philippines (57,900 MT), Taiwan (50,500 MT), and South Korea (35,200 MT).
Late Reporting: For 2022/2023, exports totaling 35,805 MT of wheat were reported late. The destination was to Japan (21,631 MT hard red spring wheat and 14,174 MT white wheat).
Corn: Net sales of 400,000 MT for 2022/2023 were up 28 percent from the previous week, but down 49 percent from the prior 4-week average. Increases primarily for Japan (177,200 MT, including 111,500 MT switched from unknown destinations and decreases of 900 MT), Mexico (141,200 MT, including 26,000 MT switched from unknown destinations and decreases of 10,400 MT), Colombia (110,400 MT, including 89,700 MT switched from unknown destinations and decreases of 36,200 MT), Peru (77,500 MT, including 26,000 MT switched from unknown destinations and decreases of 400 MT), and Venezuela (13,000 MT), were offset by reductions for China (64,300 MT), unknown destinations (54,700 MT), and El Salvador (48,600 MT). Exports of 1,076,300 MT were down 17 percent from the previous week, but up 7 percent from the prior 4-week average. The destinations were primarily to Japan (342,600 MT), Mexico (256,900 MT), China (141,700 MT), Colombia (90,700 MT), and Peru (72,100 MT).
Barley: Total net sales of 500 MT for 2022/2023 were for South Korea. No exports were reported for the week.
Sorghum: Total net sales reductions of 1,000 MT for 2022/2023 were down noticeably from the previous week and from the prior 4-week average. Decreases were for China. Exports of 55,900 MT were down 5 percent from the previous week and 22 percent from the prior 4-week average. The destination was to China.
Rice: Net sales of 51,500 MT for 2022/2023 were up noticeably from the previous week and up 25 percent from the prior 4-week average. Increases primarily for Panama (29,600 MT), Haiti (8,000 MT, including decreases of 100 MT), Mexico (5,800 MT), Iraq (4,000 MT), and Saudi Arabia (2,100 MT), were offset by reductions for El Salvador (200 MT) and Guatemala (100 MT). Exports of 80,400 MT were up noticeably the previous week and from the prior 4-week average. The destinations were primarily to Iraq (44,000 MT), Haiti (14,900 MT), South Korea (14,600 MT), Mexico (3,900 MT), and Canada (1,500 MT).
Soybeans: Net sales of 311,300 MT for 2022/2023 were up noticeably from the previous week and up 38 percent from the prior 4-week average. Increases primarily for Mexico (76,200 MT, including decreases of 400 MT), Japan (75,300 MT, including 55,700 MT switched from unknown destinations and decreases of 500 MT), Germany (65,200 MT), unknown destinations (43,300 MT), and Colombia (15,900 MT, including 10,000 MT switched from unknown destinations and decreases of 8,500 MT), were offset by reductions for Canada (700 MT). Exports of 453,700 MT were down 22 percent from the previous week and 35 percent from the prior 4-week average. The destinations were primarily to China (140,600 MT), Germany (65,200 MT), Japan (62,000 MT), Mexico (53,000 MT), and Indonesia (41,400 MT).
Optional Origin Sales: For 2022/2023, the current outstanding balance of 300 MT, all South Korea.
Export for Own Account: For 2022/2023, the current exports for own account outstanding balance of 1,600 MT are for Canada (1,400 MT) and Taiwan (200 MT).
Export Adjustments: Accumulated exports of soybeans to the Netherlands were adjusted down 65,192 MT for week ending April 6th. The correct destination for this shipment is Germany.
Soybean Cake and Meal: Net sales of 153,400 MT for 2022/2023 were up 6 percent from the previous week, but down 40 percent from the prior 4-week average. Increases primarily for Colombia (40,100 MT), Venezuela (30,000 MT), the Dominican Republic (28,600 MT), the United Kingdom (15,000 MT), and Jamaica (10,700 MT), were offset by reductions for Guatemala (11,600 MT), Canada (4,200 MT), El Salvador (1,100 MT), Belgium (700 MT), and Japan (100 MT). Exports of 251,000 MT were up 5 percent from the previous week, but down 4 percent from the prior 4-week average. The destinations were primarily to the Philippines (51,000 MT), Mexico (41,500 MT), Ireland (30,900 MT), Morocco (29,700 MT), and Colombia (27,600 MT).
Soybean Oil: Total net sales of 100 MT for 2022/2023 were down 34 percent from the previous week and 98 percent from the prior 4-week average. Increases were for Canada. Exports of 500 MT were down 10 percent from the previous week and 40 percent from the prior 4-week average. The primary destination was to Canada (400 MT).
Cotton: Net sales of 194,900 RB for 2022/2023 were up noticeably from the previous week and up 21 percent from the prior 4-week average. Increases primarily for Turkey (63,300 RB, including 10,300 RB – late), China (45,200 RB, including 3,400 RB switched from Singapore and 15,800 RB – late), Vietnam (35,500 RB, including 1,000 RB switched from South Korea, 100 RB switched from Taiwan, 100 RB switched from Japan, and 15,100 RB – late), Taiwan (18,400 RB, including 13,900 RB – late), and Pakistan (11,800 RB, including decreases of 900 RB and 3,900 RB – late), were offset by reductions for Singapore (3,400 RB), South Korea (3,300 RB), and Peru (1,800 RB). Net sales of 19,100 RB for 2023/2024 were reported for South Korea (13,200 RB), Vietnam (4,400 RB), and Pakistan (1,500 RB). Exports of 398,400 RB were up 38 percent from the previous week and 31 percent from the prior 4-week average. The destinations were primarily to China (104,900 RB, including 15,800 RB – late), Vietnam (98,000 RB, including 15,100 RB – late), Turkey (59,400 RB, including 10,300 RB – late), Pakistan (26,400 RB, including 3,900 RB – late), and Taiwan (19,700 RB, including 13,900 RB – late). Net sales of Pima totaling 16,700 RB for 2022/2023 were down 34 percent from the previous week and 13 percent from the prior 4-week average. Increases were primarily for India (9,700 RB), Vietnam (3,200 RB, including 1,300 RB switched from China and 100 RB switched from Japan), China (1,500 RB), Hong Kong (1,300 RB), and Pakistan (400 RB). Exports of 20,600 RB–a marketing-year high–were up 23 percent from the previous week and up noticeably from the prior 4-week average. The destinations were primarily to China (10,200 RB), India (6,500 RB), Vietnam (1,900 RB), Pakistan (700 RB), and Turkey (300 RB).
Optional Origin Sales: For 2022/2023, the current outstanding balance of 5,800 RB, all Malaysia.
Export for Own Account: For 2022/2023, new exports for own account totaling 7,700 RB were to Vietnam (6,300 RB) and China (1,400 RB). Exports for own account totaling 3,800 RB primarily to China (2,900 RB) were applied to new or outstanding sales. The current exports for own account outstanding balance of 142,100 RB are for China (116,100 RB), Vietnam (15,900 RB), Pakistan (5,000 RB), South Korea (2,400 RB), India (1,500 RB), and Turkey (1,200 RB).
Late Reporting: For 2022/2023, net sales and exports totaling 66,103 RB of upland cotton were reported late. The destinations were China (15,840 RB), Vietnam (15,053 RB), Taiwan (13,906 RB), Turkey (10,300 RB), Pakistan (3,876 RB), Malaysia (3,785 RB), and Thailand (3,343 RB).
Hides and Skins: Net sales of 374,200 pieces for 2023 were down 8 percent from the previous week and 7 percent from the prior 4-week average. Increases primarily for China (255,100 whole cattle hides, including decreases of 21,900 pieces), South Korea (42,000 whole cattle hides, including decreases of 400 pieces), Mexico (41,900 whole cattle hides, including decreases of 4,500 pieces), Thailand (23,100 whole cattle hides), and Taiwan (9,600 whole cattle hides, including decreases of 100 pieces), were offset by reductions of Italy (300 pieces) and Indonesia (100 pieces). In addition, total net sales reductions of 2,500 kip skins were for China. Exports of 389,000 pieces were down 3 percent from the previous week and 8 percent from the prior 4-week average. Whole cattle hides exports were primarily to China (267,400 pieces), Mexico (48,100 pieces), South Korea (25,100 pieces), Brazil (12,500 pieces), and Thailand (11,900 pieces). Exports of 2,600 kip skins were to China.
Net sales of 32,300 wet blues for 2023 were down 90 percent from the previous week and 79 percent from the prior 4-week average. Increases primarily for Thailand (38,500 unsplit), Vietnam (21,500 unsplit), Mexico (8,500 unsplit and 1,800 grain splits), China (7,100 unsplit and 2,000 grain splits), and South Korea (1,800 grain splits), were offset by reductions for Italy (49,000 unsplit). Exports of 100,100 wet blues were down 27 percent from the previous week and 15 percent from the prior 4-week average. The destinations were primarily to China (27,800 unsplit), Vietnam (23,200 unsplit), Italy (22,300 unsplit), Hong Kong (15,000 unsplit), and Taiwan (4,300 unsplit). Net sales of 45,000 splits were reported for China (42,000 pounds), South Korea (2,100 pounds), and Vietnam (900 pounds). No exports of splits were reported for the week.
Beef: Net sales of 9,500 MT for 2023 were down 50 percent from the previous week and 28 percent from the prior 4-week average. Increases were primarily for Japan (2,400 MT, including decreases of 400 MT), South Korea (2,200 MT, including decreases of 400 MT), Canada (1,600 MT, including decreases of 100 MT), Mexico (500 MT), and China (500 MT, including decreases of 1,300 MT). Exports of 16,000 MT were unchanged from the previous week, but down 3 percent from the prior 4-week average. The destinations were primarily to South Korea (4,100 MT), Japan (3,700 MT), China (3,000 MT), Mexico (1,300 MT), and Taiwan (1,300 MT).
Pork: Net sales of 54,000 MT for 2023–a marketing-year high–were up 50 percent from the previous week and 47 percent from the prior 4-week average. Increases primarily for Mexico (32,400 MT, including decreases of 300 MT), Japan (6,400 MT, including decreases of 3,100 MT), Canada (4,700 MT, including decreases of 400 MT), Colombia (3,100 MT), and China (1,700 MT, including decreases of 300 MT), were offset by reductions for Malaysia (100 MT) and Nicaragua (100 MT). Exports of 38,000 MT–a marketing-year high–were up 11 percent from the previous week and 12 percent from the prior 4-week average. The destinations were primarily to Mexico (14,600 MT), China (6,000 MT), South Korea (4,700 MT), Japan (4,100 MT), and Canada (1,500 MT).
| Terry Reilly Senior Commodity Analyst – Grain and Oilseeds |
| Futures International One Lincoln Center 18W140 Butterfield Rd. Suite 1450 Oakbrook terrace, Il. 60181 |
| Work: 312.604.1366 ICE IM: treilly1 Skype IM: fi.treilly |
| treilly@futures-int.com
|
| DISCLAIMER: The contents of this communication and any attachments are for informational purposes only and under no circumstances should they be construed as an offer to buy or sell, or a solicitation to buy or sell any future, option, swap or other derivative. The sources for the information and any opinions in this communication are believed to be reliable, but Futures International, LLC does not warrant or guarantee the accuracy of such information or opinions. This communication may contain links to third party websites which are not under the control of FI and FI is not responsible for their content. Trading of futures, options, swaps and other derivatives is risky and is not suitable for all persons. All of these investment products are leveraged, and you can lose more than your initial deposit. Each investment product is offered only to and from jurisdictions where solicitation and sale are lawful, and in accordance with applicable laws and regulations in such jurisdiction. The information provided here should not be relied upon as a substitute for independent research before making your investment decisions. Futures International, LLC is merely providing this information for your general information and the information does not take into account any particular individual’s investment objectives, financial situation, or needs. All investors should obtain advice based on their unique situation before making any investment decision. Futures International, LLC and its principals and employees may take positions different from any positions described in this communication. Past results are not necessarily indicative of future results. |