PDF attached
USDA export sales
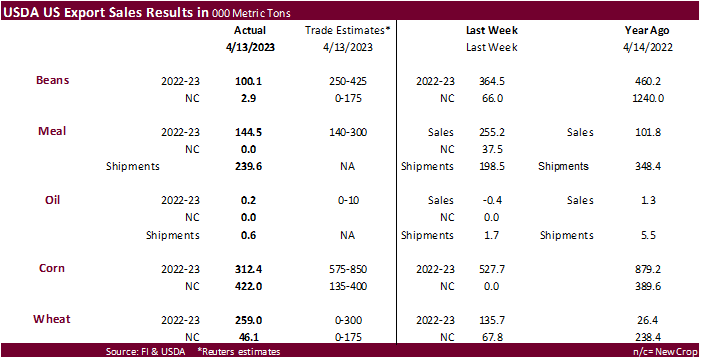
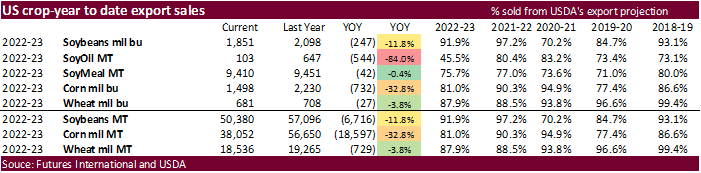
Mostly bearish. USDA export sales were poor for soybeans and soybean oil. Soybean meal sales came in at the lower end of expectations. Corn sales were withing looking at the combined old and new crop figures, and wheat was within expectations. China sales for soybeans were 35,100 tons. China bought 420,000 tons of corn (decreases of 17,400 tons) for 2022-23. New crop corn sales were 272,000 tons. Sorghum sales of 30,000 tons, all for unknown. Pork sales were 36,100 tons.
Export Sales Highlights
This summary is based on reports from exporters for the period April 7-13, 2023.
Wheat: Net sales of 259,000 metric tons (MT) for 2022/2023 were up 91 percent from the previous week and 93 percent from the prior 4-week average. Increases primarily for South Korea (83,000 MT), Taiwan (52,900 MT), the Philippines (38,000 MT), Venezuela (35,000 MT), and unknown destinations (16,900 MT), were offset by reductions for Honduras (7,000 MT), Belize (5,600 MT), and Mexico (1,100 MT). Net sales of 46,100 MT for 2023/2024 were primarily for Mexico (10,000 MT), Honduras (10,000 MT), Colombia (7,500 MT), Japan (7,000 MT), and El Salvador (6,000 MT). Exports of 202,800 MT were down 28 percent from the previous week and 29 percent from the prior 4-week average. The destinations were primarily to Mexico (59,000 MT), Thailand (56,600 MT), Panama (27,300 MT), Nigeria (26,400 MT), and Colombia (13,300 MT).
Corn: Net sales of 312,400 MT for 2022/2023 were down 41 percent from the previous week and 79 percent from the prior 4-week average. Increases primarily for China (420,000 MT, including decreases of 17,400 MT), Saudi Arabia (73,200 MT, including 70,000 MT switched from unknown destinations), Colombia (71,500 MT, including 60,300 MT switched from unknown destinations), Iraq (44,100 MT, including 42,000 MT switched from unknown destinations), and Japan (35,500 MT, including 38,500 MT switched from unknown destinations and decreases of 9,100 MT), were offset by reductions for unknown destinations (291,800 MT), Mexico (121,200 MT), El Salvador (3,700 MT), Guatemala (1,900 MT), and Costa Rica (1,800 MT). Net sales of 422,000 MT for 2023/2024 were reported for China (272,000 MT) and Mexico (150,000 MT). Exports of 1,298,500 MT were up 42 percent from the previous week and 27 percent from the prior 4-week average. The destinations were primarily to Mexico (410,800 MT), Japan (267,600 MT), Colombia (122,400 MT), Peru (104,700 MT), and China (77,800 MT).
Barley: No net sales or exports were reported for the week.
Sorghum: Total net sales of 30,000 MT for 2022/2023 were down 54 percent from the previous week, but up 89 percent from the prior 4-week average, with unknown being the destination. Exports of 59,100 MT were up 13 percent from the previous week, but down 15 percent from the prior 4-week average. The destinations were to China (58,500 MT) and Mexico (600 MT).
Rice: Net sales of 10,500 MT for 2022/2023 were down 71 percent from the previous week and 75 percent from the prior 4-week average. Increases primarily for El Salvador (6,300 MT, including 800 MT switched from Guatemala and decreases of 100 MT), Mexico (3,200 MT, including decreases of 600 MT), Jordan (800 MT), and Guam (100 MT), were offset by reductions for Guatemala (100 MT) and the Dominican Republic (100 MT). Exports of 17,300 MT were down 48 percent from the previous week and 53 percent from the prior 4-week average. The destinations were primarily to Mexico (7,900 MT), Venezuela (4,300 MT), El Salvador (2,500 MT), Canada (1,200 MT), and Jordan (800 MT).
Soybeans: Net sales of 100,100 MT for 2022/2023 were down 73 percent from the previous week and 58 percent from the prior 4-week average. Increases primarily for the Netherlands (128,300 MT, including 126,000 MT switched from unknown destinations and decreases of 1,300 MT), Mexico (45,900 MT, including decreases of 200 MT), China (35,100 MT, including decreases of 200 MT), Indonesia (28,400 MT, including decreases of 1,000 MT), and Japan (25,200 MT, including 9,000 MT switched from unknown destinations), were offset by reductions for unknown destinations (197,000 MT). Net sales of 2,900 MT for 2023/2024 were reported for Taiwan (2,000 MT) and Japan (900 MT). Exports of 582,800 MT were down 15 percent from the previous week and 20 percent from the prior 4-week average. The destinations were primarily to China (296,700 MT), the Netherlands (128,300 MT), Mexico (74,700 MT), Canada (28,100 MT), and Indonesia (21,800 MT).
Optional Origin Sales: For 2022/2023, the current outstanding balance of 300 MT, all South Korea.
Export for Own Account: For 2022/2023, the current exports for own account outstanding balance of 1,600 MT are for Canada (1,400 MT) and Taiwan (200 MT).
Soybean Cake and Meal: Net sales of 144,500 MT for 2022/2023 were down 43 percent from the previous week and 42 percent from the prior 4-week average. Increases primarily for the Philippines (46,200 MT), Tunisia (30,000 MT), Canada (20,100 MT, including decreases of 11,400 MT), Venezuela (18,000 MT), and Spain (10,500 MT switched from Poland), were offset by reductions for Poland (6,000 MT), Burma (1,400 MT), and Japan (800 MT). Exports of 239,600 MT were up 21 percent from the previous week, but down 11 percent from the prior 4-week average. The destinations were primarily to the Philippines (51,500 MT), Poland (39,000 MT), Mexico (31,700 MT), Colombia (27,500 MT), and Guatemala (25,300 MT).
Soybean Oil: Net sales of 200 MT for 2022/2023 were down noticeably from the previous week and down 98 percent from the prior 4-week average. Increases were reported for Canada (100 MT, including decreases of 100 MT) and Mexico (100 MT). Exports of 600 MT were down 65 percent from the previous week and 29 percent from the prior 4-week average. The destinations were to Canada (500 MT) and Mexico (100 MT).
Cotton: Net sales of 62,100 RB for 2022/2023 were down 57 percent from the previous week and 72 percent from the prior 4-week average. Increases primarily for Bangladesh (27,700 RB), Pakistan (18,200 RB, including decreases of 4,800 RB), China (9,500 RB, including 1,900 RB switched from Singapore and decreases of 6,600 RB), Vietnam (5,900 RB, including 1,400 RB switched from South Korea, 200 RB switched from Taiwan, and decreases of 3,100 RB), and Indonesia (4,600 RB), were offset by reductions for South Korea (9,200 RB) and Singapore (1,900 RB). Net sales of 38,000 RB for 2023/2024 were primarily for Pakistan (12,300 RB), Mexico (10,400 RB), Turkey (7,500 RB), Vietnam (3,100 RB), and Indonesia (2,200 RB). Exports of 289,800 RB were down 13 percent from the previous week and 3 percent from the prior 4-week average. The destinations were primarily to Vietnam (72,200 RB), China (64,100 RB), Turkey (51,700 RB), Pakistan (38,600 RB), and Indonesia (15,800 RB). Net sales of Pima totaling 25,200 RB for 2022/2023 were down 22 percent from the previous week, but up 48 percent from the prior 4-week average. Increases were primarily for China (10,800 RB), India (10,000 RB, including decreases of 1,700 RB), Vietnam (3,000 RB), Indonesia (700 RB), and Bangladesh (400 RB). Exports of 16,800 RB–a marketing-year high–were up 90 percent from the previous week and up noticeably from the prior 4-week average. The destinations were primarily to Vietnam (5,200 RB), India (3,500 RB), China (2,900 RB), Peru (1,300 RB), and Egypt (1,300 RB).
Optional Origin Sales: For 2022/2023, the current outstanding balance of 5,800 RB, all Malaysia.
Export for Own Account: For 2022/2023, new exports for own account totaling 5,700 RB were primarily to China (3,900 RB). Exports for own account totaling 2,200 RB reported to Vietnam were applied to new or outstanding sales. Decreases of 700 RB were to China. The current exports for own account outstanding balance of 138,200 RB are for China (117,500 RB), Vietnam (10,600 RB), Pakistan (5,000 RB), South Korea (2,400 RB), India (1,500 RB), and Turkey (1,200 RB).
Hides and Skins: Net sales of 404,700 pieces for 2023 were down 18 percent from the previous week, but up 6 percent from the prior 4-week average. Increases primarily for China (275,600 whole cattle hides, including decreases of 19,300 pieces), Mexico (42,400 whole cattle hides, including decreases of 5,600 pieces), Thailand (32,800 whole cattle hides, including decreases of 7,400 pieces), South Korea (21,400 whole cattle hides, including decreases of 22,200 pieces), and Turkey (18,000 whole cattle hides), were offset by reductions for Italy (500 pieces), Spain (100 pieces), and Brazil (100 pieces). In addition, net sales of 300 kip skins resulting in increases for Belgium (1,300 kip skins), were offset by reductions for Canada (1,000 kip skins). Exports of 400,400 pieces were down 1 percent from the previous week and 5 percent from the prior 4-week average. Whole cattle hides exports were primarily to China (273,600 pieces), Mexico (41,400 pieces), South Korea (29,200 pieces), Thailand (15,800 pieces), and Italy (13,300 pieces). Exports of 1,300 kip skins were to Canada.
Net sales of 319,400 wet blues for 2023 were up noticeably from the previous week and from the prior 4-week average. Increases were primarily for China (109,700 unsplit), Brazil (90,000 unsplit), Italy (75,800 unsplit, including decreases of 100 unsplit), Vietnam (39,700 unsplit) and Mexico (1,800 grain splits and 800 unsplit). Exports of 136,500 wet blues were up 18 percent from the previous week and 21 percent from the prior 4-week average. The destinations were primarily to China (46,100 unsplit), Italy (30,700 unsplit), Vietnam (26,800 unsplit), Thailand (11,500 unsplit), and Brazil (5,500 unsplit and 2,100 grain splits). Total net sales of 5,400 splits were for Vietnam. Exports of 74,700 pounds were to Vietnam.
Beef: Net sales of 19,100 MT for 2023 were up noticeably from the previous week and up 47 percent from the prior 4-week average. Increases were primarily for South Korea (5,500 MT, including decreases of 400 MT), Japan (4,200 MT, including decreases of 300 MT), Mexico (2,800 MT), Taiwan (2,200 MT, including decreases of 100 MT), and China (2,100 MT, including decreases of 100 MT). Exports of 16,000 MT were up 1 percent from the previous week and from the prior 4-week average. The destinations were primarily to South Korea (4,500 MT), Japan (3,700 MT), China (2,400 MT), Mexico (1,400 MT), and Taiwan (1,200 MT).
Pork: Net sales of 36,100 MT for 2023 were up 33 percent from the previous week, but down 3 percent from the prior 4-week average. Increases primarily for Mexico (13,100 MT, including decreases of 200 MT), Japan (4,600 MT, including decreases of 300 MT), Australia (4,200 MT), South Korea (3,500 MT, including decreases of 300 MT), and Colombia (3,000 MT), were offset by reductions for Nicaragua (400 MT). Exports of 34,100 MT were down 8 percent from the previous week, but up 4 percent from the prior 4-week average. The destinations were primarily to Mexico (13,600 MT), China (5,500 MT), Japan (3,500 MT), South Korea (3,300 MT), and Canada (1,400 MT).
U.S. EXPORT SALES FOR WEEK ENDING 4/13/2023
|
|
CURRENT MARKETING YEAR |
NEXT MARKETING YEAR |
||||||
|
COMMODITY |
NET SALES |
OUTSTANDING SALES |
WEEKLY EXPORTS |
ACCUMULATED EXPORTS |
NET SALES |
OUTSTANDING SALES |
||
|
CURRENT YEAR |
YEAR AGO |
CURRENT YEAR |
YEAR AGO |
|||||
|
|
THOUSAND METRIC TONS |
|||||||
|
WHEAT |
|
|
|
|
|
|
|
|
|
HRW |
63.3 |
621.6 |
1,077.2 |
37.4 |
4,411.7 |
6,415.5 |
1.8 |
123.8 |
|
SRW |
-9.0 |
376.1 |
414.6 |
69.4 |
2,434.3 |
2,437.8 |
33.5 |
485.3 |
|
HRS |
125.1 |
949.0 |
753.8 |
58.9 |
4,717.6 |
4,645.3 |
10.8 |
121.1 |
|
WHITE |
37.7 |
605.5 |
353.4 |
35.6 |
4,006.2 |
2,977.1 |
0.0 |
43.2 |
|
DURUM |
41.9 |
92.6 |
15.5 |
1.4 |
321.0 |
174.4 |
0.0 |
36.9 |
|
TOTAL |
259.0 |
2,644.8 |
2,614.5 |
202.8 |
15,890.7 |
16,650.1 |
46.1 |
810.2 |
|
BARLEY |
0.0 |
3.3 |
5.8 |
0.0 |
8.2 |
14.7 |
0.0 |
6.0 |
|
CORN |
312.4 |
15,456.8 |
20,078.7 |
1,298.5 |
22,595.1 |
36,570.0 |
422.0 |
2,422.4 |
|
SORGHUM |
30.0 |
663.8 |
2,203.9 |
59.1 |
930.8 |
4,500.6 |
0.0 |
63.0 |
|
SOYBEANS |
100.1 |
4,047.8 |
11,078.6 |
582.8 |
46,333.0 |
46,017.2 |
2.9 |
1,769.8 |
|
SOY MEAL |
144.5 |
2,647.4 |
2,715.0 |
239.6 |
6,762.1 |
6,736.1 |
0.0 |
343.5 |
|
SOY OIL |
0.2 |
67.0 |
141.0 |
0.6 |
36.3 |
505.9 |
0.0 |
0.6 |
|
RICE |
|
|
|
|
|
|
|
|
|
L G RGH |
6.7 |
108.4 |
202.0 |
12.7 |
514.2 |
1,012.7 |
0.0 |
0.0 |
|
M S RGH |
2.4 |
33.7 |
9.2 |
1.1 |
21.6 |
11.8 |
0.0 |
5.0 |
|
L G BRN |
-0.2 |
4.5 |
6.1 |
0.2 |
15.9 |
44.5 |
0.0 |
0.0 |
|
M&S BR |
0.0 |
35.7 |
23.9 |
0.0 |
9.1 |
62.7 |
0.0 |
0.0 |
|
L G MLD |
0.4 |
181.6 |
93.9 |
1.3 |
481.3 |
614.5 |
0.0 |
0.0 |
|
M S MLD |
1.2 |
126.8 |
224.4 |
2.0 |
200.7 |
282.9 |
0.0 |
13.0 |
|
TOTAL |
10.5 |
490.6 |
559.4 |
17.3 |
1,242.8 |
2,029.1 |
0.0 |
18.0 |
|
COTTON |
|
THOUSAND RUNNING BALES |
||||||
|
UPLAND |
62.1 |
4,389.9 |
6,589.9 |
289.8 |
7,436.2 |
7,779.9 |
38.0 |
1,437.4 |
|
PIMA |
25.2 |
98.2 |
123.7 |
16.8 |
143.0 |
327.6 |
0.0 |
4.7 |
| Terry Reilly Senior Commodity Analyst – Grain and Oilseeds |
| Futures International One Lincoln Center 18W140 Butterfield Rd. Suite 1450 Oakbrook terrace, Il. 60181 |
| Work: 312.604.1366 ICE IM: treilly1 Skype IM: fi.treilly |
| treilly@futures-int.com
|
| DISCLAIMER: The contents of this communication and any attachments are for informational purposes only and under no circumstances should they be construed as an offer to buy or sell, or a solicitation to buy or sell any future, option, swap or other derivative. The sources for the information and any opinions in this communication are believed to be reliable, but Futures International, LLC does not warrant or guarantee the accuracy of such information or opinions. This communication may contain links to third party websites which are not under the control of FI and FI is not responsible for their content. Trading of futures, options, swaps and other derivatives is risky and is not suitable for all persons. All of these investment products are leveraged, and you can lose more than your initial deposit. Each investment product is offered only to and from jurisdictions where solicitation and sale are lawful, and in accordance with applicable laws and regulations in such jurisdiction. The information provided here should not be relied upon as a substitute for independent research before making your investment decisions. Futures International, LLC is merely providing this information for your general information and the information does not take into account any particular individual’s investment objectives, financial situation, or needs. All investors should obtain advice based on their unique situation before making any investment decision. Futures International, LLC and its principals and employees may take positions different from any positions described in this communication. Past results are not necessarily indicative of future results. |