PDF attached
US Initial Jobless Claims Mar 18: 191K (exp 198K; prev 192K)
Continuing Claims Mar 11: 1694K (exp 1691K; prev 1684K)
US Current Account Balance (USD) Q4: -206.8B (exp -213.3B; PREV -217.7.1B)
US Chicago Fed National Activity Index Feb: -0.19 (exp 0.10; prev 0.23)
Marketing year high sales were reported for corn and soybean oil. Soybean sales were second lowest for the marketing year, for 2022-23. The corn sales oof nearly 3.1 million tons included 2.245 million tons for Canada and 683,000 tons for Japan. Soybean oil sales were mostly for Mexico. Soybean sales included many countries reshuffling their books. Soybean meal sales of 121,100 tons were below a range of expectations and shipments were 269,300 tons. All wheat sales for 2022-23 were a poor 125,600 tons. Sorghum sales were negative 3,600 tons. Pork sales were a good 38,000 tons and were primarily for Mexico and Canada.
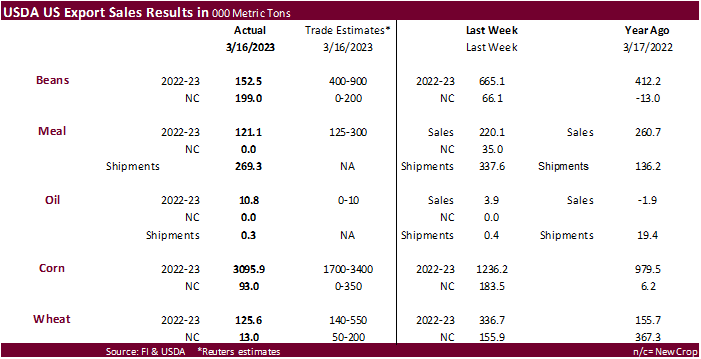
Export Sales Highlights
This summary is based on reports from exporters for the period March 10-16, 2023.
Wheat: Net sales of 125,600 metric tons (MT) for 2022/2023 were down 63 percent from the previous week and 59 percent from the prior 4-week average. Increases primarily for Mexico (74,900 MT, including decreases of 600 MT), China (73,600 MT, including 65,000 MT switched from unknown destinations), Ecuador (37,900 MT, including 34,700 MT switched from unknown destinations), Algeria (33,000 MT), and the Philippines (26,600 MT, including 23,000 MT switched from unknown destinations), were offset by reductions for unknown destinations (142,700 MT), Nigeria (25,000 MT), and Panama (100 MT). Net sales of 13,000 MT for 2023/2024 were reported for Trinidad and Tobago (8,900 MT), Ecuador (4,000 MT), and Panama (100 MT). Exports of 361,600 MT were up 44 percent from the previous week, but down 8 percent from the prior 4-week average. The destinations were primarily to China (68,300 MT), Mexico (52,600 MT), the Philippines (48,600 MT), Taiwan (47,500 MT), and Ecuador (37,900 MT).
Corn: Net sales of 3,095,900 MT for 2022/2023–a marketing-year high–were up noticeably from the previous week and from the prior 4-week average. Increases primarily for China (2,245,200 MT, including 123,000 MT switched from unknown destinations), Japan (683,000 MT, including 94,400 MT switched from unknown destinations and decreases of 122,100 MT), Mexico (224,900 MT, including decreases of 3,600 MT), Colombia (54,100 MT, including decreases of 42,200 MT), and the Dominican Republic (51,200 MT), were offset by reductions for unknown destinations (261,400 MT), Italy (35,000 MT), Guatemala (7,100 MT), and Costa Rica (3,500 MT). Net sales of 93,000 MT for 2023/2024 were reported for Mexico (80,000 MT), Japan (10,000 MT), and unknown destinations (3,000 MT). Exports of 1,381,300 MT–a marketing-year high–were up 23 percent from the previous week and 57 percent from the prior 4-week average. The destinations were primarily to Mexico (395,600 MT), Japan (304,700 MT), China (201,900 MT), Colombia (116,900 MT), and South Korea (67,600 MT).
Optional Origin Sales: For 2022/2023, the current outstanding balance of 140,000 MT were for South Korea (100,000 MT) and Egypt (40,000 MT).
Export Adjustments: Accumulated exports of corn to Colombia were adjusted down 41,145 MT for week ending March 9th. This shipment was reported in error.
Barley: No net sales or exports were reported for the week.
Sorghum: Total net sales reductions of 3,600 MT for 2022/2023–a marketing-year low–were down noticeably from the previous week and from the prior 4-week average. Decreases were for China. Exports of 49,400 MT were down 32 percent from the previous week and 34 percent from the prior 4-week average. The destination was to China.
Rice: Net sales of 14,900 MT for 2022/2023 were down 42 percent from the previous week and 73 percent from the prior 4-week average. Increases were primarily for Guatemala (6,200 MT), El Salvador (4,000 MT), Canada (2,400 MT, including decreases of 200 MT), Saudi Arabia (800 MT, including decreases of 700 MT), and Mexico (500 MT). Exports of 14,300 MT were up 37 percent from the previous week, but down 76 percent from the prior 4-week average. The destinations were primarily to Guatemala (6,200 MT), Mexico (3,800 MT), Canada (2,300 MT), Saudi Arabia (800 MT), and Jordan (500 MT).
Soybeans: Net sales of 152,500 MT for 2022/2023 were down 77 percent from the previous week and 55 percent from the prior 4-week average. Increases primarily for China (137,700 MT, including 126,000 MT switched from unknown destinations and decreases of 6,500 MT), Mexico (76,700 MT, including decreases of 700 MT), the Netherlands (65,000 MT, including 62,000 MT switched from unknown destinations), Japan (52,800 MT, including decreases of 18,000 MT), and Algeria (42,500 MT, including 45,000 MT switched from unknown destinations and decreases of 2,500 MT), were offset by reductions primarily for unknown destinations (222,000 MT). Net sales of 199,000 MT for 2023/2024 were reported for unknown destinations (132,000 MT) and China (67,000 MT). Exports of 704,300 MT were down 8 percent from the previous week and 26 percent from the prior 4-week average. The destinations were primarily to China (420,900 MT), the Netherlands (65,000 MT), Egypt (50,300 MT), Algeria (42,500 MT), and Mexico (42,500 MT).
Optional Origin Sales: For 2022/2023, the current outstanding balance of 300 MT, all South Korea.
Export for Own Account: For 2022/2023, the current exports for own account outstanding balance of 1,600 MT are for Canada (1,500 MT) and Taiwan (100 MT).
Export Adjustments: Accumulated exports of soybeans to Colombia were adjusted down 9,624 MT for week ending March 9th. This shipment was reported in error.
Soybean Cake and Meal: Net sales of 121,100 MT for 2022/2023 were down 45 percent from the previous week and 38 percent from the prior 4-week average. Increases primarily for Canada (33,400 MT, including decreases of 1,800 MT), the Philippines (19,700 MT, including decreases of 300 MT), Venezuela (12,500 MT), Costa Rica (12,000 MT), and Panama (6,900 MT), were offset by reductions for Japan (1,600 MT). Exports of 269,300 MT were down 20 percent from the previous week, but up 3 percent from the prior 4-week average. The destinations were primarily to Chile (49,300 MT), Colombia (49,000 MT), Poland (47,700 MT), Ecuador (31,900 MT), and Mexico (29,700 MT).
Late Reporting: For 2022/2023, net sales totaling 2,000 MT of soybean cake and meal were reported late for Malaysia. Exports of 1,600 MT were late to Malaysia.
Soybean Oil: Net sales of 10,800 MT for 2022/2023–a marketing-year high–were up noticeably from the previous week and from the prior 4-week average. Increases were reported for Mexico (10,700 MT) and Canada (100 MT, including decreases of 100 MT). Exports of 300 MT were down 7 percent from the previous week and 80 percent from the prior 4-week average. The destination was to Canada.
Cotton: Net sales of 310,200 RB for 2022/2023 were up 38 percent from the previous week and 33 percent from the prior 4-week average. Increases primarily for Vietnam (115,300 RB, including 2,600 RB switched from South Korea, 800 RB switched from China, 300 RB switched from Japan, and decreases of 100 RB), China (95,900 RB, including 900 RB switched from Pakistan), Bangladesh (30,000 RB), Turkey (25,100 RB), and Pakistan (15,700 RB, including decreases of 4,700 RB), were offset by reductions for Guatemala (14,000 RB). Net sales of 21,300 RB for 2023/2024 were reported for Guatemala (9,600 RB), Japan (5,300 RB), Pakistan (4,400 RB), Vietnam (1,300 RB), and Peru (700 RB). Exports of 272,500 RB were unchanged from the previous week, but up 13 percent from the prior 4-week average. The destinations were primarily to Vietnam (92,300 RB), Pakistan (42,100 RB), Turkey (38,400 RB), China (30,100 RB), and Mexico (15,400 RB). Net sales of Pima totaling 16,900 RB for 2022/2023–a marketing-year high–were up noticeably from the previous week and from the prior 4-week average. Increases were primarily for India (11,200 RB), China (3,200 RB), Pakistan (1,000 RB), Thailand (700 RB), and Guatemala (400 RB). Total net sales of 400 RB for 2023/2024 were for Japan. Exports of 7,100 RB were up noticeably from the previous week and from the prior 4-week average. The destinations were primarily to China (1,500 RB), India (1,500 RB), Peru (900 RB), Turkey (900 RB), and Vietnam (900 RB).
Optional Origin Sales: For 2022/2023, the current outstanding balance of 7,300 RB, all Malaysia.
Export for Own Account: For 2022/2023, new exports for own account totaling 17,300 RB were to China (15,100 RB) and Vietnam (2,200 RB). Exports for own account totaling 2,500 RB to China were applied to new or outstanding sales. The current exports for own account outstanding balance of 115,700 RB are for China (86,900 RB), Vietnam (16,200 RB), Pakistan (5,000 RB), Turkey (3,700 RB), South Korea (2,400 RB), and India (1,500 RB).
Hides and Skins: Net sales of 328,100 pieces for 2023 were down 3 percent from the previous week and 6 percent from the prior 4-week average. Increases primarily for China (196,700 whole cattle hides, including decreases of 20,800 pieces), Mexico (74,900 whole cattle hides, including decreases of 2,300 pieces), South Korea (43,800 whole cattle hides, including decreases of 1,700 pieces), Turkey (7,100 whole cattle hides), and Thailand (3,900 whole cattle hides, including decreases of 400 pieces), were offset by reductions primarily for Italy (1,500 pieces), Brazil (400 pieces), and Taiwan (400 pieces). In addition, total net sales reductions of 400 kip skins were for Canada. Exports of 393,800 pieces were down 13 percent from the previous week and 12 percent from the prior 4-week average. Whole cattle hides exports were primarily to China (226,500 pieces), South Korea (65,700 pieces), Mexico (44,700 pieces), Brazil (20,600 pieces), and Italy (10,800 pieces). Exports of 2,600 kip skins were to Canada.
Net sales of 145,100 wet blues for 2023 were up 68 percent from the previous week and 22 percent from the prior 4-week average. Increases primarily for Vietnam (48,300 unsplit), Brazil (42,900 grain splits, 100 unsplit, and decreases of 100 grain splits), China (29,200 unsplit), Taiwan (19,500 unsplit), and Mexico (3,400 unsplit, including decreases of 100 unsplit), were offset by reductions for Hong Kong (100 unsplit). Exports of 117,300 wet blues were down 26 percent from the previous week and 23 percent from the prior 4-week average. The destinations were primarily to Italy (37,600 unsplit), China (25,400 unsplit), Vietnam (17,600 unsplit), Thailand (14,800 unsplit), and Brazil (6,300 unsplit and 2,000 grain splits). Total net sales of 224,100 splits were for Vietnam. No exports of splits were reported for the week.
Beef: Net sales of 18,600 MT for 2023 were up 5 percent from the previous week and 59 percent from the prior 4-week average. Increases primarily for South Korea (10,800 MT, including decreases of 1,700 MT), Japan (3,600 MT, including decreases of 900 MT), China (1,500 MT, including decreases of 300 MT), Taiwan (800 MT, including decreases of 300 MT), and Hong Kong (800 MT, including decreases of 100 MT), were offset by reductions for the United Kingdom (100 MT). Exports of 13,500 MT were down 15 percent from the previous week and 13 percent from the prior 4-week average. The destinations were primarily to Japan (3,500 MT), South Korea (3,200 MT), China (2,300 MT), Mexico (1,300 MT), and Taiwan (900 MT).
Pork: Net sales of 38,000 MT for 2023 were up 7 percent from the previous week and 8 percent from the prior 4-week average. Increases were primarily for Mexico (18,400 MT, including decreases of 600 MT), Canada (4,800 MT, including decreases of 500 MT), Japan (4,400 MT, including decreases of 200 MT), South Korea (3,400 MT, including decreases of 300 MT), and Australia (1,800 MT). Exports of 30,500 MT were up 3 percent from the previous week and 2 percent from the prior 4-week average. The destinations were primarily to Mexico (13,200 MT), China (4,400 MT), Japan (3,900 MT), South Korea (2,600 MT), and Canada (1,500 MT).
U.S. EXPORT SALES FOR WEEK ENDING 3/16/2023
|
|
CURRENT MARKETING YEAR |
NEXT MARKETING YEAR |
||||||
|
COMMODITY |
NET SALES |
OUTSTANDING SALES |
WEEKLY EXPORTS |
ACCUMULATED EXPORTS |
NET SALES |
OUTSTANDING SALES |
||
|
CURRENT YEAR |
YEAR AGO |
CURRENT YEAR |
YEAR AGO |
|||||
|
|
THOUSAND METRIC TONS |
|||||||
|
WHEAT |
|
|
|
|
|
|
|
|
|
HRW |
48.8 |
696.7 |
1,586.8 |
43.6 |
4,161.9 |
5,873.3 |
0.1 |
112.4 |
|
SRW |
24.0 |
491.4 |
567.6 |
57.3 |
2,244.2 |
2,188.3 |
7.5 |
381.8 |
|
HRS |
6.4 |
924.8 |
1,067.2 |
111.8 |
4,486.8 |
4,112.0 |
5.4 |
94.9 |
|
WHITE |
13.3 |
772.4 |
503.8 |
148.9 |
3,717.5 |
2,803.4 |
0.0 |
43.2 |
|
DURUM |
33.0 |
77.8 |
18.8 |
0.0 |
290.5 |
169.7 |
0.0 |
36.9 |
|
TOTAL |
125.6 |
2,963.0 |
3,744.1 |
361.6 |
14,900.7 |
15,146.7 |
13.0 |
669.2 |
|
BARLEY |
0.0 |
3.9 |
13.9 |
0.0 |
8.0 |
14.7 |
0.0 |
6.0 |
|
CORN |
3,095.9 |
16,354.1 |
22,719.4 |
1,381.3 |
18,586.9 |
30,297.9 |
93.0 |
1,952.4 |
|
SORGHUM |
-3.6 |
855.0 |
3,274.7 |
49.4 |
642.7 |
3,501.7 |
0.0 |
63.0 |
|
SOYBEANS |
152.5 |
5,944.1 |
11,161.5 |
704.3 |
43,533.7 |
42,874.7 |
199.0 |
1,745.2 |
|
SOY MEAL |
121.1 |
2,666.0 |
3,223.1 |
269.3 |
5,720.5 |
5,829.4 |
0.0 |
264.0 |
|
SOY OIL |
10.8 |
41.3 |
167.2 |
0.3 |
32.8 |
435.2 |
0.0 |
0.6 |
|
RICE |
|
|
|
|
|
|
|
|
|
L G RGH |
10.2 |
158.4 |
234.2 |
9.0 |
426.2 |
922.9 |
0.0 |
0.0 |
|
M S RGH |
0.0 |
31.3 |
3.5 |
0.8 |
20.6 |
10.7 |
0.0 |
5.0 |
|
L G BRN |
1.3 |
5.1 |
16.5 |
0.4 |
15.0 |
33.2 |
0.0 |
0.0 |
|
M&S BR |
0.0 |
35.8 |
43.9 |
0.1 |
8.8 |
42.3 |
0.0 |
0.0 |
|
L G MLD |
1.5 |
104.6 |
73.9 |
2.4 |
442.3 |
569.2 |
0.0 |
0.0 |
|
M S MLD |
1.8 |
141.4 |
240.4 |
1.7 |
179.1 |
257.5 |
0.0 |
13.0 |
|
TOTAL |
14.9 |
476.5 |
612.5 |
14.3 |
1,091.9 |
1,835.9 |
0.0 |
18.0 |
|
COTTON |
|
THOUSAND RUNNING BALES |
||||||
|
UPLAND |
310.2 |
4,958.3 |
7,670.9 |
272.5 |
6,220.8 |
6,292.4 |
21.3 |
1,360.0 |
|
PIMA |
16.9 |
56.1 |
160.7 |
7.1 |
108.4 |
270.5 |
0.4 |
3.9 |
| Terry Reilly Senior Commodity Analyst – Grain and Oilseeds |
| Futures International One Lincoln Center 18W140 Butterfield Rd. Suite 1450 Oakbrook terrace, Il. 60181 |
| Work: 312.604.1366 ICE IM: treilly1 Skype IM: fi.treilly |
| treilly@futures-int.com
|
| DISCLAIMER: The contents of this communication and any attachments are for informational purposes only and under no circumstances should they be construed as an offer to buy or sell, or a solicitation to buy or sell any future, option, swap or other derivative. The sources for the information and any opinions in this communication are believed to be reliable, but Futures International, LLC does not warrant or guarantee the accuracy of such information or opinions. This communication may contain links to third party websites which are not under the control of FI and FI is not responsible for their content. Trading of futures, options, swaps and other derivatives is risky and is not suitable for all persons. All of these investment products are leveraged, and you can lose more than your initial deposit. Each investment product is offered only to and from jurisdictions where solicitation and sale are lawful, and in accordance with applicable laws and regulations in such jurisdiction. The information provided here should not be relied upon as a substitute for independent research before making your investment decisions. Futures International, LLC is merely providing this information for your general information and the information does not take into account any particular individual’s investment objectives, financial situation, or needs. All investors should obtain advice based on their unique situation before making any investment decision. Futures International, LLC and its principals and employees may take positions different from any positions described in this communication. Past results are not necessarily indicative of future results. |