PDF attached
Sales were within expectations
Export Sales Highlights
This summary is based on reports from exporters for the period March 3-9, 2023.
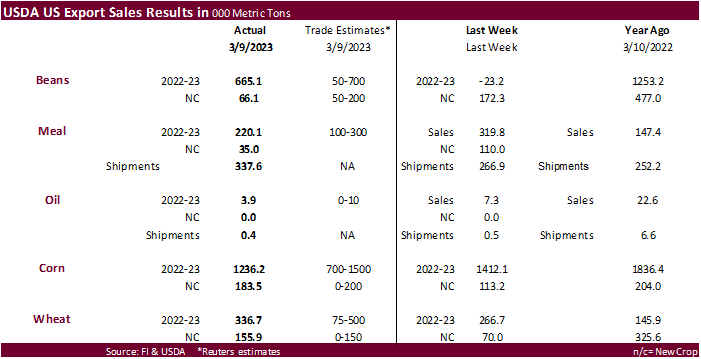
Wheat: Net sales of 336,700 metric tons (MT) for 2022/2023 were up 26 percent from the previous week and 23 percent from the prior 4-week average. Increases primarily for the Philippines (121,900 MT), Japan (81,400 MT), Mexico (49,100 MT), Vietnam (35,600 MT, including 32,900 MT switched from unknown destinations), and Malaysia (19,500 MT, including 18,600 MT switched from unknown destinations and decreases of 200 MT), were offset by reductions for the Leeward-Windward Islands (20,000 MT), Guatemala (16,000 MT), unknown destinations (11,300 MT), and Ecuador (5,500 MT). Net sales of 155,900 MT for 2023/2024 were reported for unknown destinations (136,000 MT), Ecuador (8,500 MT), Costa Rica (8,000 MT), Peru (3,000 MT), and Panama (400 MT). Exports of 250,700 MT were down 34 percent from the previous week and 45 percent from the prior 4-week average. The destinations were primarily to Mexico (48,100 MT, including 11,000 MT – late), the Philippines (32,900 MT), Honduras (29,700 MT), Japan (25,200 MT), and Malaysia (19,600 MT).
Late Reporting: For 2022/2023, exports of 11,000 MT were reported late to Mexico.
Corn: Net sales of 1,236,200 MT for 2022/2023 were down 13 percent from the previous week, but up 28 percent from the prior 4-week average. Increases primarily for Japan (499,500 MT, including 177,400 MT switched from unknown destinations and decreases of 2,000 MT), Colombia (209,800 MT, including 90,000 MT switched from unknown destinations and decreases of 10,100 MT), Mexico (199,100 MT, including decreases of 300 MT), South Korea (120,000 MT, including decreases of 65,000 MT), and China (73,200 MT, including 65,000 MT switched from unknown destinations and decreases of 1,500 MT), were offset by reductions for unknown destinations (74,400 MT), Guatemala (16,000 MT), and the Leeward-Windward Islands (10,000 MT). Net sales of 183,500 MT for 2023/2024 were reported for Japan (143,500 MT) and Mexico (40,000 MT). Exports of 1,164,900 MT–a marketing-year high–were up 11 percent from the previous week and 52 percent from the prior 4-week average. The destinations were primarily to Japan (336,100 MT), Mexico (260,600 MT), Colombia (181,100 MT), China (127,800 MT), and Morocco (66,000 MT).
Optional Origin Sales: For 2022/2023, options were exercised to export 50,000 MT to South Korea from other than the United States. The current outstanding balance of 140,000 MT were for South Korea (100,000 MT) and Egypt (40,000 MT).
Late Reporting: For 2022/2023, net sales totaling 55,900 MT of corn were reported late for the Netherlands (50,500 MT), Taiwan (5,200 MT), and Hong Kong (200 MT). Exports of 9,600 MT were late to Taiwan (5,200 MT), the Netherlands (4,200 MT), and Hong Kong (200 MT).
Barley: No net sales or exports were reported for the week.
Sorghum: Net sales of 293,300 MT for 2022/2023–a marketing-year high–were up 89 percent from the previous week and up noticeably from the prior 4-week average. Increases were reported for unknown destinations (178,000 MT) and China (115,300 MT, including decreases of 700 MT). Total net sales of 63,000 MT for 2023/2024 were for China. Exports of 72,300 MT were up 47 percent from the previous week and 27 percent from the prior 4-week average. The destination was to China.
Rice: Net sales of 25,800 MT for 2022/2023 were down 82 percent from the previous week and 59 percent from the prior 4-week average. Increases were primarily for Japan (13,000 MT), Mexico (10,200 MT), Saudi Arabia (1,200 MT), Canada (1,000 MT), and Belgium (100 MT). Total net sales of 13,000 MT for 2023/2024 were for Japan. Exports of 10,400 MT were down 94 percent from the previous week and 86 percent from the prior 4-week average. The destinations were primarily to Mexico (5,900 MT), Canada (3,100 MT), Jordan (600 MT), Saudi Arabia (200 MT), and the United Kingdom (200 MT).
Soybeans: Net sales of 665,000 MT for 2022/2023 were up noticeably from the previous week and from the prior 4-week average. Increases primarily for China (208,100 MT, including decreases of 67,900 MT), Germany (121,500 MT, including 62,000 MT switched from unknown destinations), Indonesia (60,700 MT, including 14,700 MT – late), Thailand (59,900 MT, including decreases of 100 MT and 58,700 MT – late), and the Netherlands (57,400 MT, including 60,000 MT switched from unknown destinations and decreases of 2,600 MT), were offset by reductions primarily for Egypt (1,400 MT). Net sales of 66,100 MT for 2023/2024 were reported for unknown destinations (66,000 MT) and South Korea (100 MT). Exports of 773,500 MT were up 33 percent from the previous week, but down 37 percent from the prior 4-week average. The destinations were primarily to China (196,200 MT), Mexico (136,900 MT), Germany (121,500 MT), the Netherlands (57,400 MT), and Japan (56,800 MT).
Optional Origin Sales: For 2022/2023, the current outstanding balance of 300 MT, all South Korea.
Exports for Own Account: For 2022/2023, the current exports for own account outstanding balance of 1,600 MT are for Canada (1,500 MT) and Taiwan (100 MT).
Export Adjustments: Accumulated exports of soybeans to the Netherlands were adjusted down 52,262 MT for week ending February 23rd. The correct destination for this shipment is Germany.
Late Reporting: For 2022/2023, late net sales of 127,100 MT of soybeans were primarily for Thailand (58,700 MT), Malaysia (20,100 MT), Indonesia (14,700 MT), the Philippines (12,700 MT), Taiwan (12,200 MT), Vietnam (4,900 MT), Cambodia (2,200 MT), and Bangladesh (1,000 MT). Exports of 54,900 MT were late to Malaysia (16,600 MT), Taiwan (12,200 MT), Indonesia (9,700 MT), the Philippines (6,700 MT), Thailand (4,800 MT), Vietnam (4,000 MT), Cambodia (600 MT), and Senegal (300 MT).
Soybean Cake and Meal: Net sales of 220,100 MT for 2022/2023 were down 31 percent from the previous week, but up 6 percent from the prior 4-week average. Increases primarily for the Philippines (44,100 MT, including decreases of 900 MT), the Dominican Republic (39,100 MT), Ecuador (33,000 MT, including 30,000 MT switched from unknown destinations), Canada (32,200 MT, including decreases of 100 MT), and Sri Lanka (16,500 MT, including 12,700 MT – late), were offset by reductions primarily for unknown destinations (33,000 MT) and Belgium (700 MT). Total net sales of 35,000 MT for 2023/2024 were for Ireland. Exports of 337,600 MT–a marketing-year high–were up 27 percent from the previous week and 48 percent from the prior 4-week average. The destinations were primarily to Ecuador (60,200 MT), Vietnam (52,000 MT), Colombia (48,600 MT), the Philippines (21,600 MT), and the Dominican Republic (18,900 MT).
Late Reporting: For 2022/2023, net sales totaling 24,600 MT of soybean cake and meal were reported late for Sri Lanka (12,700 MT), Taiwan (4,500 MT), Indonesia (3,800 MT), Burma (3,200 MT), and Hong Kong (400 MT). Exports of 23,000 MT were late to Sri Lanka (12,700 MT), Taiwan (4,500 MT), Burma (3,200 MT), Indonesia (2,300 MT), and Hong Kong (300 MT).
Soybean Oil: Net sales of 3,900 MT for 2022/2023 were down 47 percent from the previous week and 3 percent from the prior 4-week average. Increases were primarily for Mexico (2,500 MT). Exports of 400 MT were down 31 percent from the previous week and 79 percent from the prior 4-week average. The destination was to Canada.
Cotton: Net sales of 225,500 RB for 2022/2023 were up 97 percent from the previous week, but down 3 percent from the prior 4-week average. Increases were primarily for Vietnam (120,200 RB, including 8,400 RB switched from China and 1,000 RB switched from South Korea), China (35,800 RB), Turkey (16,900 RB, including decreases of 3,200 RB), Pakistan (10,400 RB, including decreases of 5,300 RB), and South Korea (10,100 RB, including decreases of 100 RB). Net sales of 12,800 RB for 2023/2024 were reported for Turkey (4,400 RB), Pakistan (4,400 RB), and South Korea (4,000 RB). Exports of 273,900 RB were down 5 percent from the previous week, but up 25 percent from the prior 4-week average. The destinations were primarily to Vietnam (78,000 RB), China (51,800 RB), Pakistan (38,200 RB), Turkey (29,900 RB), and Indonesia (13,700 RB). Net sales of Pima totaling 7,600 RB for 2022/2023–a marketing-year high–were up 99 percent from the previous week and up noticeably from the prior 4-week average. Increases primarily for China (2,900 RB), Vietnam (2,400 RB), Egypt (1,300 RB), Thailand (800 RB, including 200 RB switched from Japan), and Turkey (400 RB), were offset by reductions for Japan (400 RB). Exports of 1,500 RB were down 49 percent from the previous week and 64 percent from the prior 4-week average. The destinations were primarily to Thailand (600 RB), Bangladesh (300 RB), China (300 RB), and Indonesia (200 RB).
Optional Origin Sales: For 2022/2023, the current outstanding balance of 7,300 RB, all Malaysia.
Exports for Own Account: For 2022/2023, new exports for own account totaling 26,600 RB were to Vietnam (16,400 RB) and China (10,200 RB). Exports for own account totaling 39,700 RB primarily to Vietnam (36,700 RB) were applied to new or outstanding sales. The current exports for own account outstanding balance of 100,800 RB are for China (74,400 RB), Vietnam (14,000 RB), Pakistan (5,000 RB), Turkey (3,500 RB), South Korea (2,400 RB), and India (1,500 RB).
Hides and Skins: Net sales of 337,500 pieces for 2023 were up 13 percent from the previous week, but down 21 percent from the prior 4-week average. Increases primarily for China (208,000 whole cattle hides, including decreases of 37,500 pieces), Mexico (51,600 whole cattle hides, including decreases of 8,400 pieces), South Korea (28,600 whole cattle hides, including decreases of 1,000 pieces), Italy (27,100 whole cattle hides, including decreases of 500 pieces), and Indonesia (6,100 while cattle hides), were offset by reductions for Brazil (100 pieces). Total net sales of 11,100 calf skins were for Italy. In addition, net sales reductions of 400 kip skins resulting in increases for Japan (200 kips skins), were more than offset by reductions for China (600 pieces). Exports of 455,000 pieces were up 24 percent from the previous week and 2 percent from the prior 4-week average. Whole cattle hides exports were primarily to China (285,900 pieces), South Korea (60,700 pieces), Mexico (48,400 pieces), Thailand (18,800 pieces), and Brazil (14,300 pieces). Exports of 5,100 kip skins were to China.
Net sales of 86,400 wet blues for 2023 were down 37 percent from the previous week and 29 percent from the prior 4-week average. Increases were primarily for China (39,100 unsplit), Vietnam (28,000 unsplit), Taiwan (8,100 unsplit), Hong Kong (5,000 unsplit), and Brazil (2,000 unsplit, including decreases of 100 grain split). Exports of 158,600 wet blues were up 30 percent from the previous week and 6 percent from the prior 4-week average. The destinations were primarily to China (40,900 unsplit), Italy (40,200 unsplit), Vietnam (33,000 unsplit), Thailand (22,500 unsplit), and Hong Kong (7,000 unsplit). Net sales reductions of 900 splits resulting in increases for Taiwan (2,300 pounds), were more than offset by reductions for Hong Kong (3,300 pounds). Exports of 43,300 pounds were to Taiwan.
Beef: Net sales of 17,700 MT for 2023 were up noticeably from the previous week and up 24 percent from the prior 4-week average. Increases primarily for South Korea (5,300 MT, including decreases of 400 MT), Japan (3,200 MT, including decreases of 300 MT), Taiwan (2,600 MT, including decreases of 100 MT), Hong Kong (1,900 MT, including decreases of 100 MT), and China (1,600 MT, including decreases of 100 MT), were offset by reductions for Chile (100 MT). Exports of 15,900 MT were up 22 percent from the previous week and 2 percent from the prior 4-week average. The destinations were primarily to South Korea (4,400 MT), Japan (3,900 MT), China (2,600 MT), Mexico (1,300 MT), and Taiwan (1,000 MT).
Pork: Net sales of 35,600 MT for 2023 were up 62 percent from the previous week, but down 5 percent from the prior 4-week average. Increases were primarily for Mexico (9,900 MT, including decreases of 300 MT), Japan (6,400 MT, including decreases of 200 MT), China (5,000 MT, including decreases of 100 MT), South Korea (4,100 MT, including decreases of 1,100 MT), and Canada (2,800 MT, including decreases of 400 MT). Exports of 29,800 MT were down 2 percent from the previous week and 1 percent from the prior 4-week average. The destinations were primarily to Mexico (13,500 MT), Japan (3,800 MT), China (3,500 MT), South Korea (2,700 MT), and Canada (1,600 MT).
U.S. EXPORT SALES FOR WEEK ENDING 3/9/2023
|
|
CURRENT MARKETING YEAR |
NEXT MARKETING YEAR |
||||||
|
COMMODITY |
NET SALES |
OUTSTANDING SALES |
WEEKLY EXPORTS |
ACCUMULATED EXPORTS |
NET SALES |
OUTSTANDING SALES |
||
|
CURRENT YEAR |
YEAR AGO |
CURRENT YEAR |
YEAR AGO |
|||||
|
|
THOUSAND METRIC TONS |
|||||||
|
WHEAT |
|
|
|
|
|
|
|
|
|
HRW |
69.6 |
691.4 |
1,705.4 |
60.7 |
4,118.3 |
5,720.6 |
0.0 |
112.3 |
|
SRW |
13.2 |
524.6 |
621.6 |
69.8 |
2,186.9 |
2,149.0 |
155.7 |
374.3 |
|
HRS |
138.6 |
1,030.2 |
1,080.9 |
62.0 |
4,374.9 |
4,006.9 |
0.2 |
89.5 |
|
WHITE |
95.2 |
907.9 |
527.9 |
39.3 |
3,568.6 |
2,734.5 |
0.0 |
43.2 |
|
DURUM |
20.0 |
44.7 |
18.8 |
18.9 |
290.5 |
169.7 |
0.0 |
36.9 |
|
TOTAL |
336.7 |
3,198.9 |
3,954.5 |
250.7 |
14,539.2 |
14,780.7 |
155.9 |
656.2 |
|
BARLEY |
0.0 |
3.9 |
13.8 |
0.0 |
8.0 |
14.7 |
0.0 |
6.0 |
|
CORN |
1,236.2 |
14,639.5 |
23,232.1 |
1,164.9 |
17,246.7 |
28,806.5 |
183.5 |
1,859.4 |
|
SORGHUM |
293.3 |
908.1 |
3,536.3 |
72.3 |
593.3 |
3,246.5 |
63.0 |
63.0 |
|
SOYBEANS |
665.0 |
6,495.9 |
11,298.5 |
773.5 |
42,839.0 |
42,325.5 |
66.1 |
1,546.2 |
|
SOY MEAL |
220.1 |
2,814.2 |
3,098.6 |
337.6 |
5,451.2 |
5,693.2 |
35.0 |
264.0 |
|
SOY OIL |
3.9 |
30.8 |
188.6 |
0.4 |
32.4 |
415.8 |
0.0 |
0.6 |
|
RICE |
|
|
|
|
|
|
|
|
|
L G RGH |
8.0 |
157.2 |
242.3 |
3.1 |
417.2 |
890.5 |
0.0 |
0.0 |
|
M S RGH |
1.4 |
32.1 |
8.3 |
1.4 |
19.8 |
5.3 |
0.0 |
5.0 |
|
L G BRN |
0.1 |
4.2 |
17.0 |
0.3 |
14.6 |
32.7 |
0.0 |
0.0 |
|
M&S BR |
0.1 |
35.8 |
43.9 |
0.0 |
8.8 |
42.2 |
0.0 |
0.0 |
|
L G MLD |
2.4 |
105.4 |
67.4 |
3.5 |
440.0 |
558.0 |
0.0 |
0.0 |
|
M S MLD |
13.8 |
141.2 |
204.1 |
2.2 |
177.4 |
252.9 |
13.0 |
13.0 |
|
TOTAL |
25.8 |
475.9 |
583.1 |
10.4 |
1,077.6 |
1,781.5 |
13.0 |
18.0 |
|
COTTON |
|
THOUSAND RUNNING BALES |
||||||
|
UPLAND |
225.5 |
4,920.6 |
7,806.0 |
273.9 |
5,948.3 |
5,849.7 |
12.8 |
1,338.7 |
|
PIMA |
7.6 |
46.3 |
163.6 |
1.5 |
101.3 |
264.7 |
0.0 |
3.5 |
| Terry Reilly Senior Commodity Analyst – Grain and Oilseeds |
| Futures International One Lincoln Center 18W140 Butterfield Rd. Suite 1450 Oakbrook terrace, Il. 60181 |
| Work: 312.604.1366 ICE IM: treilly1 Skype IM: fi.treilly |
| treilly@futures-int.com
|
| DISCLAIMER: The contents of this communication and any attachments are for informational purposes only and under no circumstances should they be construed as an offer to buy or sell, or a solicitation to buy or sell any future, option, swap or other derivative. The sources for the information and any opinions in this communication are believed to be reliable, but Futures International, LLC does not warrant or guarantee the accuracy of such information or opinions. This communication may contain links to third party websites which are not under the control of FI and FI is not responsible for their content. Trading of futures, options, swaps and other derivatives is risky and is not suitable for all persons. All of these investment products are leveraged, and you can lose more than your initial deposit. Each investment product is offered only to and from jurisdictions where solicitation and sale are lawful, and in accordance with applicable laws and regulations in such jurisdiction. The information provided here should not be relied upon as a substitute for independent research before making your investment decisions. Futures International, LLC is merely providing this information for your general information and the information does not take into account any particular individual’s investment objectives, financial situation, or needs. All investors should obtain advice based on their unique situation before making any investment decision. Futures International, LLC and its principals and employees may take positions different from any positions described in this communication. Past results are not necessarily indicative of future results. |