PDF attached
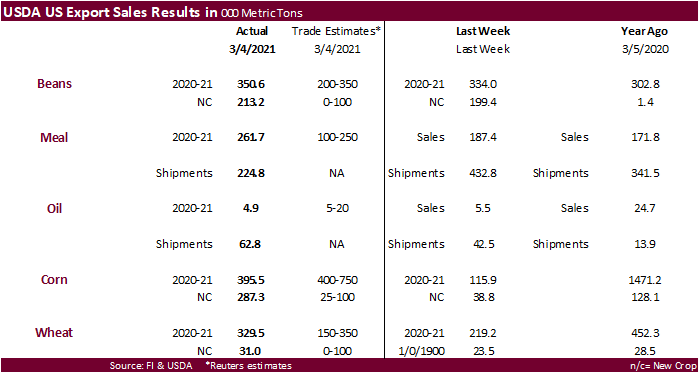
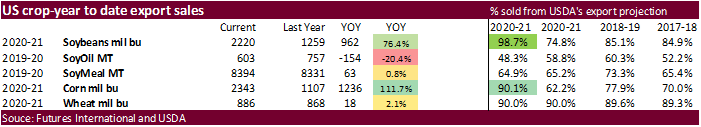
USDA Export Sales were good all around. Corn commitments top 90% of USDA’s export projection and soybeans are nearly at 99%.
USDA export sales for corn of 395,500 tons old crop and 287,300 tons new crop were at the high end of expectations when combined. 2020-21 sales of 395,500 MT included Taiwan, Japan, South Korea and Mexico. New-crop sales included Japan (175,200 MT) and Mexico (112,100 MT). Sorghum sales were 60,300 tons with China taking the bulk of that amount. USDA export sales for pork were very good at 32,400 MT and included China for 10,700 MT (including decreases of 1,000 MT) and Mexico of 6,900 MT (including decreases of 500 MT).
USDA export sales for soybeans were better than expectations when combined. 2020-21 sales of 350.600 tons included China (90,200 MT, including 65,000 MT switched from unknown destinations and decreases of 1,400 MT ), Indonesia (81,000 MT, including 55,000 MT switched from unknown destinations), Mexico (77,900 MT, including decreases of 14,400 MT), and Germany (68,100 MT). New crop sales of 213,200 MT were reported for Taiwan (65,000 MT), China (63,000 MT), Bangladesh (55,000 MT), and Japan (30,200 MT).
USDA soybean meal export sales came in at 261,600 tons, better than expected. Soybean oil sales were only 4,900 tons. Shipments were fantastic for soybean oil at 62,800 tons while meal shipment stood at 224,800 tons.
All-wheat export sales were 329,500 tons old-crop and 31,000 tons new-crop.
Mexico and Japan dominated old crop sales and for new-crop much of it was for Central America.
U.S. EXPORT SALES FOR WEEK ENDING 3/4/2021
|
|
CURRENT MARKETING YEAR |
NEXT MARKETING YEAR |
||||||
|
COMMODITY |
NET SALES |
OUTSTANDING SALES |
WEEKLY EXPORTS |
ACCUMULATED EXPORTS |
NET SALES |
OUTSTANDING SALES |
||
|
CURRENT YEAR |
YEAR |
CURRENT YEAR |
YEAR |
|||||
|
|
THOUSAND METRIC TONS |
|||||||
|
WHEAT |
|
|
|
|
|
|
|
|
|
HRW |
151.9 |
1,376.1 |
1,779.4 |
110.9 |
6,782.8 |
6,993.6 |
6.0 |
258.0 |
|
SRW |
20.1 |
413.9 |
336.8 |
10.9 |
1,340.7 |
1,964.1 |
12.0 |
296.6 |
|
HRS |
67.9 |
1,941.5 |
1,606.9 |
110.4 |
5,218.6 |
5,369.5 |
13.0 |
245.7 |
|
WHITE |
89.1 |
2,138.1 |
1,046.0 |
236.1 |
4,236.0 |
3,707.2 |
0.0 |
80.3 |
|
DURUM |
0.5 |
154.2 |
148.4 |
0.5 |
518.4 |
679.8 |
0.0 |
5.0 |
|
TOTAL |
329.5 |
6,023.8 |
4,917.3 |
468.7 |
18,096.5 |
18,714.2 |
31.0 |
885.6 |
|
BARLEY |
1.1 |
11.5 |
14.9 |
0.2 |
22.0 |
34.3 |
0.0 |
14.5 |
|
CORN |
395.5 |
31,756.3 |
12,881.3 |
1,592.9 |
27,762.7 |
15,231.9 |
287.3 |
1,554.0 |
|
SORGHUM |
60.3 |
2,844.4 |
915.9 |
59.2 |
3,094.1 |
1,083.1 |
53.0 |
756.0 |
|
SOYBEANS |
350.6 |
7,111.4 |
4,167.5 |
705.1 |
53,320.3 |
30,092.0 |
213.2 |
5,076.2 |
|
SOY MEAL |
261.6 |
2,720.2 |
3,252.0 |
224.8 |
5,673.9 |
5,078.9 |
18.3 |
233.4 |
|
SOY OIL |
4.9 |
101.8 |
257.1 |
62.8 |
501.1 |
500.1 |
0.0 |
0.6 |
|
RICE |
|
|
|
|
|
|
|
|
|
L G RGH |
14.4 |
264.6 |
376.7 |
25.3 |
1,007.8 |
879.6 |
0.0 |
0.0 |
|
M S RGH |
0.0 |
9.9 |
50.9 |
0.0 |
19.0 |
17.5 |
0.0 |
0.0 |
|
L G BRN |
0.3 |
12.6 |
13.2 |
0.5 |
24.5 |
35.0 |
0.0 |
0.0 |
|
M&S BR |
0.2 |
70.7 |
69.6 |
0.2 |
81.9 |
38.1 |
0.0 |
0.0 |
|
L G MLD |
6.7 |
76.1 |
60.7 |
4.3 |
401.1 |
635.2 |
0.0 |
0.0 |
|
M S MLD |
7.5 |
224.7 |
194.0 |
17.8 |
347.8 |
385.4 |
0.0 |
0.0 |
|
TOTAL |
29.0 |
658.7 |
765.1 |
48.2 |
1,882.2 |
1,990.8 |
0.0 |
0.0 |
|
COTTON |
|
THOUSAND RUNNING BALES |
||||||
|
UPLAND |
212.0 |
5,308.2 |
7,057.0 |
351.6 |
8,481.5 |
7,470.1 |
92.2 |
1,288.8 |
|
PIMA |
12.4 |
263.2 |
232.8 |
23.7 |
457.8 |
271.3 |
0.0 |
1.1 |
This summary is based on reports from exporters for the period February 26-March 4, 2021.
Wheat: Net sales of 329,500 metric tons (MT) for 2020/2021 were up 50 percent from the previous week, but down 4 percent from the prior 4-week average. Increases primarily for Mexico (111,500 MT, including decreases of 1,200 MT), Japan (56,100 MT, including decreases of 500 MT), Thailand (53,300 MT), Vietnam (44,000 MT, including 11,000 MT switched from unknown destinations), and Ecuador (30,500 MT, including 30,000 MT switched from unknown destinations), were offset by reductions primarily for unknown destinations (51,000 MT). For 2021/2022, net sales of 31,000 MT were for Honduras (17,000 MT) and Colombia (14,000 MT). Exports of 468,700 MT were up 15 percent from the previous week and 16 percent from the prior 4-week average. The destinations were primarily to China (130,600 MT), South Korea (82,600 MT), Japan (71,100 MT), the Philippines (62,700 MT), and Taiwan (61,700 MT).
Optional Origin Sales: For 2020/2021, the current outstanding balance of 10,000 MT, all Spain.
Corn: Net sales of 395,500 MT for 2020/2021 were up noticeably from the previous week, but down 48 percent from the prior 4-week average. Increases primarily for Taiwan (135,200 MT, including 56,000 MT switched from Japan and 65,000 MT late), South Korea (127,600 MT, including 68,000 MT switched from unknown destinations and decreases of 6,400 MT), Mexico (108,000 MT), Vietnam (63,700 MT, including 66,000 MT switched from unknown destinations and decreases of 2,300 MT), and Kuwait (41,100 MT, switched from unknown destinations), were offset by reductions primarily for unknown destinations (180,900 MT). For 2021/2022, net sales of 287,300 MT were reported for Japan (175,200 MT) and Mexico (112,100 MT). Exports of 1,592,900 MT were down 21 percent from the previous week, but up 4 percent from the prior 4-week average. The destinations were primarily to China (348,400 MT), Japan (276,300 MT), Mexico (202,100 MT), Egypt (140,800 MT), and South Korea (127,900 MT).
Optional Origin Sales: For 2020/2021, the current outstanding balance of 1,174,400 MT is for South Korea (793,000 MT), unknown destinations (244,000 MT), Taiwan (70,000 MT), China (65,000 MT), and Ukraine (2,400 MT).
Late Reporting: For 2020/2021, net sales totaling 131,000 MT were reported late for Japan (66,000 MT) and Taiwan (65,000 MT).
Barley: For 2020/2021, net sales of 1,100 MT were for Canada (900 MT) and South Korea (200 MT). Exports of 200 MT were primarily to South Korea.
Sorghum: For 2020/2021, net sales of 60,300 MT were primarily for China (60,200 MT, including decreases of 100 MT). For 2021/2022, total net sales of 53,000 MT were for China. Exports of 59,200 MT were down 18 percent from the previous week and 28 percent from the prior 4-week average. The destination was China.
Rice: Net sales of 29,000 MT for 2020/2021 were down 69 percent from the previous week and 61 percent from the prior 4-week average. Increases were primarily for Mexico (7,200 MT, including decreases of 300 MT), Canada (5,700 MT), Guatemala (5,000 MT), Japan (4,400 MT), and El Salvador (4,400 MT). Exports of 48,200 MT were down 67 percent from the previous week and 37 percent from the prior 4-week average. The destinations were primarily to Venezuela (24,500 MT), Japan (13,500 MT), Canada (3,100 MT), Mexico (1,700 MT), and Jordan (1,400 MT).
Soybeans: Net sales of 350,600 MT for 2020/2021 were up 32 percent from the previous week, but down 5 percent from the prior 4-week average. Increases primarily for China (90,200 MT, including 65,000 MT switched from unknown destinations and decreases of 1,400 MT ), Indonesia (81,000 MT, including 55,000 MT switched from unknown destinations), Mexico (77,900 MT, including decreases of 14,400 MT), Germany (68,100 MT), and Egypt (64,700 MT, including 55,000 MT switched from unknown destinations), were offset by reductions primarily for unknown destinations (125,300 MT). For 2021/2022, net sales of 213,200 MT were reported for Taiwan (65,000 MT), China (63,000 MT), Bangladesh (55,000 MT), and Japan (30,200 MT). Exports of 705,100 MT were down 36 percent from the previous week and 45 percent from the prior 4-week average. The destinations were primarily to China (224,800 MT), Egypt (149,700 MT), Indonesia (84,800 MT), Germany (68,100 MT), and Mexico (61,100 MT).
Exports for Own Account: The current exports for own account outstanding balance is 5,800 MT, all Canada.
Export Adjustment: Accumulated exports of soybeans to the Netherlands were adjusted down 68,132 MT for week ending February 25th. The correct destination for this shipment was Germany.
Soybean Cake and Meal: Net sales of 261,600 MT for 2020/2021 were up 40 percent from the previous week and 12 percent from the prior 4-week average. Increases primarily for Mexico (89,400 MT, including decreases of 15,400 MT), the Philippines (75,200 MT, including decreases of 100 MT), Ecuador (29,500 MT, including decreases of 500 MT), El Salvador (18,500 MT, including 5,000 MT switched from Guatemala), and the Dominican Republic (15,000 MT), were offset by reductions for Guatemala (3,400 MT) and Belgium (1,800 MT). For 2021/2022, net sales of 18,300 MT were for Guatemala (12,000 MT) and El Salvador (6,300 MT). Exports of 224,800 MT were down 48 percent from the previous week and 25 percent from the prior 4-week average. The destinations were primarily to the Philippines (47,700 MT), Mexico (29,800 MT), Peru (28,100 MT), Ecuador (27,000 MT), and Colombia (23,200 MT).
Soybean Oil: Net sales of 4,900 MT for 2020/2021 were down 10 percent from the previous week, but up 43 percent from the prior 4-week average. Increases primarily for South Korea (25,000 MT, switched from unknown destinations), Hong Kong (5,600 MT, including 5,500 MT switched from unknown destinations), Guatemala (3,500 MT), El Salvador (1,000 MT), and Mexico (500 MT), were offset by reductions primarily for unknown destinations (30,500 MT). Exports of 62,800 MT–a marketing-year high–were up 48 percent from the previous week and up noticeably from the prior 4-week average. The destinations were primarily to South Korea (40,000 MT), Guatemala (9,500 MT), Hong Kong (5,600 MT), El Salvador (2,800 MT), and Costa Rica (2,000 MT).
Cotton: Net sales of 212,000 RB for 2020/2021 were up 25 percent from the previous week and 5 percent from the prior 4-week average. Increases were primarily for China (58,000 RB, including 20,200 RB switched from Vietnam), Vietnam (30,700 RB, including 400 RB switched from Japan, 400 RB switched from South Korea, and decreases of 4,200 RB), Turkey (30,300 RB), Pakistan (23,600 RB), and Bangladesh (21,300 RB). For 2021/2022, net sales of 92,200 RB were primarily for Mexico (56,300 RB), Turkey (23,300 RB), and China (10,100 RB). Exports of 351,600 RB were down 7 percent from the previous week and 1 percent from the prior 4-week average. Exports were primarily to China (94,000 RB), Vietnam (70,200 RB), Pakistan (60,200 RB), Turkey (36,700 RB), and Mexico (22,600 RB). Net sales of Pima totaling 12,400 RB were up 58 percent from the previous week and 13 percent from the prior 4-week average. Increases primarily for China (4,400 RB), India (3,400 RB), Pakistan (2,300 RB, including 800 RB switched from the United Arab Emirates), Germany (900 RB), and Thailand (700 RB, including 100 RB switched from Japan), were offset by reductions primarily for the United Arab Emirates (800 MT). Exports of 23,700 RB were up noticeably from the previous week and from the prior 4-week average. The destinations were primarily to India (7,400 RB), China (4,100 RB), Pakistan (3,600 RB), Peru (3,000 RB), and Vietnam (2,100 RB).
Exports for Own Account: For 2020/2021, new exports for own account totaling 2,800 RB were to Vietnam (2,600 RB) and Bangladesh (200 RB). Exports for own account totaling 8,400 RB primarily to Vietnam (7,200 RB) were applied to new or outstanding sales. The current exports for own account outstanding balance of 35,000 RB is for China (28,200 RB), Vietnam (6,200 RB), and Bangladesh (600 RB).
Hides and Skins: Net sales of 518,600 pieces for 2021 were up 44 percent from the previous week and 60 percent from the prior 4-week average. Increases primarily for China (390,500 whole cattle hides, including decreases of 35,600 pieces), South Korea (31,300 whole cattle hides, including decreases of 2,100 pieces), Thailand (29,000 whole cattle hides, including decreases of 700 pieces), Mexico (26,600 whole cattle hides, including decreases of 1,000 pieces), and Taiwan (17,900 whole cattle hides), were offset by reductions for Brazil (1,400 pieces). Total net sales of 1,000 calf skins were for Italy, including decreases of 100 pieces. In addition, total net sales reductions of 300 kip skins were for Belgium. Exports of 389,800 pieces for 2021 were down 1 percent from the previous week, but up 10 percent from the prior 4-week average. Whole cattle hides exports were primarily to China (286,400 pieces), South Korea (40,700 pieces), Mexico (27,300 pieces), Thailand (17,700 pieces), and Brazil (5,900 pieces). Exports of 3,900 calf skins were to Italy. Additionally, exports of 2,600 kip skins were to Belgium.
Net sales of 144,400 wet blues for 2021 were up 91 percent from the previous week and 44 percent from the prior 4-week average. Increases primarily for Vietnam (68,400 unsplit, including decreases of 200 unsplit), China (26,200 unsplit, including decreases of 400 unsplit), Italy (19,700 unsplit, including decreases of 200 unsplit), Thailand (16,800 unsplit), and Mexico (7,800 grain splits and 1,100 unsplit, including decreases of 100 grain splits). Exports of 108,800 wet blues for 2021 were up 16 percent from the previous week and 1 percent from the prior 4-week average. The destinations were primarily to Vietnam (33,200 unsplit), Italy (24,100 unsplit and 7,200 grain splits), China (20,700 unsplit and 2,500 grain splits), Brazil (6,500 unsplit), and Thailand (4,900 unsplit). Net sales of 1,486,600 splits were reported for Vietnam (1,205,100 pounds, including decreases of 2,100 pounds), Italy (195,700 pounds), and Taiwan (85,800 pounds, including decreases of 700 pounds). Exports of 482,500 pounds were to Vietnam (440,000 pounds) and Taiwan (42,500 pounds).
Beef: Net sales of 20,900 MT reported for 2021 were down 8 percent from the previous week, but up 17 percent from the prior 4-week average. Increases were primarily for South Korea (6,600 MT, including decreases of 400 MT), Japan (5,900 MT, including decreases of 800 MT), Mexico (2,100 MT), China (1,800 MT, including decreases of 100 MT), and Taiwan (1,800 MT, including decreases of 100 MT). Exports of 17,800 MT were down 9 percent from the previous week, but up 5 percent from the prior 4-week average. The destinations were primarily to South Korea (5,500 MT), Japan (4,700 MT), China (2,700 MT), Mexico (1,200 MT), and Taiwan (900 MT).
Pork: Net sales of 32,400 MT reported for 2021 were down 46 percent from the previous week and 17 percent from the prior 4-week average. Increases primarily for China (10,700 MT, including decreases of 1,000 MT), Mexico (6,900 MT, including decreases of 500 MT), Japan (3,100 MT, including decreases of 200 MT), South Korea (2,900 MT, including decreases of 700 MT), and Canada (2,800 MT, including decreases of 400 MT), were offset by reductions primarily for Guatemala (400 MT). Exports of 39,300 MT were down 2 percent from the previous week, but up 3 percent from the prior 4-week average. The destinations were primarily to China (11,900 MT), Mexico (10,000 MT), Japan (4,800 MT), South Korea (3,300 MT), and the Philippines (2,000 MT).
Terry Reilly
Senior Commodity Analyst – Grain and Oilseeds
Futures International
One Lincoln Center
18 W 140 Butterfield Rd.
Oakbrook Terrace, Il. 60181
W: 312.604.1366
ICE IM: treilly1
Skype: fi.treilly

Trading of futures, options, swaps and other derivatives is risky and is not suitable for all persons. All of these investment products are leveraged, and you can lose more than your initial deposit. Each investment product is offered only to and from jurisdictions where solicitation and sale are lawful, and in accordance with applicable laws and regulations in such jurisdiction. The information provided here should not be relied upon as a substitute for independent research before making your investment decisions. Futures International, LLC is merely providing this information for your general information and the information does not take into account any particular individual’s investment objectives, financial situation, or needs. All investors should obtain advice based on their unique situation before making any investment decision. The contents of this communication and any attachments are for informational purposes only and under no circumstances should they be construed as an offer to buy or sell, or a solicitation to buy or sell any future, option, swap or other derivative. The sources for the information and any opinions in this communication are believed to be reliable, but Futures International, LLC does not warrant or guarantee the accuracy of such information or opinions. Futures International, LLC and its principals and employees may take positions different from any positions described in this communication. Past results are not necessarily indicative of future results.