PDF attached
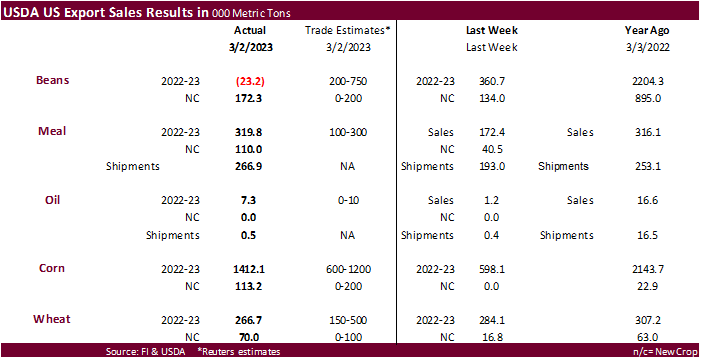
USDA reported a net reduction of 23,200 tons for 2022-23 soybeans and 172,300-ton increase for new-crop sales for the week ending March 2. 2022-23 soybean sales included many switching around for several countries and a net reduction for unknow of 307,600 tons and Pakistan reduction of 132,000 tons. Soybean meal sales were good at 319,800 tons old crop and 110,000 tons new crop. Philippines, Morocco, and Columbia were primary buyers. Soybean oil sales improved to 7,300 tons. US corn export sales were 1.412 million tons, well up from 598,100 tons previous week. Major countries included Japan (469,000 MT, including decreases of 94,800 MT and 101,700 MT – late), South Korea (377,900 MT, including 60,000 MT switched from unknown destinations and decreases of 10,700 MT), unknown destinations (201,300 MT), and Mexico (130,900 MT). Sorghum sales were 155,300 tons and were all for China. Pork sales were 22,100 tons. All-wheat sales of 266,700 tons were slightly above the previous week, and new crop of 70,000 tons compare to 16,800 tons previous week. Increases were primarily for China (137,000 MT, including 130,000 MT switched from unknown destinations), South Korea (87,000 MT), and the Philippines (77,300 MT, including decreases of 2,200 MT).
Export Sales Highlights
This summary is based on reports from exporters for the period February 24 – March 2, 2023.
Wheat: Net sales of 266,700 metric tons (MT) for 2022/2023 were down 6 percent from the previous week, but up 11 percent from the prior 4-week average. Increases primarily for China (137,000 MT, including 130,000 MT switched from unknown destinations), South Korea (87,000 MT), the Philippines (77,300 MT, including decreases of 2,200 MT), Taiwan (49,000 MT), and Tunisia (27,100 MT, including 25,000 MT switched from unknown destinations), were offset by reductions primarily for unknown destinations (173,000 MT). Net sales of 70,000 MT for 2023/2024 were reported for Mexico (41,000 MT), Thailand (28,500 MT), and Colombia (500 MT). Exports of 377,100 MT were down 38 percent from the previous week and 24 percent from the prior 4-week average. The destinations were primarily to China (135,000 MT), Mexico (65,500 MT), the Philippines (58,300 MT), South Korea (55,600 MT), and Tunisia (27,100 MT).
Corn: Net sales of 1,412,100 MT for 2022/2023 were up noticeably from the previous week and up 57 percent from the prior 4-week average. Increases primarily for Japan (469,000 MT, including decreases of 94,800 MT and 101,700 MT – late), South Korea (377,900 MT, including 60,000 MT switched from unknown destinations and decreases of 10,700 MT), unknown destinations (201,300 MT), Mexico (130,900 MT, including decreases of 52,400 MT), and Colombia (83,300 MT, including 46,000 MT switched from unknown destinations and decreases of 98,900 MT), were offset by reductions for Italy (35,000 MT), Costa Rica (1,500 MT), and Panama (200 MT). Total net sales of 113,200 MT for 2023/2024 were for Mexico. Exports of 1,052,000 MT–a marketing-year high–were up 58 percent from the previous week and 74 percent from the prior 4-week average. The destinations were primarily to Mexico (462,900 MT, including 10,200 MT – late), Colombia (169,600 MT), Japan (129,500 MT, including 101,700 MT – late), South Korea (104,900 MT), and Guatemala (39,600 MT).
Optional Origin Sales: For 2022/2023, the current outstanding balance of 190,000 MT were for South Korea (150,000 MT) and Egypt (40,000 MT).
Late Reporting: For 2022/2023, net sales totaling 101,700 MT of corn were reported late for Japan. Exports of 111,900 MT were late to Japan (101,700 MT) and Mexico (10,200 MT).
Barley: Total net sales of 6,000 MT for 2023/2024 were for Japan. No exports were reported for the week.
Sorghum: Total net sales of 155,300 MT for 2022/2023 were up noticeably from the previous week and up 93 percent from the prior 4-week average. Increases were for China, including decreases of 3,700 MT. Exports of 49,300 MT were down 53 percent from the previous week, but up 11 percent from the prior 4-week average. The destination was to China.
Rice: Net sales of 141,900 MT for 2022/2023–a marketing-year high–were up noticeably from the previous week and from the prior 4-week average. Increases were primarily for Colombia (65,000 MT), Haiti (41,300 MT, including decreases of 200 MT), Mexico (24,800 MT), Iraq (4,000 MT), and El Salvador (2,500 MT). Total net sales of 5,000 MT for 2023/2024 were for Mexico. Exports of 173,200 MT–a marketing-year high–were up noticeably from the previous week and from the prior 4-week average. The destinations were primarily to Colombia (59,000 MT), Iraq (44,000 MT), Mexico (26,300 MT), Haiti (22,200 MT), and Guatemala (12,100 MT).
Soybeans: Net sales reductions of 23,200 MT for 2022/2023–a marketing-year low–were down noticeably from the previous week and from the prior 4-week average. Increases primarily for China (178,500 MT, including 172,000 MT switched from unknown destinations and decreases of 3,200 MT), Japan (69,900 MT, including 50,000 MT switched from unknown destinations, decreases of 10,500 MT, and 10,700 MT – late), Mexico (57,200 MT, including decreases of 1,700 MT), Indonesia (49,900 MT, including 30,000 MT switched from unknown destinations and decreases of 200 MT), and Vietnam (25,500 MT, including decreases of 400 MT), were more than offset by reductions for unknown destinations (307,600 MT) and Pakistan (132,000 MT). Net sales of 172,300 MT for 2023/2024 were reported for Pakistan (66,000 MT), China (63,000 MT), Japan (34,500 MT), and unknown destinations (8,800 MT). Exports of 581,000 MT were down 34 percent from the previous week and 62 percent from the prior 4-week average. The destinations were primarily to China (262,200 MT, including 68,400 – late), Mexico (107,700 MT, including 38,400 – late), Japan (99,300 MT, including 10,700 MT – late), Indonesia (49,900 MT), and Vietnam (13,900 MT).
Optional Origin Sales: For 2022/2023, the current outstanding balance of 300 MT, all South Korea.
Export for Own Account: For 2022/2023, the current exports for own account outstanding balance of 1,600 MT are for Canada (1,500 MT) and Taiwan (100 MT).
Export Adjustments: Accumulated exports of soybeans to China were adjusted down 68,396 MT for week ending December 8th. This shipment was reported in error.
Late Reporting: For 2022/2023, net sales totaling 11,100 MT of soybeans were reported late for Japan (10,700 MT) and South Korea (400 MT). Late exports of 124,700 MT were primarily to China (68,400 MT), Mexico (38,400 MT), Japan (10,700 MT), and Colombia (6,900 MT).
Soybean Cake and Meal: Net sales of 319,800 MT for 2022/2023 were up 86 percent from the previous week and 85 percent from the prior 4-week average. Increases primarily for the Philippines (84,300 MT), Morocco (43,700 MT), Colombia (39,600 MT, including decreases of 36,900 MT), Guatemala (32,300 MT, including decreases of 1,400 MT), and Mexico (28,300 MT, including decreases of 5,800 MT), were offset by reductions primarily for unknown destinations (4,000 MT). Net sales of 110,000 MT for 2023/2024 were reported for Ecuador (96,000 MT) and Indonesia (14,000 MT). Exports of 266,900 MT were up 38 percent from the previous week and 11 percent from the prior 4-week average. The destinations were primarily to the Philippines (47,300 MT), Colombia (43,100 MT), Ecuador (32,100 MT), Morocco (23,700 MT), and Venezuela (19,100 MT).
Soybean Oil: Net sales of 7,300 MT for 2022/2023 were up noticeably from the previous week and from the prior 4-week average. Increases reported for Mexico (7,500 MT), were offset by reductions for Canada (200 MT). Exports of 500 MT were up 25 percent from the previous week, but down 75 percent from the prior 4-week average. The destinations were to Canada (400 MT) and Mexico (100 MT).
Cotton: Net sales of 114,500 RB for 2022/2023 were down 33 percent from the previous week and 57 percent from the prior 4-week average. Increases primarily for Vietnam (44,700 RB, including 400 RB switched from South Korea, 100 RB switched from China, and decreases of 2,300 RB), Turkey (17,400 RB, including decreases of 8,300 RB), China (15,300 RB, including 2,600 RB switched from Singapore and decreases of 18,300 RB), Pakistan (11,900 RB, including decreases of 1,100 RB), and Mexico (9,800 RB, including decreases of 100 RB), were offset by reductions primarily for Singapore (2,600 RB), Bangladesh (800 RB), and Nicaragua (700 RB). Net sales reductions of 68,300 RB for 2023/2024 resulting in increases primarily for Mexico (8,100 RB) and Japan (5,300 RB), were more than offset by reductions for Pakistan (87,100 RB). Exports of 287,500 RB were up 38 percent from the previous week and 44 percent from the prior 4-week average. The destinations were primarily to Pakistan (75,100 RB), China (54,400 RB), Vietnam (47,500 RB), Turkey (36,100 RB), and Bangladesh (14,200 RB). Net sales of Pima totaling 3,800 RB for 2022/2023 were up noticeably from the previous week and from the prior 4-week average. Increases were primarily for China (1,500 RB), India (900 RB), Thailand (600 RB), Vietnam (400 RB), and Pakistan (300 RB). Exports of 2,900 RB were down 1 percent from the previous week and 41 percent from the prior 4-week average. The destinations were to China (1,700 RB), Peru (900 RB), Bahrain (100 RB), Thailand (100 RB), and Japan (100 RB).
Optional Origin Sales: For 2022/2023, options were exercised to export 1,900 RB to Malaysia from the United States. The current outstanding balance of 7,300 RB, all Malaysia.
Export for Own Account: For 2022/2023, new exports for own account totaling 900 RB were to China. Exports for own account totaling 7,100 RB to Vietnam (4,900 RB) and Turkey (2,200 RB) were applied to new or outstanding sales. The current exports for own account outstanding balance of 113,900 RB are for China (67,300 RB), Vietnam (34,200 RB), Pakistan (5,000 RB), Turkey (3,500 RB), South Korea (2,400 RB), and India (1,500 RB).
Hides and Skins: Net sales of 299,500 pieces for 2023 were down 23 percent from the previous week and 34 percent from the prior 4-week average. Increases primarily for China (178,300 whole cattle hides, including decreases of 18,000 pieces), Mexico (28,700 whole cattle hides, including decreases of 5,600 pieces), Brazil (25,300 whole cattle hides), South Korea (23,400 whole cattle hides, including decreases of 200 pieces), and Indonesia (21,400 whole cattle hides), were offset by reductions for Taiwan (400 pieces) and Italy (100 pieces). In addition, net sales of 2,600 kip skins resulting in increases for Belgium (2,900 kip skins), were offset by reductions for Japan (200 pieces). Exports of 366,500 pieces were down 29 percent from the previous week and 24 percent from the prior 4-week average. Whole cattle hides exports were primarily to China (267,100 pieces), Mexico (37,200 pieces), South Korea (24,600 pieces), Thailand (14,700 pieces), and Brazil (7,000 pieces).
Net sales of 136,500 wet blues for 2023 were down 10 percent from the previous week, but up 23 percent from the prior 4-week average. Increases primarily for Vietnam (57,600 unsplit and 12,000 grain splits), Thailand (23,200 unsplit, including decreases of 200 pieces), Italy (16,700 unsplit, including decreases of 100 pieces), Hong Kong (13,800 unsplit, including decreases of 200 pieces), and China (8,600 unsplit), were offset by reductions for Japan (600 grain splits) and Brazil (100 grain splits). Total net sales of 13,200 unsplit for 2024 were for Vietnam. Exports of 122,200 wet blues were down 25 percent from the previous week and 19 percent from the prior 4-week average. The destinations were primarily to Italy (32,000 unsplit), China (26,600 unsplit), Vietnam (26,500 unsplit), Thailand (16,500 unsplit), and Hong Kong (9,800 unsplit). Net sales reductions of 2,100 splits were reported for Hong Kong (1,900 pounds) and Vietnam (200 pounds). Exports of 108,500 pounds were to Hong Kong (71,300 pounds) and Vietnam (37,200 pounds).
Beef: Net sales of 5,600 MT for 2023–a marketing-year low–were down 31 percent from the previous week and 67 percent from the prior 4-week average. Increases primarily for Japan (3,200 MT, including decreases of 700 MT), Mexico (1,400 MT, including decreases of 300 MT), China (500 MT, including decreases of 100 MT), Canada (300 MT, including decreases of 100 MT), and Hong Kong (200 MT, including decreases of 200 MT), were offset by reductions for South Korea (1,100 MT). Exports of 13,000 MT were down 19 percent from the previous week and 20 percent from the prior 4-week average. The destinations were primarily to South Korea (3,300 MT), Japan (3,000 MT), China (2,200 MT), Mexico (1,200 MT), and Taiwan (1,000 MT).
Pork: Net sales of 22,100 MT for 2023 were down 29 percent from the previous week and 44 percent from the prior 4-week average. Increases primarily for Mexico (10,700 MT, including decreases of 500 MT), South Korea (3,800 MT, including decreases of 500 MT), Colombia (1,200 MT, including decreases of 100 MT), Chile (1,100 MT), and China (800 MT, including decreases of 300 MT), were offset by reductions for Canada (300 MT). Exports of 30,300 MT were unchanged from the previous week, but up 1 percent from the prior 4-week average. The destinations were primarily to Mexico (13,700 MT), Japan (4,200 MT), China (3,900 MT), South Korea (2,500 MT), and Canada (1,600 MT).
U.S. EXPORT SALES FOR WEEK ENDING 3/2/2023
|
|
CURRENT MARKETING YEAR |
NEXT MARKETING YEAR |
||||||
|
COMMODITY |
NET SALES |
OUTSTANDING SALES |
WEEKLY EXPORTS |
ACCUMULATED EXPORTS |
NET SALES |
OUTSTANDING SALES |
||
|
CURRENT YEAR |
YEAR AGO |
CURRENT YEAR |
YEAR AGO |
|||||
|
|
THOUSAND METRIC TONS |
|||||||
|
WHEAT |
|
|
|
|
|
|
|
|
|
HRW |
65.8 |
682.5 |
1,775.3 |
68.6 |
4,057.6 |
5,655.3 |
0.0 |
112.3 |
|
SRW |
25.7 |
581.2 |
584.6 |
31.8 |
2,117.0 |
2,102.0 |
30.5 |
218.6 |
|
HRS |
64.2 |
953.6 |
1,128.1 |
58.6 |
4,313.0 |
3,895.0 |
39.5 |
89.3 |
|
WHITE |
109.0 |
852.0 |
551.3 |
191.0 |
3,529.3 |
2,709.1 |
0.0 |
43.2 |
|
DURUM |
2.1 |
43.6 |
18.8 |
27.1 |
271.6 |
169.7 |
0.0 |
36.9 |
|
TOTAL |
266.7 |
3,113.0 |
4,058.0 |
377.1 |
14,288.5 |
14,531.2 |
70.0 |
500.3 |
|
BARLEY |
0.0 |
3.9 |
13.8 |
0.0 |
8.0 |
14.7 |
6.0 |
6.0 |
|
CORN |
1,412.1 |
14,568.2 |
22,669.2 |
1,052.0 |
16,081.8 |
27,533.0 |
113.2 |
1,675.8 |
|
SORGHUM |
155.3 |
687.1 |
3,687.4 |
49.3 |
521.0 |
2,987.2 |
0.0 |
0.0 |
|
SOYBEANS |
-23.2 |
6,604.4 |
10,759.6 |
581.0 |
42,117.8 |
41,611.2 |
172.3 |
1,480.1 |
|
SOY MEAL |
319.8 |
2,931.7 |
3,203.5 |
266.9 |
5,113.6 |
5,441.0 |
110.0 |
229.0 |
|
SOY OIL |
7.3 |
27.3 |
172.6 |
0.5 |
32.0 |
409.2 |
0.0 |
0.6 |
|
RICE |
|
|
|
|
|
|
|
|
|
L G RGH |
93.1 |
152.2 |
249.6 |
103.3 |
414.1 |
868.1 |
0.0 |
0.0 |
|
M S RGH |
0.0 |
32.1 |
8.5 |
0.1 |
18.4 |
5.2 |
5.0 |
5.0 |
|
L G BRN |
0.1 |
4.4 |
17.6 |
0.4 |
14.3 |
31.9 |
0.0 |
0.0 |
|
M&S BR |
0.1 |
35.8 |
44.0 |
0.1 |
8.7 |
42.0 |
0.0 |
0.0 |
|
L G MLD |
46.3 |
106.5 |
88.6 |
67.7 |
436.5 |
524.7 |
0.0 |
0.0 |
|
M S MLD |
2.2 |
129.6 |
192.2 |
1.7 |
175.2 |
250.9 |
0.0 |
0.0 |
|
TOTAL |
141.9 |
460.5 |
600.5 |
173.2 |
1,067.2 |
1,722.7 |
5.0 |
5.0 |
|
COTTON |
|
THOUSAND RUNNING BALES |
||||||
|
UPLAND |
114.5 |
4,969.0 |
7,760.1 |
287.5 |
5,674.4 |
5,524.3 |
-68.3 |
1,326.0 |
|
PIMA |
3.8 |
40.2 |
159.0 |
2.9 |
99.8 |
256.9 |
0.0 |
3.5 |
| Terry Reilly Senior Commodity Analyst – Grain and Oilseeds |
| Futures International One Lincoln Center 18W140 Butterfield Rd. Suite 1450 Oakbrook terrace, Il. 60181 |
| Work: 312.604.1366 ICE IM: treilly1 Skype IM: fi.treilly |
| treilly@futures-int.com
|
| DISCLAIMER: The contents of this communication and any attachments are for informational purposes only and under no circumstances should they be construed as an offer to buy or sell, or a solicitation to buy or sell any future, option, swap or other derivative. The sources for the information and any opinions in this communication are believed to be reliable, but Futures International, LLC does not warrant or guarantee the accuracy of such information or opinions. This communication may contain links to third party websites which are not under the control of FI and FI is not responsible for their content. Trading of futures, options, swaps and other derivatives is risky and is not suitable for all persons. All of these investment products are leveraged, and you can lose more than your initial deposit. Each investment product is offered only to and from jurisdictions where solicitation and sale are lawful, and in accordance with applicable laws and regulations in such jurisdiction. The information provided here should not be relied upon as a substitute for independent research before making your investment decisions. Futures International, LLC is merely providing this information for your general information and the information does not take into account any particular individual’s investment objectives, financial situation, or needs. All investors should obtain advice based on their unique situation before making any investment decision. Futures International, LLC and its principals and employees may take positions different from any positions described in this communication. Past results are not necessarily indicative of future results. |