PDF attached
USDA export sales
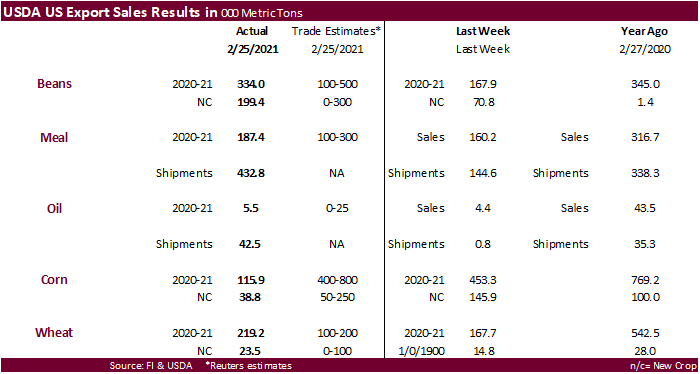
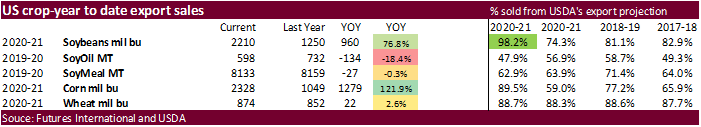
Corn export sales fell well short of expectations for old and new crop. USDA noted for corn “Increases primarily for China (1,054,700 MT, including 1,046,000 MT switched from unknown destinations and decreases of 3,000 MT), Mexico (181,900 MT, including decreases of 1,100 MT), Saudi Arabia (129,300 MT, including 112,900 MT switched from unknown destinations), Japan (108,600 MT, including 118,800 MT switched from unknown destinations and decreases of 68,600 MT), and South Korea (107,800 MT, including 68,000 MT switched from unknown destinations and decreases of 15,400 MT), were offset by reductions primarily for unknown destinations (1,764,900 MT).” Soybean export sales were within expectations with Mexico and Germany taking the bulk of 2020-21. Meal sales of 187,400 tons (Philippines 49,000 tons) were ok but shipments were very excellent at 432,800 tons. Soybean oil sales were poor at 5,500 tons but shipments were good at 42,500 tons. All-wheat export sales were above expectations for this crop-year but at 219,200 tons, they are still viewed as low. Sorghum posted a net reduction of 52,200 tons (all China). Pork sales were excellent at 59,600 tons (China 28,000). Mixed reaction seen for futures post report with emphasis on corn selling.
U.S. EXPORT SALES FOR WEEK ENDING 2/25/2021
|
|
CURRENT MARKETING YEAR |
NEXT MARKETING YEAR |
||||||
|
COMMODITY |
NET SALES |
OUTSTANDING SALES |
WEEKLY EXPORTS |
ACCUMULATED EXPORTS |
NET SALES |
OUTSTANDING SALES |
||
|
CURRENT YEAR |
YEAR |
CURRENT YEAR |
YEAR |
|||||
|
|
THOUSAND METRIC TONS |
|||||||
|
WHEAT |
|
|
|
|
|
|
|
|
|
HRW |
87.4 |
1,335.1 |
1,775.6 |
136.6 |
6,671.9 |
6,828.0 |
0.0 |
252.0 |
|
SRW |
9.4 |
404.6 |
356.7 |
52.5 |
1,329.8 |
1,937.5 |
0.0 |
284.6 |
|
HRS |
68.4 |
1,984.0 |
1,574.6 |
105.8 |
5,108.3 |
5,230.1 |
23.5 |
232.7 |
|
WHITE |
44.0 |
2,285.1 |
1,057.1 |
112.7 |
3,999.9 |
3,591.4 |
0.0 |
80.3 |
|
DURUM |
10.0 |
154.2 |
148.4 |
0.0 |
517.9 |
679.8 |
0.0 |
5.0 |
|
TOTAL |
219.2 |
6,163.0 |
4,912.4 |
407.5 |
17,627.7 |
18,266.9 |
23.5 |
854.6 |
|
BARLEY |
0.0 |
10.6 |
14.9 |
0.4 |
21.7 |
34.3 |
0.0 |
14.5 |
|
CORN |
115.9 |
32,953.6 |
12,261.9 |
2,010.2 |
26,169.9 |
14,380.2 |
38.8 |
1,266.8 |
|
SORGHUM |
-52.2 |
2,843.3 |
668.9 |
72.4 |
3,035.0 |
1,069.9 |
0.0 |
703.0 |
|
SOYBEANS |
334.0 |
7,465.8 |
4,432.3 |
1,160.8 |
52,683.4 |
29,589.0 |
199.4 |
4,863.0 |
|
SOY MEAL |
187.4 |
2,683.4 |
3,421.7 |
432.8 |
5,449.1 |
4,737.5 |
0.0 |
215.1 |
|
SOY OIL |
5.5 |
159.7 |
246.4 |
42.5 |
438.3 |
486.2 |
0.0 |
0.6 |
|
RICE |
|
|
|
|
|
|
|
|
|
L G RGH |
76.6 |
275.6 |
393.7 |
54.4 |
982.4 |
863.9 |
0.0 |
0.0 |
|
M S RGH |
0.0 |
9.9 |
42.8 |
1.5 |
19.0 |
17.5 |
0.0 |
0.0 |
|
L G BRN |
0.1 |
12.9 |
14.2 |
0.1 |
24.0 |
33.7 |
0.0 |
0.0 |
|
M&S BR |
0.7 |
70.7 |
71.7 |
27.2 |
81.7 |
35.8 |
0.0 |
0.0 |
|
L G MLD |
7.3 |
73.7 |
91.7 |
37.5 |
396.8 |
600.5 |
0.0 |
0.0 |
|
M S MLD |
7.7 |
235.0 |
170.7 |
23.3 |
330.1 |
377.2 |
0.0 |
0.0 |
|
TOTAL |
92.3 |
677.8 |
784.8 |
144.0 |
1,834.0 |
1,928.5 |
0.0 |
0.0 |
|
COTTON |
|
THOUSAND RUNNING BALES |
||||||
|
UPLAND |
169.0 |
5,447.9 |
6,997.4 |
377.4 |
8,129.8 |
7,045.5 |
40.6 |
1,196.7 |
|
PIMA |
7.8 |
274.4 |
230.3 |
9.1 |
434.1 |
256.5 |
0.0 |
1.1 |
This summary is based on reports from exporters for the period February 19-25, 2021.
Wheat: Net sales of 219,200 metric tons (MT) for 2020/2021 were up 31 percent from the previous week, but down 51 percent from the prior 4-week average. Increases primarily for Mexico (69,300 MT, including decreases of 1,400 MT), China (65,900 MT, including 65,000 MT switched from unknown destinations and decreases of 100 MT), Nigeria (56,000 MT, including decreases of 1,000 MT), Canada (31,600 MT), and Japan (30,600 MT, including decreases of 200 MT), were offset by reductions primarily for unknown destinations (55,000 MT) and Chile (8,000 MT). For 2021/2022, total net sales of 23,500 MT were for Haiti. Exports of 407,500 MT were up 4 percent from the previous week, but down 5 percent from the prior 4-week average. The destinations were primarily to Mexico (147,800 MT), Indonesia (74,500 MT), Thailand (57,900 MT), Honduras (36,800 MT), and Nigeria (29,000 MT).
Optional Origin Sales: For 2020/2021, the current outstanding balance of 10,000 MT, all Spain.
Corn: Net sales of 115,900 MT for 2020/2021–a marketing-year low–were down 74 percent from the previous week and 96 percent from the prior 4-week average. Increases primarily for China (1,054,700 MT, including 1,046,000 MT switched from unknown destinations and decreases of 3,000 MT), Mexico (181,900 MT, including decreases of 1,100 MT), Saudi Arabia (129,300 MT, including 112,900 MT switched from unknown destinations), Japan (108,600 MT, including 118,800 MT switched from unknown destinations and decreases of 68,600 MT), and South Korea (107,800 MT, including 68,000 MT switched from unknown destinations and decreases of 15,400 MT), were offset by reductions primarily for unknown destinations (1,764,900 MT). For 2021/2022, net sales of 38,800 MT were reported for Mexico (26,800 MT) and Japan (12,000 MT). Exports of 2,010,200 MT–a marketing-year high–were up 69 percent from the previous week and 57 percent from the prior 4-week average. The destinations were primarily to Japan (351,600 MT), China (346,700 MT), Mexico (261,100 MT), South Korea (173,700 MT), and Saudi Arabia (129,300 MT).
Optional Origin Sales: For 2020/2021, decreases totaling 105,000 MT were reported for South Korea (55,000 MT) and unknown destinations (50,000 MT). The current outstanding balance of 1,174,400 MT is for South Korea (793,000 MT), unknown destinations (244,000 MT), Taiwan (70,000 MT), China (65,000 MT), and Ukraine (2,400 MT).
Barley: No net sales were reported for the week. Exports of 400 MT were to Japan (300 MT) and Canada (100 MT).
Sorghum: For 2020/2021, total net sales reductions of 52,200 MT were for China. Exports of 72,400 MT were down 42 percent from the previous week and 49 percent from the prior 4-week average. The destination was China.
Rice: Net sales of 92,300 MT for 2020/2021 were up 14 percent from the previous week and 22 percent from the prior 4-week average. Increases were primarily for Mexico (35,300 MT), Venezuela (31,500 MT), El Salvador (7,000 MT, including decreases of 1,000 MT), the Dominican Republic (4,600 MT), and Guatemala (2,500 MT). Exports of 144,000 MT were up noticeably from the previous week and from the prior 4-week average. The destinations were primarily to Mexico (27,500 MT), South Korea (27,100 MT), Haiti (21,600 MT), Guatemala (14,300 MT), and Japan (13,800 MT).
Soybeans: Net sales of 334,000 MT for 2020/2021 were up noticeably from the previous week, but down 33 percent from the prior 4-week average. Increases primarily for Mexico (139,700 MT, including 34,000 MT switched from unknown destinations and decreases of 1,900 MT), Germany (137,700 MT), Japan (121,800 MT, including 45,000 MT switched from unknown destinations and decreases of 2,600 MT), the Netherlands (68,100 MT, including 60,000 MT switched from unknown destinations), and Bangladesh (56,000 MT, including 55,000 MT switched from unknown destinations), were offset by reductions primarily for unknown destinations (351,400 MT). For 2021/2022, net sales of 199,400 MT were reported for China (198,000 MT) and Canada (1,400 MT). Exports of 1,160,800 MT were up 18 percent from the previous week, but down 22 percent from the prior 4-week average. The destinations were primarily to China (320,600 MT), Germany (137,700 MT), Egypt (115,800 MT), Taiwan (105,700 MT), and Japan (98,500 MT).
Exports for Own Account: The current exports for own account outstanding balance is 5,800 MT, all Canada.
Export Adjustments: Accumulated exports of soybeans to the Netherlands were adjusted down 68,676 MT for week ending February 4th and 69,060 MT for week ending February 18th. The correct destination for these shipments was Germany.
Soybean Cake and Meal: Net sales of 187,400 MT for 2020/2021 were up 17 percent from the previous week, but down 28 percent from the prior 4-week average. Increases primarily for the Philippines (49,000 MT, including decreases of 1,000 MT), Mexico (37,400 MT, including decreases of 22,400 MT), the Dominican Republic (33,800 MT), Canada (21,300 MT, including decreases of 500 MT), and the United Kingdom (19,500 MT, including 17,700 MT switched from unknown destinations), were offset by reductions primarily for unknown destinations (27,700 MT). Exports of 432,800 MT–a marketing-year high–were up noticeably from the previous week and up 80 percent from the prior 4-week average. The destinations were primarily to Mexico (68,000 MT), Vietnam (48,700 MT), the Philippines (48,200 MT), Colombia (42,200 MT), and Chile (36,500 MT).
Soybean Oil: Net sales of 5,500 MT for 2020/2021 were up 25 percent from the previous week and 16 percent from the prior 4-week average. Increases primarily for Guatemala (5,400 MT), El Salvador (1,000 MT), Canada (300 MT), and Trinidad and Tobago (100 MT), were offset by reductions for Colombia (900 MT) and Venezuela (500 MT). Exports of 42,500 MT were up noticeably from the previous week and from the prior 4-week average. The destinations were primarily to Peru (18,900 MT), the Dominican Republic (14,500 MT), Colombia (7,500 MT), Canada (1,000 MT), and Mexico (500 MT).
Cotton: Net sales of 169,000 RB for 2020/2021 were down 32 percent from the previous week and 27 percent from the prior 4-week average. Increases primarily for Vietnam (65,300 RB, including 2,000 RB switched from China, 1,700 RB switched from South Korea, and decreases of 1,700 RB), Pakistan (33,600 RB), China (24,100 RB, including decreases of 100 RB), Indonesia (23,200 RB, including 1,400 RB switched from Japan and decreases 2,800 RB), and Bangladesh (15,900 RB, including decreases of 100 RB), were offset by reductions primarily for Turkey (23,900 RB). For 2021/2022, net sales of 40,600 RB were primarily for Vietnam (15,500 RB), China (13,200 RB), Guatemala (6,500 RB), Pakistan (2,600 RB), and Peru (1,500 RB). Exports of 377,400 RB were up 29 percent from the previous week and 11 percent from the prior 4-week average. Exports were primarily to Vietnam (98,800 RB), China (94,700 RB), Pakistan (49,700 RB), Turkey (27,600 RB), and Indonesia (22,700 RB). Net sales of Pima totaling 7,800 RB were down 34 percent from the previous week and 43 percent from the prior 4-week average. Increases were primarily for China (3,900 RB), Turkey (1,900 RB), India (1,600 RB, including decreases of 100 RB), and Italy (300 RB). Exports of 9,100 RB were down 26 percent from the previous week and 29 percent from the prior 4-week average. The destinations were primarily to China (2,600 RB), Vietnam (2,200 RB), Pakistan (1,100 RB), Peru (1,100 RB), and India (900 RB).
Exports for Own Account: For 2020/2021, new exports for own account totaling 13,900 RB were to Vietnam (10,600 RB), China (2,000 RB), Malaysia (1,100 RB), and Bangladesh (200 RB). Exports for own account totaling 6,500 RB to Vietnam (4,400 RB), China (1,700 RB), and Bangladesh (400 RB) were applied to new or outstanding sales. The current exports for own account outstanding balance of 40,500 RB is for China (28,200 RB), Vietnam (10,800 RB), Malaysia (1,100 RB), and Bangladesh (400 RB).
Hides and Skins: Net sales of 359,700 pieces for 2021 were up 71 percent from the previous week and 6 percent from the prior 4-week average. Increases primarily for China (240,500 whole cattle hides, including decreases of 15,300 pieces), South Korea (53,000 whole cattle hides, including decreases of 1,700 pieces), Thailand (21,200 whole cattle hides, including decreases of 400 pieces), Taiwan (16,600 whole cattle hides), and Cambodia (9,800 whole cattle hides, including decreases of 700 pieces), were offset by reductions for Japan (100 pieces). Total net sales of 5,000 calf skins were for Italy, including decreases of 800 pieces. In addition, total net sales of 1,000 kip skins were for Belgium, including decreases of 1,000 pieces. Exports of 392,100 pieces for 2021 were up 29 percent from the previous week and 10 percent from the prior 4-week average. Whole cattle hides exports were primarily to China (281,300 pieces), South Korea (54,300 pieces), Mexico (28,000 pieces), Thailand (7,700 pieces), and Brazil (6,800 pieces). Exports of 1,800 calf skins were to Italy. Additionally, exports of 2,600 kip skins were to Belgium.
Net sales of 75,700 wet blues for 2021 were up noticeably from the previous week, but down 28 percent from the prior 4-week average. Increases primarily for China (29,800 unsplit, including decreases of 600 unsplit and 600 grain splits), Brazil (19,600 unsplit), Vietnam (16,300 unsplit), the Dominican Republic (6,400 unsplit), and Japan (4,300 unsplit), were offset by reductions for China (500 grain splits) and Italy (300 unsplit). Exports of 94,200 wet blues for 2021 were up 34 percent from the previous week, but down 25 percent from the prior 4-week average. The destinations were primarily to Italy (23,100 unsplit and 10,600 grain splits), Vietnam (26,300 unsplit), China (22,700 unsplit), Mexico (2,100 grain splits and 1,000 unsplit), and Brazil (2,900 unsplit). Net sales of 496,600 splits resulting in increases for Vietnam (398,000 pounds) and Taiwan (128,300 pounds, including decreases of 1,500 pounds), were offset by reductions for China (29,700 pounds). Exports of 377,500 pounds were to China (175,700 pounds), Vietnam (160,000 pounds), and Taiwan (41,800 pounds).
Beef: Net sales of 22,600 MT reported for 2021 were up noticeably from the previous week and up 15 percent from the prior 4-week average. Increases primarily for South Korea (6,800 MT, including decreases of 500 MT), China (4,500 MT), Japan (3,800 MT, including decreases of 500 MT), Taiwan (2,400 MT, including decreases of 100 MT), and Mexico (2,000 MT, including decreases of 100 MT), were offset by reductions primarily for the Philippines (100 MT). Exports of 19,700 MT were up 30 percent from the previous week and 20 percent from the prior 4-week average. The destinations were primarily to Japan (5,700 MT), South Korea (5,000 MT), China (3,100 MT), Mexico (1,700 MT), and Taiwan (1,100 MT).
Pork: Net sales of 59,600 MT reported for 2021 were up noticeably from the previous week and up 68 percent from the prior 4-week average. Increases were primarily for China (28,000 MT, including decreases of 1,300 MT), Mexico (14,500 MT, including decreases of 1,100 MT), Japan (4,600 MT, including decreases 400 MT), Canada (2,700 MT, including decreases of 400 MT), and South Korea (2,200 MT, including decreases of 1,800 MT). Exports of 40,000 MT were up 13 percent from the previous week and 6 percent from the prior 4-week average. The destinations were primarily to China (13,400 MT), Mexico (9,100 MT), Japan (4,600 MT), South Korea (2,500 MT), and Canada (2,100 MT).
March 4, 2021 1 FOREIGN AGRICULTURAL SERVICE/USDA
Terry Reilly
Senior Commodity Analyst – Grain and Oilseeds
Futures International
One Lincoln Center
18 W 140 Butterfield Rd.
Oakbrook Terrace, Il. 60181
W: 312.604.1366
ICE IM: treilly1
Skype: fi.treilly

Trading of futures, options, swaps and other derivatives is risky and is not suitable for all persons. All of these investment products are leveraged, and you can lose more than your initial deposit. Each investment product is offered only to and from jurisdictions where solicitation and sale are lawful, and in accordance with applicable laws and regulations in such jurisdiction. The information provided here should not be relied upon as a substitute for independent research before making your investment decisions. Futures International, LLC is merely providing this information for your general information and the information does not take into account any particular individual’s investment objectives, financial situation, or needs. All investors should obtain advice based on their unique situation before making any investment decision. The contents of this communication and any attachments are for informational purposes only and under no circumstances should they be construed as an offer to buy or sell, or a solicitation to buy or sell any future, option, swap or other derivative. The sources for the information and any opinions in this communication are believed to be reliable, but Futures International, LLC does not warrant or guarantee the accuracy of such information or opinions. Futures International, LLC and its principals and employees may take positions different from any positions described in this communication. Past results are not necessarily indicative of future results.