PDF attached
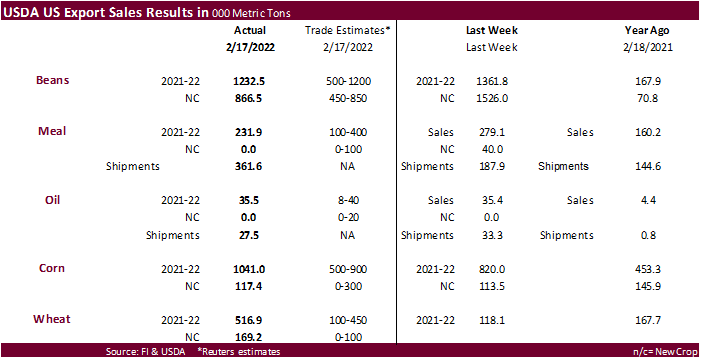
USDA export sales were within expectations for the soybean complex and slightly above for grains. Soybean sales of 1.233 million tons were slightly lower from previous week. Egypt bought 379,300 tons of soybeans (50k switched from unknown) and China booked 291,400 tons of soybeans (172k switched from unknown). SBO sales of 35,500 tons stood out with India booking 30,000 tons, switched from unknown, confirming earlier speculation. Soybean meal sales of 231,900 tons included Philippines, Ireland and other routine buyers. Corn export sales were 1.041 million tons, up from 820,000 tons previous week. Sorghum sales of 60,500 tons were mainly for China. All-wheat sales of 516,900 tons were up from 118,100 tons previous week, with increases for routine buyers.
U.S. EXPORT SALES FOR WEEK ENDING 2/17/2022
|
|
CURRENT MARKETING YEAR |
NEXT MARKETING YEAR |
||||||
|
COMMODITY |
NET SALES |
OUTSTANDING SALES |
WEEKLY EXPORTS |
ACCUMULATED EXPORTS |
NET SALES |
OUTSTANDING SALES |
||
|
CURRENT YEAR |
YEAR |
CURRENT YEAR |
YEAR |
|||||
|
|
THOUSAND METRIC TONS |
|||||||
|
WHEAT |
|
|
|
|
|
|
|
|
|
HRW |
270.4 |
1,869.7 |
1,384.2 |
226.1 |
5,367.0 |
6,535.4 |
103.5 |
171.3 |
|
SRW |
68.6 |
641.7 |
447.7 |
37.8 |
2,001.1 |
1,277.3 |
54.9 |
190.5 |
|
HRS |
99.2 |
1,050.6 |
2,021.4 |
168.2 |
3,722.2 |
5,002.5 |
10.8 |
71.8 |
|
WHITE |
77.7 |
618.3 |
2,353.8 |
77.7 |
2,541.7 |
3,887.2 |
0.0 |
67.0 |
|
DURUM |
1.0 |
19.8 |
144.2 |
36.8 |
149.9 |
517.9 |
0.0 |
47.0 |
|
TOTAL |
516.9 |
4,200.1 |
6,351.3 |
546.6 |
13,782.0 |
17,220.2 |
169.2 |
547.6 |
|
BARLEY |
0.0 |
13.8 |
11.1 |
0.0 |
14.7 |
21.3 |
0.0 |
0.0 |
|
CORN |
1,040.9 |
23,354.5 |
34,847.9 |
1,886.2 |
24,218.9 |
24,159.7 |
117.4 |
1,682.9 |
|
SORGHUM |
60.5 |
3,923.0 |
2,967.8 |
256.8 |
2,642.5 |
2,962.6 |
0.0 |
0.0 |
|
SOYBEANS |
1,232.5 |
9,284.1 |
8,292.6 |
1,260.1 |
40,025.3 |
51,445.6 |
866.5 |
5,365.8 |
|
SOY MEAL |
231.9 |
3,188.1 |
2,928.8 |
361.6 |
5,044.9 |
5,016.4 |
0.0 |
174.7 |
|
SOY OIL |
35.5 |
179.5 |
196.7 |
27.5 |
379.0 |
395.8 |
0.0 |
0.0 |
|
RICE |
|
|
|
|
|
|
|
|
|
L G RGH |
60.8 |
272.3 |
253.4 |
87.8 |
815.8 |
928.0 |
0.0 |
0.0 |
|
M S RGH |
0.0 |
9.0 |
11.4 |
0.4 |
4.6 |
17.5 |
0.0 |
0.0 |
|
L G BRN |
0.3 |
19.3 |
12.9 |
0.9 |
30.1 |
23.8 |
0.0 |
0.0 |
|
M&S BR |
0.2 |
44.1 |
97.3 |
1.2 |
41.5 |
54.5 |
0.0 |
0.0 |
|
L G MLD |
17.8 |
83.6 |
103.9 |
10.4 |
494.0 |
359.3 |
0.0 |
0.0 |
|
M S MLD |
5.1 |
168.1 |
250.6 |
16.1 |
234.0 |
306.7 |
0.0 |
0.0 |
|
TOTAL |
84.2 |
596.5 |
729.6 |
116.8 |
1,620.0 |
1,690.0 |
0.0 |
0.0 |
|
COTTON |
|
THOUSAND RUNNING BALES |
||||||
|
UPLAND |
247.2 |
7,732.7 |
5,656.2 |
376.1 |
4,848.9 |
7,752.4 |
218.2 |
2,062.6 |
|
PIMA |
4.9 |
184.5 |
275.7 |
18.0 |
223.3 |
425.1 |
0.2 |
12.8 |
This summary is based on reports from exporters for the period February 11-17, 2022.
Wheat: Net sales of 516,900 metric tons (MT) for 2021/2022 were up noticeably from the previous week and from the prior 4-week average. Increases primarily for Mexico (151,000 MT, including decreases of 6,500 MT), Nigeria (141,600 MT, including 30,000 MT switched from unknown destinations and decreases of 46,000 MT), South Korea (90,000 MT), Japan (87,300 MT), and El Salvador (52,300 MT, including 12,900 MT switched from unknown destinations, 1,900 MT switched from Costa Rica, and decreases of 900 MT), were offset by reductions primarily for unknown destinations (88,000 MT) and Peru (35,000 MT). Net sales of 169,200 MT for 2022/2023 were primarily for Nigeria (60,000 MT), El Salvador (47,000 MT), Mexico (43,100 MT), Honduras (7,000 MT), and Belize (5,000 MT). Exports of 546,600 MT were up 33 percent from the previous week and 42 percent from the prior 4-week average. The destinations were primarily to Japan (90,600 MT), Nigeria (83,600 MT), Mexico (81,000 MT), Taiwan (56,300 MT), and South Korea (55,000 MT).
Corn: Net sales of 1,040,900 MT for 2021/2022 were up 27 percent from the previous week and 4 percent from the prior 4-week average. Increases primarily for Japan (260,400 MT, including 147,900 MT switched from unknown destinations and decreases of 14,000 MT), Mexico (178,400 MT, including decreases of 42,600 MT), Colombia (127,500 MT, including decreases of 19,900 MT), Costa Rica (115,600 MT), and unknown destinations (90,600 MT), were offset by reductions for Jamaica (22,400 MT) and Guatemala (8,800 MT). Total net sales for 2022/2023 of 117,400 MT were for Japan. Exports of 1,886,200 MT–a marketing-year high–were up 17 percent from the previous week and 41 percent from the prior 4-week average. The destinations were primarily to China (555,200 MT), Japan (388,100 MT), Mexico (351,700 MT), Canada (172,500 MT), and Guatemala (101,200 MT).
Optional Origin Sales: For 2021/2022, the current outstanding balance of 220,800 MT is for unknown destinations (115,000 MT), South Korea (65,000 MT), Italy (31,800 MT), and Saudi Arabia (9,000 MT). For 2022/2023, the current outstanding balance of 3,900 MT is for Italy.
Barley: No net sales or exports were reported for the week.
Sorghum: Net sales of 60,500 MT for 2021/2022 were down 59 percent from the previous week and 65 percent from the prior 4-week average. Increases reported for China (125,500 MT, including 65,000 MT switched from unknown destinations and decreases of 16,200 MT), were offset by reductions for unknown destinations (65,000 MT). Exports of 256,800 MT were up 81 percent from the previous week and up noticeably from the prior 4-week average. The destinations were to China (255,700 MT) and Mexico (1,100 MT).
Rice: Net sales of 84,200 MT for 2021/2022 were up noticeably from the previous week, but down 25 percent from the prior 4-week average. Increases primarily for Mexico (53,700 MT), Haiti (15,200 MT, including decreases of 100 MT), El Salvador (6,000 MT, including 500 MT switched from Honduras), Costa Rica (5,000 MT), and Canada (2,400 MT), were offset by reductions for Honduras (1,500 MT). Exports of 116,800 MT–a marketing-year high–were up 87 percent from the previous week and 77 percent from the prior 4-week average. The destinations were primarily to Colombia (46,000 MT), Mexico (33,200 MT), Japan (13,400 MT), Haiti (7,100 MT), and El Salvador (5,500 MT).
Exports for Own Account: For 2021/2022, new exports for own account totaling 100 MT were to Canada. The current exports for own account outstanding balance is 100 MT, all Canada.
Soybeans: Net sales of 1,232,500 MT for 2021/2022 were down 6 percent from the previous week and 1 percent from the prior 4-week average. Increases primarily for Egypt (379,300 MT, including 50,000 MT switched from unknown destinations, decreases of 300 MT, and 240,000 MT – late), China (291,400 MT, including 172,000 MT switched from unknown destinations and decreases of 1,100 MT), Mexico (93,900 MT, including decreases of 1,500 MT), Japan (75,800 MT, including 51,300 MT switched from unknown destinations and decreases of 2,000 MT), and Germany (68,800 MT), were offset by reductions for Nepal (100 MT). Net sales of 866,500 MT for 2022/2023 reported for China (601,000 MT), unknown destinations (192,000 MT), Mexico (47,500 MT), and Norway (31,000 MT), were offset by reductions primarily for Taiwan (4,000 MT). Exports of 1,260,100 MT were up 8 percent from the previous week, but down 5 percent from the prior 4-week average. The destinations were primarily to China (393,000 MT), Egypt (320,300 MT), Mexico (135,400 MT), Germany (66,800 MT), and Japan (57,800 MT).
Export for Own Account: For 2021/2022, the current exports for own account outstanding balance is 3,000 MT, all Canada.
Export Adjustment: Accumulated exports of soybeans to the Netherlands were adjusted down 44,597 MT for week ending February 10th. The correct destination for this shipment is Germany.
Late Reporting: For 2021/2022, net sales totaling 240,000 MT of soybeans were reported late for Egypt. For 2022/2023, net sales totaling 105,000 MT of soybeans were reported late for Egypt.
Soybean Cake and Meal: Net sales of 231,900 MT for 2021/2022 were down 17 percent from the previous week and 36 percent from the prior 4-week average. Increases primarily for the Philippines (47,300 MT), Ireland (30,000 MT), Costa Rica (26,400 MT, including decreases of 2,900 MT), Nicaragua (24,000 MT), and Mexico (22,800 MT), were offset by reductions for Jamaica (11,500 MT), Guatemala (10,400 MT), and Belgium (3,200 MT). Exports of 361,600 MT were up 92 percent from the previous week and 35 percent from the prior 4-week average. The destinations were primarily to the Philippines (96,200 MT), Ecuador (65,900 MT), Guatemala (40,100 MT), Colombia (39,000 MT), and Mexico (30,700 MT).
Soybean Oil: Net sales of 35,500 MT for 2021/2022 were unchanged from the previous week, but up noticeably from the prior 4-week average. Increases primarily for India (30,000 MT switched from unknown destinations), Bangladesh (18,000 MT), Venezuela (6,500 MT), Mexico (5,200 MT), and Colombia (4,000 MT), were offset by reductions for unknown destinations (30,000 MT). Exports of 27,500 MT were down 17 percent from the previous week, but up 14 percent from the prior 4-week average. The destinations were primarily to Inia (20,000 MT), Haiti (3,500 MT), Mexico (2,000 MT), Canada (800 MT), and Trinidad (700 MT).
Cotton: Net sales of 247,200 RB for 2021/2022 were up 56 percent from the previous week, but down 7 percent from the prior 4-week average. Increases were primarily for China (92,000 RB, including 5,400 RB – late), Pakistan (25,700 RB, including 4,400 RB – late), Turkey (24,400 RB, including decreases of 1,300 RB), Vietnam (19,700 RB, including 1,100 RB switched from Japan), and Peru (14,600 RB). Net sales of 218,200 RB for 2022/2023 were primarily for Pakistan (94,700 RB), Bangladesh (43,600 RB), Indonesia (30,800 RB), Mexico (23,600 RB), and Turkey (17,600 RB). Exports of 376,100 RB–a marketing-year high–were up 39 percent from the previous week and 41 percent from the prior 4-week average. The destinations were primarily to China (172,400 RB, including 10,700 RB – late), Vietnam (55,500 RB), Pakistan (33,300 RB, including 2,100 RB – late), Turkey (32,800 RB, including 4,300 RB – late), and Mexico (21,700 RB). Net sales of Pima totaling 4,900 RB were up 61 percent from the previous week, but down 1 percent from the prior 4-week average. Increases were primarily for China (3,300 RB), India (800 RB), and Vietnam (400 RB). Total net sales for 2022/2023 of 200 RB were for Italy. Exports of 18,000 RB were up noticeably from the previous week and up 65 percent from the prior 4-week average. The destinations were primarily to India (10,500 RB), Peru (3,100 RB), China (1,900 RB), Vietnam (1,600 RB), and Pakistan (400 RB).
Optional Origin Sales: For 2021/2022, the current outstanding balance of 61,600 RB is for Vietnam (52,800 RB) and Pakistan (8,800 RB).
Exports for Own Account: For 2021/2022, the current exports for own account outstanding balance is 100 RB, all Vietnam.
Late Reporting: For 2021/2022, net sales totaling 10,200 MT of upland cotton were reported late for China (5,400 RB), Pakistan (4,400 RB), and Italy (400 RB). Exports totaling 18,100 MT of upland cotton were reported late to China (10,700 RB), Turkey (4,300 RB), Pakistan (2,100 RB), India (600 RB), and Peru (400 RB).
Hides and Skins: Net sales of 379,700 pieces for 2022 were down 13 percent from the previous week and 18 percent from the prior 4-week average. Increases primarily for China (178,000 whole cattle hides, including decreases of 24,700 pieces), Thailand (50,400 whole cattle hides, including decreases of 3,400 pieces), South Korea (50,000 whole cattle hides, including decreases of 1,900 pieces), Mexico (39,900 whole cattle hides, including decreases of 500 pieces), and Taiwan (27,500 whole cattle hides, including decreases of 100 pieces), were offset by reductions for Vietnam (100 pieces). Total net sales of 2,600 kip skins, including decreases of 300 pieces, were for Belgium. Exports of 403,400 pieces were down 3 percent from the previous, but up 6 percent from the prior 4-week average. Whole cattle hides exports were primarily to China (237,100 pieces, including 7,800 pieces – late), South Korea (60,100 pieces), Thailand (36,700 pieces), Mexico (28,500 pieces), and Taiwan (9,200 pieces). In addition, exports of 2,600 kip skins were to Belgium.
Net sales of 113,600 wet blues for 2022 were down 25 percent from the previous week and 27 percent from the prior 4-week average. Increases primarily for Vietnam (56,900 unsplit), China (20,400 unsplit), Italy (16,000 grain splits, 2,300 unsplit, including decreases of 100 unsplit and 100 grain splits), Thailand (10,000 unsplit), and Mexico (3,400 unsplit), were offset by reductions for Portugal (300 grain splits). Exports of 111,000 wet blues were down 34 percent from the previous week and 24 percent from the prior 4-week average. The destinations were primarily to Vietnam (37,900 unsplit and 1,300 grain splits), Italy (33,600 unsplit and 3,000 grain splits), China (22,000 unsplit), Mexico (3,400 unsplit), and the Dominican Republic (3,200 unsplit). Net sales of 325,200 splits reported for South Korea (296,300 pounds, including decreases of 3,800 pounds) and China (44,000 pounds), were offset by reductions for Vietnam (15,100 pounds). Exports of 364,100 pounds were to Vietnam (320,000 pounds) and China (44,100 pounds).
Late Reporting: For 2022, exports totaling 7,800 pieces of hides and skins were reported late to China.
Beef: Net sales of 14,500 MT for 2022 were down 37 percent from the previous week and 25 percent from the prior 4-week average. Increases were primarily for Japan.
decreases of 400 MT), South Korea (2,300 MT, including decreases of 600 MT), China (1,900 MT, including decreases of 100 MT), Taiwan (1,500 MT, including decreases of 100 MT), and Indonesia (1,000 MT). Exports of 15,300 MT were down 7 percent from the previous week and 2 percent from the prior 4-week average. The destinations were primarily to Japan (4,400 MT), South Korea (4,200 MT), China (2,200 MT), Taiwan (1,100 MT), and Mexico (1,000 MT).
Pork: Net sales of 26,600 MT for 2022 were up 45 percent from the previous week, but down 8 percent from the prior 4-week average. Increases primarily for Mexico (12,800 MT, including decreases of 500 MT), Canada (6,700 MT, including decreases of 400 MT), Japan (3,100 MT, including decreases of 100 MT), the Dominican Republic (1,100 MT, including decreases of 100 MT), and Honduras (900 MT), were offset by reductions for Nicaragua (100 MT). Exports of 30,200 MT were down 3 percent from the previous week and from the prior 4-week average. The destinations were primarily to Mexico (14,000 MT), Japan (4,200 MT), China (3,700 MT), South Korea (2,700 MT), and Canada (1,400 MT).
Terry Reilly
Senior Commodity Analyst – Grain and Oilseeds
Futures International
One Lincoln Center
18 W 140 Butterfield Rd.
Oakbrook Terrace, Il. 60181
W: 312.604.1366
ICE IM: treilly1
Skype: fi.treilly

Trading of futures, options, swaps and other derivatives is risky and is not suitable for all persons. All of these investment products are leveraged, and you can lose more than your initial deposit. Each investment product is offered only to and from jurisdictions where solicitation and sale are lawful, and in accordance with applicable laws and regulations in such jurisdiction. The information provided here should not be relied upon as a substitute for independent research before making your investment decisions. Futures International, LLC is merely providing this information for your general information and the information does not take into account any particular individual’s investment objectives, financial situation, or needs. All investors should obtain advice based on their unique situation before making any investment decision. The contents of this communication and any attachments are for informational purposes only and under no circumstances should they be construed as an offer to buy or sell, or a solicitation to buy or sell any future, option, swap or other derivative. The sources for the information and any opinions in this communication are believed to be reliable, but Futures International, LLC does not warrant or guarantee the accuracy of such information or opinions. Futures International, LLC and its principals and employees may take positions different from any positions described in this communication. Past results are not necessarily indicative of future results.