PDF attached
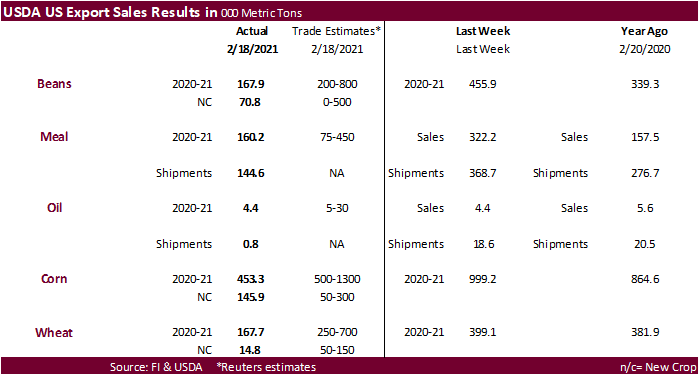
USDA export sales were well below expectations for soybeans and we saw the market sell off after 167,900 tons old crop and 70,800 tons posted. Soybean meal sales were a poor 160,200 tons and soybean oil sales were only 4,400 tons. SBO futures are holding some of its overnight gains while meal futures turned lower. Corn export sales were below expectations for old crop at 453,300 tons and new-crop came in at 145,900 tons, within expectations. All-wheat export sales were 167,700 tons, below trade expectations. Corn and most wheat contracts were trading at session lows just before the electronic pause.
U.S. EXPORT SALES FOR WEEK ENDING 2/18/2021
|
|
CURRENT MARKETING YEAR |
NEXT MARKETING YEAR |
||||||
|
COMMODITY |
NET SALES |
OUTSTANDING SALES |
WEEKLY EXPORTS |
ACCUMULATED EXPORTS |
NET SALES |
OUTSTANDING SALES |
||
|
CURRENT YEAR |
YEAR |
CURRENT YEAR |
YEAR |
|||||
|
|
THOUSAND METRIC TONS |
|||||||
|
WHEAT |
|
|
|
|
|
|
|
|
|
HRW |
40.6 |
1,384.2 |
1,859.7 |
87.2 |
6,535.4 |
6,586.6 |
0.0 |
252.0 |
|
SRW |
22.0 |
447.7 |
363.6 |
13.2 |
1,277.3 |
1,874.2 |
4.5 |
284.6 |
|
HRS |
59.4 |
2,021.4 |
1,537.0 |
95.9 |
5,002.5 |
5,051.3 |
10.0 |
209.2 |
|
WHITE |
48.7 |
2,353.8 |
1,110.1 |
171.4 |
3,887.2 |
3,426.2 |
0.3 |
80.3 |
|
DURUM |
-3.0 |
144.2 |
148.4 |
25.0 |
517.9 |
679.8 |
0.0 |
5.0 |
|
TOTAL |
167.7 |
6,351.3 |
5,018.8 |
392.8 |
17,220.2 |
17,618.1 |
14.8 |
831.1 |
|
BARLEY |
-0.2 |
11.1 |
15.5 |
1.3 |
21.3 |
33.7 |
0.0 |
14.5 |
|
CORN |
453.3 |
34,847.9 |
12,377.3 |
1,190.1 |
24,159.7 |
13,495.6 |
145.9 |
1,227.9 |
|
SORGHUM |
-0.7 |
2,967.8 |
690.5 |
125.6 |
2,962.6 |
976.7 |
0.0 |
703.0 |
|
SOYBEANS |
167.9 |
8,292.6 |
4,782.8 |
1,053.7 |
51,660.3 |
28,919.5 |
70.8 |
4,663.7 |
|
SOY MEAL |
160.2 |
2,928.8 |
3,443.3 |
144.6 |
5,016.4 |
4,399.2 |
0.0 |
215.1 |
|
SOY OIL |
4.4 |
196.7 |
238.1 |
0.8 |
395.8 |
450.9 |
0.0 |
0.6 |
|
RICE |
|
|
|
|
|
|
|
|
|
L G RGH |
10.3 |
253.4 |
415.1 |
28.8 |
928.0 |
831.8 |
0.0 |
0.0 |
|
M S RGH |
0.0 |
11.4 |
42.8 |
0.3 |
17.5 |
17.5 |
0.0 |
0.0 |
|
L G BRN |
0.1 |
12.9 |
11.5 |
0.2 |
23.8 |
33.2 |
0.0 |
0.0 |
|
M&S BR |
0.1 |
97.3 |
57.2 |
0.1 |
54.5 |
33.5 |
0.0 |
0.0 |
|
L G MLD |
18.8 |
103.9 |
107.9 |
2.9 |
359.3 |
581.1 |
0.0 |
0.0 |
|
M S MLD |
51.8 |
250.6 |
174.5 |
24.6 |
306.7 |
369.0 |
0.0 |
0.0 |
|
TOTAL |
81.1 |
729.6 |
809.0 |
57.0 |
1,690.0 |
1,866.1 |
0.0 |
0.0 |
|
COTTON |
|
THOUSAND RUNNING BALES |
||||||
|
UPLAND |
247.8 |
5,656.2 |
7,080.1 |
292.4 |
7,752.4 |
6,567.3 |
40.7 |
1,156.1 |
|
PIMA |
11.9 |
275.7 |
237.0 |
12.2 |
425.1 |
240.6 |
0.0 |
1.1 |
This summary is based on reports from exporters for the period February 12-18, 2021.
Wheat: Net sales of 167,700 metric tons (MT) for 2020/2021–a marketing-year low–were down 58 percent from the previous week and 67 percent from the prior 4-week average. Increases primarily for Bangladesh (55,000 MT, switched from unknown destinations), Mexico (53,500 MT), Japan (52,400 MT), the Philippines (50,000 MT), and Italy (25,000 MT, switched from unknown destinations), were offset by reductions primarily for unknown destinations (83,000 MT). For 2021/2022, net sales of 14,800 MT were reported for unknown destinations (14,500 MT) and Hong Kong (300 MT). Exports of 392,800 MT were up 4 percent from the previous week, but down 14 percent from the prior 4-week average. The destinations were primarily to China (69,700 MT), Mexico (65,300 MT), Nigeria (48,200 MT), Malaysia (39,500 MT), and Ecuador (38,300 MT).
Optional Origin Sales: For 2020/2021, the current outstanding balance of 10,000 MT, all Spain.
Corn: Net sales of 453,300 MT for 2020/2021–a marketing-year low–were down 55 percent from the previous week and 85 percent from the prior 4-week average. Increases primarily for Peru (160,300 MT, including 88,000 MT switched from unknown destinations and decreases of 1,400 MT), Vietnam (146,200 MT, including 68,000 MT switched from China and 68,000 MT switched from unknown destinations), Japan (96,500 MT, including 71,600 MT switched from unknown destinations and decreases of 55,900 MT), Mexico (85,700 MT, including decreases of 15,600 MT), and South Korea (69,400 MT, including 65,000 MT switched from unknown destinations), were offset by reductions primarily for unknown destinations (300,500 MT). For 2021/2022, net sales of 145,900 MT were reported for Mexico (90,000 MT) and Japan (55,900 MT). Exports of 1,190,100 MT were down 14 percent from the previous week and 11 percent from the prior 4-week average. The destinations were primarily to Mexico (321,100 MT), Japan (226,700 MT), Vietnam (146,200 MT), China (144,300 MT), and Peru (110,300 MT).
Optional Origin Sales: For 2020/2021, new optional origin sales of 69,000 MT were reported for South Korea. The current outstanding balance of 1,279,400 MT is for South Korea (848,000 MT), unknown destinations (294,000 MT), Taiwan (70,000 MT), China (65,000 MT), and Ukraine (2,400 MT).
Export Adjustments: Accumulated export of corn to Vietnam were adjusted down 471 MT for week ending February 4th. This shipment was reported in error.
Barley: For 2020/2021, net sales reductions of 200 MT resulting in increases for Japan (200 MT), were offset by reductions for Canada (400 MT). Exports of 1,300 MT were to Japan (1,200 MT) and Canada (100 MT).
Sorghum: For 2020/2021, total net sales reductions of 700 MT, down noticeably from the previous week and from the prior 4-week average, were for China, including decreases of 3,900 MT. Exports of 125,600 MT were up 70 percent from the previous week, but down 10 percent from the prior 4-week average. The destination was China.
Rice: Net sales of 81,100 MT for 2020/2021 were down 19 percent from the previous week and 12 percent from the prior 4-week average. Increases primarily for Japan (48,700 MT), Venezuela (18,300 MT, including 18,000 MT switched from Mexico), the Dominican Republic (10,000 MT), Haiti (7,100 MT), and Panama (1,300 MT), were offset by reductions primarily for Mexico (8,700 MT). Exports of 57,000 MT were up 26 percent from the previous week and 18 percent from the prior 4-week average. The destinations were primarily to Venezuela (27,500 MT), Japan (13,400 MT), Haiti (4,500 MT), Mexico (3,600 MT), and Jordan (3,400 MT).
Soybeans: Net sales of 167,900 MT for 2020/2021 were down 63 percent from the previous week and 72 percent from the prior 4-week average. Increases primarily for the Netherlands (139,100 MT, including 120,000 MT switched from unknown destinations), Japan (77,700 MT, including 67,300 MT switched from unknown destinations and decreases of 1,600 MT), Germany (75,200 MT), Bangladesh (58,200 MT, including 55,000 MT switched from unknown destinations), and Spain (57,500 MT, including 55,000 MT switched from unknown destinations), were offset by reductions primarily for unknown destinations (300,800 MT). For 2021/2022, net sales of 70,800 MT were reported for China (66,000 MT) and Japan (4,800 MT). Exports of 1,053,700 MT were up 5 percent from the previous week, but down 42 percent from the prior 4-week average. The destinations were primarily to China (223,900 MT), the Netherlands (139,100 MT), Mexico (114,800 MT), Egypt (105,100 MT), and Japan (87,500 MT).
Exports for Own Account: The current exports for own account outstanding balance is 5,800 MT, all Canada.
Export Adjustments: Accumulated exports of soybeans to the Netherlands were adjusted down 75,240 MT for week ending February 4th. The correct destination for this shipment is Germany.
Soybean Cake and Meal: Net sales of 160,200 MT for 2020/2021 were down 50 percent from the previous week and 38 percent from the prior 4-week average. Increases primarily for the Philippines (47,300 MT), Honduras (44,700 MT), Colombia (24,900 MT, including 15,900 MT switched from unknown destinations and decreases of 5,100 MT), Mexico (21,700 MT), and Canada (7,600 MT, including decreases of 1,000 MT), were offset by reductions primarily for unknown destinations (17,000 MT). Exports of 144,600 MT were down 61 percent from the previous week and 51 percent from the prior 4-week average. The destinations were primarily to the Philippines (48,000 MT), Mexico (16,600 MT), Colombia (15,900 MT), Morocco (12,900 MT), and Canada (12,300 MT).
Soybean Oil: Net sales of 4,400 MT for 2020/2021 were up 1 percent from the previous week, but down 48 percent from the prior 4-week average. Increases were primarily for Venezuela (1,500 MT), the Dominican Republic (1,000 MT), Canada (700 MT), Trinidad and Tobago (700 MT), and Guatemala (400 MT). Exports of 800 MT were down 96 percent from the previous week and 97 percent from the prior 4-week average. The destination was primarily to Mexico (600 MT).
Cotton: Net sales of 247,800 RB for 2020/2021 were up noticeably from the previous week, but down 1 percent from the prior 4-week average. Increases were primarily for China (59,500 RB), Turkey (45,000 RB), Vietnam (44,900 RB, including 1,300 RB switched from South Korea and 200 RB switched from Japan), Pakistan (27,100 RB), and Mexico (21,900 RB). For 2021/2022, net sales of 40,700 RB resulting in increases for Mexico (61,000 RB), were offset by reductions for China (20,200 RB). Exports of 292,400 RB were down 6 percent from the previous week and 13 percent from the prior 4-week average. Exports were primarily to China (71,100 RB), Vietnam (66,400 RB), Pakistan (45,100 RB), Bangladesh (28,400 RB), and Turkey (17,700 RB). Net sales of Pima totaling 11,900 RB were down 18 percent from the previous week and 31 percent from the prior 4-week average. Increases were primarily for China (4,500 RB), Pakistan (2,200 RB), Japan (1,900 RB), Italy (1,500 RB), and Peru (1,200 RB). Exports of 12,200 RB were up 3 percent from the previous week, but down 6 percent from the prior 4-week average. The destinations were primarily to India (5,400 RB), China (2,500 RB), Vietnam (1,600 RB), Peru (1,300 RB), and Bangladesh (500 RB).
Exports for Own Account: For 2020/2021, new exports for own account totaling 3,800 RB were to China (3,200 RB) and Bangladesh (600 RB). Exports for own account totaling 1,300 RB to Vietnam were applied to new or outstanding sales. The current exports for own account outstanding balance of 33,200 RB is for China (27,900 RB), Vietnam (4,600 RB), and Bangladesh (700 RB).
Hides and Skins: Net sales of 210,000 pieces for 2021 were down 41 percent from the previous week and 43 percent from the prior 4-week average. Increases primarily for China (119,200 whole cattle hides, including decreases of 9,600 pieces), Mexico (34,400 whole cattle hides, including decreases of 300 pieces), South Korea (33,500 whole cattle hides, including decreases of 1,400 pieces), Thailand (12,800 whole cattle hides, including decreases of 300 pieces), and Brazil (11,200 whole cattle hides, including decreases of 400 pieces), were offset by reductions primarily for Italy (2,700 pieces). In addition, total net sales of 1,000 kip skins were for Italy. Exports of 304,700 pieces for 2021 were down 1 percent from the previous week and 18 percent from the prior 4-week average. Whole cattle hides exports were primarily to China (200,600 pieces), South Korea (38,800 pieces), Mexico (30,200 pieces), Thailand (15,500 pieces), and Brazil (7,100 pieces).
Net sales of 22,300 wet blues for 2021 were down 88 percent from the previous week and 83 percent from the prior 4-week average. Increases primarily for Thailand (10,400 unsplit, including decreases of 600 unsplit), Vietnam (8,100 unsplit), Brazil (2,000 unsplit), Taiwan (1,700 grain splits), and India (900 unsplit), were offset by reductions primarily of Mexico (400 grain splits) and China (200 unsplit). Exports of 70,600 wet blues for 2021 were down 45 percent from the previous week and 51 percent from the prior 4-week average. The destinations were primarily to Italy (22,400 unsplit), Vietnam (16,300 unsplit), China (15,100 unsplit), Brazil (4,300 unsplit), and Thailand (3,800 unsplit). Net sales of 81,500 splits resulting in increases for China (87,000 pounds), were offset by reductions for Taiwan (2,700 pounds) and Vietnam (2,700 pounds). Exports of 118,800 pounds were to Vietnam (78,300 pounds) and Taiwan (40,500 pounds).
Beef: Net sales of 8,500 MT reported for 2021 were down 63 percent from the previous week and 66 percent from the prior 4-week average. Increases primarily for South Korea (3,800 MT, including decreases of 500 MT), Japan (3,100 MT, including decreases of 300 MT), Mexico (700 MT, including decreases 100 MT), Canada (500 MT), and Taiwan (300 MT, including decreases of 100 MT), were offset by reductions primarily for China (1,000 MT). Exports of 15,100 MT were primarily to South Korea (4,800 MT), Japan (3,900 MT), China (1,900 MT), Mexico (1,300 MT), and Taiwan (1,000 MT).
Pork: Net sales of 25,600 MT reported for 2021 were down 23 percent from the previous week and 40 percent from the prior 4-week average. Increases primarily for Mexico (7,300 MT, including decreases of 900 MT), Japan (4,100 MT, including decreases of 100 MT), China (3,700 MT, including decreases of 1,400 MT), South Korea (3,200 MT, including decreases of 1,200 MT), and the Philippines (2,100 MT, including decreases of 100 MT), were offset by reductions for El Salvador (400 MT) and Singapore (100 MT). Exports of 35,300 MT were down 11 percent from the previous week and 9 percent from the prior 4-week average. The destinations were primarily to China (11,900 MT), Mexico (8,900 MT), Japan (4,200 MT), Canada (2,100 MT), and Colombia (1,900 MT).
February 25, 2021 1 FOREIGN AGRICULTURAL SERVICE/USDA
SUMMARY OF EXPORT TRANSACTIONS
REPORTED UNDER THE DAILY SALES REPORTING SYSTEM
FOR PERIOD ENDING FEBRUARY 18, 2021
*NO SALES WERE REPORTED DURING THE ABOVE PERIOD.
Terry Reilly
Senior Commodity Analyst – Grain and Oilseeds
Futures International
One Lincoln Center
18 W 140 Butterfield Rd.
Oakbrook Terrace, Il. 60181
W: 312.604.1366
ICE IM: treilly1
Skype: fi.treilly

Trading of futures, options, swaps and other derivatives is risky and is not suitable for all persons. All of these investment products are leveraged, and you can lose more than your initial deposit. Each investment product is offered only to and from jurisdictions where solicitation and sale are lawful, and in accordance with applicable laws and regulations in such jurisdiction. The information provided here should not be relied upon as a substitute for independent research before making your investment decisions. Futures International, LLC is merely providing this information for your general information and the information does not take into account any particular individual’s investment objectives, financial situation, or needs. All investors should obtain advice based on their unique situation before making any investment decision. The contents of this communication and any attachments are for informational purposes only and under no circumstances should they be construed as an offer to buy or sell, or a solicitation to buy or sell any future, option, swap or other derivative. The sources for the information and any opinions in this communication are believed to be reliable, but Futures International, LLC does not warrant or guarantee the accuracy of such information or opinions. Futures International, LLC and its principals and employees may take positions different from any positions described in this communication. Past results are not necessarily indicative of future results.