PDF attached
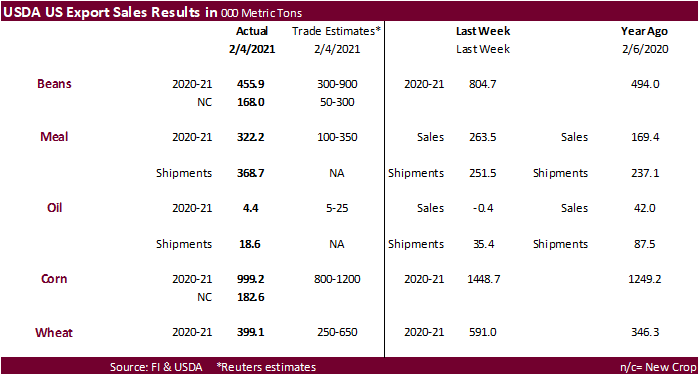
USDA Export Sales were within expectations for soybeans and meal and below for soybean oil. China bought a new-crop soybean cargo. Soybean meal shipments were good.
USDA sales for corn of 999,200 tons for this crop year and 182,600 tons for new crop were within expectations. Mexico and Costa Rica were largest countries for 2020-21 and 2021-22. Sorghum and barley sales were minimal. Pork sales were 33,300 tons and included only 2,500 tons for China.
All wheat export sales were within expectations and included China for 131,700 tons.
U.S. EXPORT SALES FOR WEEK ENDING 2/11/2021
|
|
CURRENT MARKETING YEAR |
NEXT MARKETING YEAR |
||||||
|
COMMODITY |
NET SALES |
OUTSTANDING SALES |
WEEKLY EXPORTS |
ACCUMULATED EXPORTS |
NET SALES |
OUTSTANDING SALES |
||
|
CURRENT YEAR |
YEAR |
CURRENT YEAR |
YEAR |
|||||
|
|
THOUSAND METRIC TONS |
|||||||
|
WHEAT |
|
|
|
|
|
|
|
|
|
HRW |
122.4 |
1,430.9 |
1,852.1 |
131.7 |
6,448.1 |
6,483.1 |
50.0 |
252.0 |
|
SRW |
-5.4 |
439.0 |
364.1 |
39.1 |
1,264.0 |
1,854.3 |
52.2 |
280.1 |
|
HRS |
61.3 |
2,057.9 |
1,488.5 |
78.3 |
4,906.5 |
4,898.8 |
107.2 |
199.2 |
|
WHITE |
213.6 |
2,476.4 |
1,191.9 |
130.0 |
3,715.8 |
3,294.1 |
0.0 |
80.0 |
|
DURUM |
7.3 |
172.2 |
148.4 |
0.5 |
492.9 |
679.8 |
5.0 |
5.0 |
|
TOTAL |
399.1 |
6,576.3 |
5,045.0 |
379.7 |
16,827.5 |
17,210.1 |
214.4 |
816.3 |
|
BARLEY |
2.0 |
12.6 |
15.5 |
1.0 |
20.0 |
33.4 |
0.0 |
14.5 |
|
CORN |
999.2 |
35,584.7 |
12,357.3 |
1,387.1 |
22,969.6 |
12,650.9 |
182.6 |
1,082.0 |
|
SORGHUM |
0.1 |
3,094.1 |
248.3 |
73.7 |
2,837.0 |
974.4 |
109.0 |
703.0 |
|
SOYBEANS |
455.9 |
9,178.4 |
5,041.4 |
1,000.2 |
50,682.3 |
28,321.5 |
168.0 |
4,592.9 |
|
SOY MEAL |
322.2 |
2,913.2 |
3,562.5 |
368.7 |
4,871.8 |
4,122.6 |
0.0 |
215.1 |
|
SOY OIL |
4.4 |
193.1 |
253.0 |
18.6 |
395.0 |
430.4 |
0.0 |
0.6 |
|
RICE |
|
|
|
|
|
|
|
|
|
L G RGH |
22.0 |
271.9 |
418.1 |
26.7 |
899.3 |
825.6 |
0.0 |
0.0 |
|
M S RGH |
0.0 |
11.7 |
42.8 |
0.1 |
17.2 |
17.5 |
0.0 |
0.0 |
|
L G BRN |
0.1 |
13.1 |
11.5 |
0.2 |
23.6 |
33.1 |
0.0 |
0.0 |
|
M&S BR |
44.9 |
97.3 |
60.7 |
0.3 |
54.4 |
29.9 |
0.0 |
0.0 |
|
L G MLD |
2.1 |
88.0 |
107.3 |
4.5 |
356.4 |
579.1 |
0.0 |
0.0 |
|
M S MLD |
31.1 |
223.5 |
151.4 |
13.5 |
282.1 |
345.7 |
0.0 |
0.0 |
|
TOTAL |
100.2 |
705.5 |
791.9 |
45.2 |
1,633.0 |
1,830.9 |
0.0 |
0.0 |
|
COTTON |
|
THOUSAND RUNNING BALES |
||||||
|
UPLAND |
119.5 |
5,700.8 |
7,189.5 |
311.8 |
7,460.1 |
6,243.2 |
2.1 |
1,115.4 |
|
PIMA |
14.6 |
276.0 |
227.1 |
11.8 |
412.8 |
222.5 |
0.0 |
1.1 |
This summary is based on reports from exporters for the period February 5-11, 2021.
Wheat: Net sales of 399,100 metric tons (MT) for 2020/2021 were down 33 percent from the previous week and 18 percent from the prior 4-week average. Increases primarily for Nigeria (138,000 MT), China (131,700 MT), South Korea (85,500 MT), Japan (61,300 MT), and Algeria (40,000 MT, switched from unknown destinations), were offset by reductions primarily for the United Arab Emirates (40,000 MT) and unknown destinations (35,000 MT). For 2021/2022, net sales of 214,400 MT were primarily for the Philippines (70,000 MT), the United Arab Emirates (40,000 MT), Mexico (33,000 MT), and Nigeria (30,000 MT). Exports of 379,700 MT were down 14 percent from the previous week and 11 percent from the prior 4-week average. The destinations were primarily to Japan (127,500 MT), Mexico (105,000 MT), China (66,700 MT), South Korea (30,300 MT), and Venezuela (16,500 MT).
Optional Origin Sales: For 2020/2021, the current outstanding balance of 10,000 MT, all Spain.
Corn: Net sales of 999,200 MT for 2020/2021 were down 31 percent from the previous week and 67 percent from the prior 4-week average. Increases primarily for Mexico (226,500 MT, including decreases of 3,600 MT), Costa Rica (183,300 MT), Guatemala (129,600 MT, including 3,200 MT switched from El Salvador and 1,500 MT switched from Nicaragua), Japan (129,600 MT, including 4,700 MT switched from unknown destinations), and South Korea (122,700 MT, including decreases of 5,400 MT), were offset by reductions for unknown destinations (242,500 MT). For 2021/2022, net sales of 182,600 MT were reported for Mexico (90,000 MT), Costa Rica (59,700 MT), and Japan (32,900 MT). Exports of 1,387,100 MT were down 11 percent from the previous week, but up 14 percent from the prior 4-week average. The destinations were primarily to Mexico (247,100 MT), Japan (236,200 MT), South Korea (182,800 MT), Colombia (114,800 MT), and Peru (83,500 MT).
Optional Origin Sales: For 2020/2021, new optional origin sales of 50,000 MT were reported for unknown destinations. Options were exercised to export 59,000 MT to South Korea from the United States. The current outstanding balance of 1,210,400 MT is for South Korea (779,000 MT), unknown destinations (294,000 MT), Taiwan (70,000 MT), China (65,000 MT), and Ukraine (2,400 MT).
Barley: For 2020/2021, net sales of 2,000 MT were primarily for Canada. Exports of 1,000 MT were up noticeably from the previous week and up 94 percent from the prior 4-week average. The destination was Japan.
Sorghum: For 2020/2021, total net sales of 100 MT, down noticeably from the previous week and from the prior 4-week average, were for China, including decreases of 55,000 MT. For 2021/2022, net sales of 109,000 MT were reported for China (55,000 MT) and unknown destinations (54,000 MT). Exports of 73,700 MT were up 34 percent from the previous week, but down 58 percent from the prior 4-week average. The destination was primarily to China.
Rice: Net sales of 100,200 MT for 2020/2021 were up noticeably from the previous week and up 19 percent from the prior 4-week average. Increases were primarily for South Korea (46,000 MT), Mexico (20,300 MT), Japan (19,700 MT), El Salvador (3,000 MT), and Saudi Arabia (2,600 MT). Exports of 45,200 MT were down 24 percent from the previous week and 12 percent from the prior 4-week average. The destinations were primarily to Mexico (28,700 MT), Jordan (3,600 MT), Saudi Arabia (3,400 MT), Canada (3,100 MT), and Israel (2,400 MT).
Exports for Own Account: For 2020/2021, exports for own account totaling 100 MT to Canada were applied to new or outstanding sales.
Soybeans: Net sales of 455,900 MT for 2020/2021 were down 43 percent from the previous week and 53 percent from the prior 4-week average. Increases primarily for Indonesia (92,900 MT, including 67,000 MT switched from unknown destinations and decreases of 500 MT), the Netherlands (85,700 MT, including 79,000 MT switched from unknown destinations), Mexico (71,000 MT, including decreases of 2,800 MT), Germany (57,500 MT), and Costa Rica (56,500 MT), were offset by reductions primarily for unknown destinations (37,500 MT). For 2021/2022, net sales of 168,000 MT were reported for Taiwan (68,000 MT), China (63,000 MT), Costa Rica (29,000 MT), unknown destinations (5,000 MT), and Japan (3,000 MT). Exports of 1,000,200 MT were down 55 percent from the previous week and 54 percent from the prior 4-week average. The destinations were primarily to China (400,300 MT) Mexico (124,500 MT), Indonesia (87,400 MT), the Netherlands (85,700 MT), and Italy (72,000 MT).
Exports for Own Account: The current exports for own account outstanding balance is 5,800 MT, all Canada.
Export Adjustments: Accumulated exports of soybeans to the Netherlands were adjusted down 57,520 MT for week ending January 28th. The correct destination for this shipment is Germany.
Soybean Cake and Meal: Net sales of 322,200 MT for 2020/2021 were up 22 percent from the previous week and 10 percent from the prior 4-week average. Increases primarily for the Philippines (92,800 MT), Guatemala (58,000 MT, including 6,000 MT switched from Honduras, 1,400 MT switched from Nicaragua, and decreases of 100 MT), Morocco (37,600 MT, including decreases of 2,400 MT), Honduras (34,500 MT, including 6,000 MT switched from Costa Rica and decreases of 6,800 MT), and Denmark (30,000 MT), were offset by reductions primarily for Peru (7,000 MT) and Colombia (3,000 MT). Exports of 368,700 MT–a marketing-year high– were up 47 percent from the previous week and 42 percent from the prior 4-week average. The destinations were primarily to Colombia (62,400 MT), the Philippines (50,800 MT), Vietnam (48,600 MT), Italy (46,300 MT), and Denmark (33,000 MT).
Soybean Oil: Net sales of 4,400 MT for 2020/2021 were up noticeably from the previous week, but down 79 percent from the prior 4-week average. Increases primarily for Guatemala (4,000 MT), Venezuela (500 MT), the Dominican Republic (300 MT), and Mexico (200 MT), were offset by reductions primarily for Peru (600 MT) and Colombia (100 MT). Exports of 18,600 MT were down 47 percent from the previous week and 39 percent from the prior 4-week average. The destinations were primarily to Colombia (8,000 MT), Peru (5,200 MT), the Dominican Republic (4,300 MT), Canada (800 MT), and Mexico (300 MT).
Cotton: Net sales of 119,500 RB for 2020/2021 were down 57 percent from the previous week and 59 percent from the prior 4-week average. Increases primarily for China (44,100 RB), Vietnam (27,200 RB, including 700 RB switched from South Korea, 200 RB switched from Japan, and decreases of 100 RB), Bangladesh (18,300 RB), Pakistan (7,200 RB), and Turkey (6,900 RB), were offset by reductions primarily for Mexico (4,000 RB) and Nicaragua (400 RB). For 2021/2022, net sales of 2,100 RB resulting in increases for Turkey (11,000 RB), were offset by reductions for Bangladesh (8,900 RB). Exports of 311,800 RB were down 28 percent from the previous week and 8 percent from the prior 4-week average. Exports were primarily to Vietnam (90,000 RB), China (82,300 RB), Pakistan (26,700 RB), Turkey (25,600 RB), and Mexico (19,800 RB). Net sales of Pima totaling 14,600 RB were up 51 percent from the previous week, but down 25 percent from the prior 4-week average. Increases were primarily for China (9,200 RB), Pakistan (2,200 RB), Peru (1,800 RB), Austria (700 RB), and South Korea (300 RB). Exports of 11,800 RB were up 67 percent from the previous week, but down 2 percent from the prior 4-week average. The destinations were primarily to Vietnam (4,100 RB), India (2,400 RB), China (2,100 RB), El Salvador (1,500 RB), and Indonesia (900 RB).
Exports for Own Account: For 2020/2021, new exports for own account totaling 8,200 RB were to Vietnam (4,400 RB), China (3,700 RB), and Bangladesh (100 RB). Exports for own account totaling 10,700 RB to Vietnam (5,700 RB) and China (5,000 RB) were applied to new or outstanding sales. The current exports for own account outstanding balance of 30,600 RB is for China (24,600 RB), Vietnam (5,900 RB), and Bangladesh (100 RB).
Hides and Skins: Net sales of 356,900 pieces for 2021 were down 4 percent from the previous week and from the prior 4-week average. Increases primarily for China (253,500 whole cattle hides, including decreases of 12,100 pieces), South Korea (61,200 whole cattle hides, including decreases of 700 pieces), Thailand (15,500 whole cattle hides, including decreases of 900 pieces), Mexico (9,500 whole cattle hides, including decreases of 1,000 pieces), and Italy (9,200 whole cattle hides), were offset by reductions for Cambodia (200 pieces). Total net sales of 2,000 calf skins were for Italy. Additionally, net sales reductions of 300 kip skins were reported for Belgium. Exports of 308,000 pieces for 2021 were down 25 percent from the previous week and 22 percent from the prior 4-week average. Whole cattle hides exports were primarily to China (220,100 pieces), South Korea (25,600 pieces), Mexico (17,900 pieces), Thailand (14,800 pieces), and Taiwan (11,200 pieces). Additionally, exports of 2,600 kip skins were to Belgium.
Net sales of 192,800 wet blues for 2021 were up 73 percent from the previous week and 44 percent from the prior 4-week average. Increases primarily for China (46,500 unsplit, 9,800 grain splits, and decreases of 500 unsplit), Vietnam (51,400 unsplit, including decreases of 100 unsplit), Italy (45,000 grain splits, 2,300 unsplit, including decreases of 100 grain splits and 100 unsplit), Mexico (21,200 grain splits and 7,700 unsplit), and Brazil (5,300 unsplit), were offset by reductions of Thailand (300 unsplit). Exports of 128,100 wet blues for 2021 were down 7 percent from the previous week and 11 percent from the prior 4-week average. The destinations were to Vietnam (43,400 unsplit), China (36,700 unsplit), Italy (16,100 unsplit and 13,100 grain splits), Mexico (3,700 grain splits and 2,600 unsplit), and Thailand (5,700 unsplit). Net sales of 889,000 splits reported for Vietnam (869,400 pounds, including decreases of 20,800 pounds) and Taiwan (43,300 pounds), were offset by reductions for China (23,600 pounds). Exports of 850,600 pounds were to Vietnam (725,800 pounds) and China (124,800 pounds).
Pork: Net sales of 33,300 MT reported for 2021 were down 10 percent from the previous week and 27 percent from the prior 4-week average. Increases were primarily for Japan (9,500 MT, including decreases of 100 MT), Mexico (8,400 MT, including decreases of 600 MT), South Korea (3,000 MT, including decreases of 200 MT), China (2,500 MT, including decreases of 1,300 MT), and the Philippines (2,500 MT, including decreases of 100 MT). Exports of 39,800 MT were up 5 percent from the previous week and 2 percent from the prior 4-week average. The destinations were primarily to China (13,100 MT), Mexico (10,000 MT), Japan (5,300 MT), Canada (2,600 MT), and South Korea (2,300 MT).
February 19, 2021 1 FOREIGN AGRICULTURAL SERVICE/USDA
SUMMARY OF EXPORT TRANSACTIONS
REPORTED UNDER THE DAILY SALES REPORTING SYSTEM
FOR PERIOD ENDING FEBRUARY 11, 2021
COMMODITY DESTINATION QUANITY (MT) MARKETING YEAR
CORN COSTA RICA 135,644 MT 1/ 2020/2021
CORN COSTA RICA 59,694 MT 1/ 2021/2022
CORN GUATEMALA 115,577 MT 1/ 2020/2021
CORN UNKNOWN 132,000 MT 2/ 2020/2021
1/ Export Sales. 2/ Cancellations of export sales.
Terry Reilly
Senior Commodity Analyst – Grain and Oilseeds
Futures International
One Lincoln Center
18 W 140 Butterfield Rd.
Oakbrook Terrace, Il. 60181
W: 312.604.1366
ICE IM: treilly1
Skype: fi.treilly

Trading of futures, options, swaps and other derivatives is risky and is not suitable for all persons. All of these investment products are leveraged, and you can lose more than your initial deposit. Each investment product is offered only to and from jurisdictions where solicitation and sale are lawful, and in accordance with applicable laws and regulations in such jurisdiction. The information provided here should not be relied upon as a substitute for independent research before making your investment decisions. Futures International, LLC is merely providing this information for your general information and the information does not take into account any particular individual’s investment objectives, financial situation, or needs. All investors should obtain advice based on their unique situation before making any investment decision. The contents of this communication and any attachments are for informational purposes only and under no circumstances should they be construed as an offer to buy or sell, or a solicitation to buy or sell any future, option, swap or other derivative. The sources for the information and any opinions in this communication are believed to be reliable, but Futures International, LLC does not warrant or guarantee the accuracy of such information or opinions. Futures International, LLC and its principals and employees may take positions different from any positions described in this communication. Past results are not necessarily indicative of future results.