PDF attached
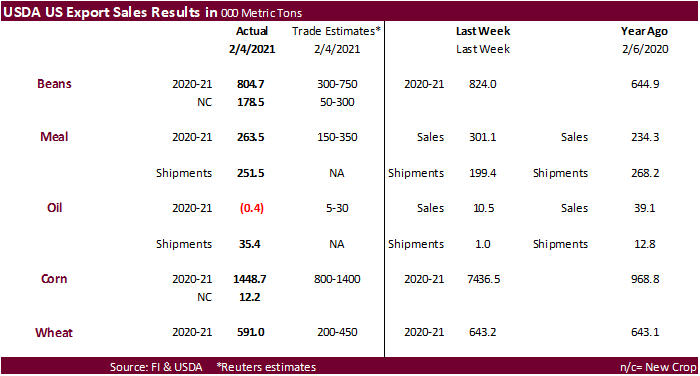
USDA export sales were better than expected to corn, wheat, old crop soybeans. Soybean meal sales and shipments were ok. Soybean oil sales showed a small net reduction but shipments were good. China bought 110,000 tons of sorghum. China was not a large buyer, if any, for corn and wheat. For soybeans, increases primarily for China (517,000 MT, including 198,000 MT switched from unknown destinations, decreases of 9,500 MT, and 296,000 MT late). Pork sales of 36,900 tons included 9,700 for China (includes 1,200 decrease).
U.S. EXPORT SALES FOR WEEK ENDING 2/4/2021
|
|
CURRENT MARKETING YEAR |
NEXT MARKETING YEAR |
||||||
|
COMMODITY |
NET SALES |
OUTSTANDING SALES |
WEEKLY EXPORTS |
ACCUMULATED EXPORTS |
NET SALES |
OUTSTANDING SALES |
||
|
CURRENT YEAR |
YEAR |
CURRENT YEAR |
YEAR |
|||||
|
|
THOUSAND METRIC TONS |
|||||||
|
WHEAT |
|
|
|
|
|
|
|
|
|
HRW |
211.7 |
1,440.2 |
1,908.1 |
129.6 |
6,316.4 |
6,261.0 |
0.0 |
202.0 |
|
SRW |
55.6 |
483.5 |
393.2 |
17.4 |
1,224.9 |
1,809.1 |
9.4 |
227.9 |
|
HRS |
245.2 |
2,074.9 |
1,576.6 |
189.3 |
4,828.2 |
4,732.2 |
25.0 |
92.0 |
|
WHITE |
78.4 |
2,392.8 |
1,218.8 |
100.7 |
3,585.8 |
3,188.5 |
9.9 |
80.0 |
|
DURUM |
0.1 |
165.4 |
197.4 |
1.9 |
492.5 |
623.8 |
0.0 |
0.0 |
|
TOTAL |
591.0 |
6,556.9 |
5,294.1 |
438.9 |
16,447.8 |
16,614.7 |
44.4 |
601.9 |
|
BARLEY |
0.0 |
11.6 |
15.8 |
0.3 |
19.0 |
33.0 |
0.0 |
14.5 |
|
CORN |
1,448.6 |
35,972.7 |
11,869.4 |
1,565.7 |
21,582.5 |
11,890.0 |
12.2 |
899.4 |
|
SORGHUM |
110.0 |
3,167.7 |
284.0 |
54.9 |
2,763.3 |
889.2 |
0.0 |
594.0 |
|
SOYBEANS |
804.7 |
9,722.6 |
5,504.9 |
2,213.9 |
49,739.6 |
27,363.7 |
178.5 |
4,424.9 |
|
SOY MEAL |
263.5 |
2,959.6 |
3,630.2 |
251.5 |
4,503.1 |
3,885.4 |
1.2 |
215.1 |
|
SOY OIL |
-0.4 |
207.4 |
298.6 |
35.4 |
376.3 |
342.9 |
0.0 |
0.6 |
|
RICE |
|
|
|
|
|
|
|
|
|
L G RGH |
-7.9 |
276.6 |
440.7 |
31.0 |
872.6 |
757.7 |
0.0 |
0.0 |
|
M S RGH |
0.0 |
11.8 |
43.3 |
0.5 |
17.1 |
17.0 |
0.0 |
0.0 |
|
L G BRN |
1.9 |
13.1 |
22.2 |
0.2 |
23.4 |
22.0 |
0.0 |
0.0 |
|
M&S BR |
0.5 |
52.7 |
66.0 |
0.9 |
54.1 |
24.5 |
0.0 |
0.0 |
|
L G MLD |
22.8 |
90.4 |
92.1 |
20.0 |
351.9 |
576.6 |
0.0 |
0.0 |
|
M S MLD |
7.9 |
205.8 |
129.0 |
6.8 |
268.6 |
335.2 |
0.0 |
0.0 |
|
TOTAL |
25.2 |
650.5 |
793.2 |
59.3 |
1,587.8 |
1,733.0 |
0.0 |
0.0 |
|
COTTON |
|
THOUSAND RUNNING BALES |
||||||
|
UPLAND |
275.4 |
5,893.1 |
7,329.9 |
433.6 |
7,148.2 |
5,867.5 |
170.1 |
1,113.3 |
|
PIMA |
9.7 |
273.2 |
227.8 |
7.1 |
401.0 |
212.4 |
0.0 |
1.1 |
This summary is based on reports from exporters for the period January 29-February 4, 2021.
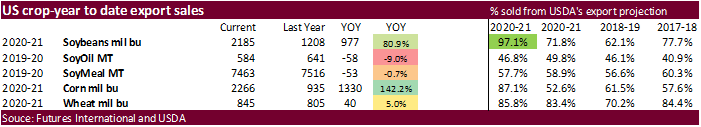
Wheat: Net sales of 591,000 metric tons (MT) for 2020/2021 were down 8 percent from the previous week, but up 50 percent from the prior 4-week average. Increases primarily for unknown destinations (167,000 MT), Mexico (108,800 MT, including decreases of 2,300 MT), the Philippines (99,200 MT, including decreases of 700 MT), Taiwan (89,200 MT), and Japan (57,000 MT), were offset by reductions primarily for Nigeria (17,000 MT), Guatemala (9,900 MT), and Thailand (4,600 MT). For 2021/2022, net sales of 44,400 MT were primarily for the Philippines (25,000 MT) and Guatemala (9,900 MT). Exports of 438,900 MT were down 12 percent from the previous week, but up 8 percent from the prior 4-week average. The destinations were primarily to the Philippines (115,700 MT), Mexico (92,100 MT), Taiwan (80,200 MT), Thailand (58,700 MT), and Colombia (34,000 MT).
Optional Origin Sales: For 2020/2021, the current outstanding balance of 10,000 MT, all Spain.
Corn: Net sales of 1,448,600 MT for 2020/2021 were down 81 percent from the previous week and 52 percent from the prior 4-week average. Increases primarily for Japan (517,700 MT, including 54,700 MT switched from unknown destinations and decreases of 57,200 MT), Mexico (456,400 MT, including 61,000 MT switched from unknown destinations and decreases of 9,200 MT), Egypt (119,500 MT, including 60,000 MT switched from unknown destinations and decreases of 500 MT), Guatemala (72,200 MT), and Colombia (71,200 MT, including 55,000 MT switched from unknown destinations and decreases of 29,100 MT), were offset by reductions primarily for unknown destinations (127,100 MT). For 2021/2022, net sales of 12,200 MT were primarily for Mexico (10,900 MT). Exports of 1,565,700 MT–a marketing-year high–were up 57 percent from the previous week and 32 percent from the prior 4-week average. The destinations were primarily to China (357,600 MT), Japan (314,000 MT), Mexico (288,000 MT), Colombia (129,600 MT), and Peru (78,400 MT).
Optional Origin Sales: For 2020/2021, decreases totaling 100,000 MT were reported for Taiwan (70,000 MT) and unknow destinations (30,000 MT). The current outstanding balance of 1,219,400 MT is for South Korea (838,000 MT), unknown destinations (244,000 MT), Taiwan (70,000 MT), China (65,000 MT), and Ukraine (2,400 MT).
Barley: No net sales were reported for the week. Exports of 300 MT were to Taiwan.
Sorghum: Net sales of 110,000 MT for 2020/2021 were up 73 percent from the previous week, but down 40 percent from the prior 4-week average. Increases were reported for China (110,000 MT, including decreases of 1,000 MT). Exports of 54,900 MT were down 82 percent from the previous week and 70 percent from the prior 4-week average. The destination was China.
Rice: Net sales of 25,200 MT for 2020/2021 were down 74 percent from the previous week and 69 percent from the prior 4-week average. Increases primarily for Haiti (18,900 MT), Colombia (9,000 MT), Japan (5,200 MT), El Salvador (3,500 MT), and Canada (3,400 MT, including decreases of 100 MT), were offset by reductions for Venezuela (21,500 MT) and Mexico (900 MT). Exports of 59,300 MT were up 97 percent from the previous week and 44 percent from the prior 4-week average. The destinations were primarily to Honduras (28,600 MT), Haiti (14,400 MT), Mexico (3,300 MT), Saudi Arabia (2,800 MT), and Canada (2,600 MT).
Exports for Own Account: For 2020/2021, new exports for own account totaling 100 MT were for Canada. The current exports for own account outstanding balance is 100 MT, all Canada.
Soybeans: Net sales of 804,700 MT for 2020/2021 were down 2 percent from the previous week and 20 percent from the prior 4-week average. Increases primarily for China (517,000 MT, including 198,000 MT switched from unknown destinations, decreases of 9,500 MT, and 296,000 MT late–see below), the Netherlands (212,700 MT, including 193,000 MT switched from unknown destinations and decreases of 1,300 MT), Mexico (133,400 MT, including decreases of 3,600 MT), Egypt (119,200 MT, including 65,000 MT switched from unknown destinations and decreases of 3,900 MT), and Indonesia (114,200 MT, including 55,000 MT switched from unknown destinations and decreases of 3,800 MT), were offset by reductions primarily for unknown destinations (536,800 MT). For 2021/2022, net sales of 178,500 MT were reported for China (66,000 MT), unknown destinations (65,000 MT), and Mexico (47,500 MT). Exports of 2,213,900 MT were up 13 percent from the previous week and 3 percent from the prior 4-week average. The destinations were primarily to China (1,154,800 MT, including 296,000 MT late–see below), the Netherlands (212,700 MT), Mexico (161,700 MT), Taiwan (116,000 MT), and Egypt (114,200 MT).
Late Reporting: For 2020/2021, new sales totaling 296,000 MT were reported late for China. For 2020/2021, exports totaling 352,700 MT were reported late for China (296,000 MT) and Bangladesh (56,700 MT).
Exports for Own Account: For 2020/2021, decreases were reported for Canada (300 MT). The current exports for own account outstanding balance is 5,800 MT, all Canada.
Soybean Cake and Meal: Net sales of 263,500 MT for 2020/2021 were down 13 percent from the previous week and 16 percent from the prior 4-week average. Increases primarily for Vietnam (50,300 MT, including 50,000 MT switched from unknown destinations), Colombia (48,700 MT, including decreases of 500 MT and 27,000 MT late–see below), the Philippines (45,200 MT, including decreases of 300 MT), Honduras (42,600 MT, including 12,000 MT switched from El Salvador and decreases of 5,000 MT), and Guatemala (39,300 MT), were offset by reductions primarily for unknown destinations (50,000 MT), Costa Rica (12,800 MT), and El Salvador (7,000 MT). For 2021/2022, total net sales of 1,200 MT were for Canada. Exports of 251,500 MT were up 26 percent from the previous week and 1 percent from the prior 4-week average. The destinations were primarily to Vietnam (50,900 MT), Mexico (43,100 MT), Colombia (40,400 MT, including 27,000 MT late–see below), the Philippines (19,800 MT), and Honduras (17,500 MT).
Late Reporting: For 2020/2021, net sales and exports totaling 27,000 MT were reported late to Colombia.
Soybean Oil: Net sales reductions of 400 MT for 2020/2021–a marketing-year low–were down noticeably from the previous week and from the prior 4-week average. Increases primarily for Colombia (3,200 MT, including decreases of 200 MT), the Dominican Republic (500 MT), and Mexico (500 MT), were more than offset by reductions for Guatemala (4,400 MT) and Canada (200 MT). Exports of 35,400 MT were up noticeably from the previous week and up 4 percent from the prior 4-week average. The destinations were primarily to South Korea (25,500 MT), Guatemala (7,700 MT), Mexico (1,000 MT), the Dominican Republic (600 MT), and Canada (500 MT).
Cotton: Net sales of 275,400 RB for 2020/2021 were down 4 percent from the previous week and 10 percent from the prior 4-week average. Increases primarily for China (55,800 RB, including 4,800 RB switched from Vietnam), Turkey (44,600 RB), Vietnam (42,000 RB, including 700 RB switched from South Korea), Pakistan (25,500 RB), and South Korea (18,600 RB), were offset by reductions primarily for El Salvador (1,100 RB) and Peru (400 RB). For 2021/2022, net sales of 170,100 RB primarily for Vietnam (154,000 RB), South Korea (15,000 RB), Pakistan (9,700 RB), Bangladesh (4,600 RB), and Mexico (2,800 RB), were offset by reductions primarily for China (8,800 RB) and the Philippines (6,600 RB). Exports of 433,600 RB–a marketing-year high–were up 36 percent from the previous week and 46 percent from the prior 4-week average. Exports were primarily to China (143,200 RB), Mexico (85,000 RB, including 67,700 RB late–see below), Vietnam (68,500 RB), Pakistan (51,400 RB), and Bangladesh (20,500 RB). Net sales of Pima totaling 9,700 RB were down 49 percent from the previous week and 63 percent from the prior 4-week average. Increases primarily for Peru (4,900 RB, including decreases of 300 RB), Turkey (1,300 RB), Pakistan (1,300 RB), Honduras (1,300 RB), and China (1,100 RB), were offset by reductions primarily for India (1,100 RB). Exports of 7,100 RB were down 65 percent from the previous week and 45 percent from the prior 4-week average. The destinations were primarily to India (3,000 RB), Vietnam (2,200 RB), Peru (500 RB), Pakistan (400 RB), and Thailand (400 RB).
Exports for Own Account: For 2020/2021, new exports for own account totaling 18,100 RB were to China (14,700 RB) and Vietnam (3,400 RB). Exports for own account totaling 400 RB to China were applied to new or outstanding sales. The current exports for own account outstanding balance of 33,100 RB is for China (25,900 RB) and Vietnam (7,200 RB).
Late Reporting: For 2020/2021, exports totaling 67,700 RB were reported late to Mexico.
Hides and Skins: Net sales of 372,200 pieces for 2021, primarily for China (188,500 whole cattle hides, including decreases of 59,700 pieces), South Korea (60,800 whole cattle hides, including decreases of 2,300 pieces), Thailand (39,300 whole cattle hides, including decreases of 1,100 pieces), Mexico (36,300 whole cattle hides, including decreases of 1,900 pieces), and Brazil (21,200 whole cattle hides, including decreases of 800 pieces), were offset by reductions for Turkey (400 pieces). Exports of 409,900 pieces for 2021 were primarily to China (270,700 pieces), South Korea (55,300 pieces), Mexico (36,600 pieces), Thailand (23,600 pieces), and Taiwan (10,900 pieces). Additionally, exports of 2,000 kip skins were to Mexico.
Net sales of 111,200 wet blues for 2021, primarily for Italy (34,100 unsplit and 25,000 grain splits, including decreases of 800 unsplit), Mexico (12,300 grain splits and 5,100 unsplit), Thailand (14,200 unsplit, including decreases of 200 unsplit), Brazil (10,200 unsplit), and Vietnam (6,900 unsplit, including decreases of 300 unsplit), were offset by reductions for China (500 unsplit). Exports of 137,200 wet blues for 2021 were primarily to Vietnam (52,900 unsplit), China (33,800 unsplit), Italy (24,400 unsplit and 9,300 grain splits), Thailand (9,800 unsplit), and Mexico (2,100 grain splits and 1,700 unsplit). Net sales of 92,700 splits were reported for Vietnam (55,100 pounds) and China (37,600 pounds). Exports of 280,000 pounds were to Vietnam.
Pork: Net sales of 36,900 MT reported for 2021, increases primarily for China (9,700 MT, including decreases of 1,200 MT), South Korea (8,200 MT, including decreases of 200 MT), Mexico (5,100 MT, including decreases of 400 MT), Japan (4,700 MT, including decreases of 200 MT), and Canada (2,700 MT, including decreases of 400 MT), were offset by reductions for El Salvador (500 MT). Exports of 37,800 MT were primarily to China (10,700 MT), Mexico (10,000 MT), Japan (5,400 MT), South Korea (3,000 MT), and Canada (2,400 MT).
February 11, 2021 1 FOREIGN AGRICULTURAL SERVICE/USDA
SUMMARY OF EXPORT TRANSACTIONS
REPORTED UNDER THE DAILY SALES REPORTING SYSTEM
FOR PERIOD ENDING FEBRUARY 4, 2020
COMMODITY DESTINATION QUANITY (MT) MARKETING YEAR
CORN MEXICO 115,000 MT 1/ 2020/2021
CORN UNKNOWN 101,600 MT 1/ 2020/2021
1/ Export Sales.
Terry Reilly
Senior Commodity Analyst – Grain and Oilseeds
Futures International
One Lincoln Center
18 W 140 Butterfield Rd.
Oakbrook Terrace, Il. 60181
W: 312.604.1366
ICE IM: treilly1
Skype: fi.treilly

Trading of futures, options, swaps and other derivatives is risky and is not suitable for all persons. All of these investment products are leveraged, and you can lose more than your initial deposit. Each investment product is offered only to and from jurisdictions where solicitation and sale are lawful, and in accordance with applicable laws and regulations in such jurisdiction. The information provided here should not be relied upon as a substitute for independent research before making your investment decisions. Futures International, LLC is merely providing this information for your general information and the information does not take into account any particular individual’s investment objectives, financial situation, or needs. All investors should obtain advice based on their unique situation before making any investment decision. The contents of this communication and any attachments are for informational purposes only and under no circumstances should they be construed as an offer to buy or sell, or a solicitation to buy or sell any future, option, swap or other derivative. The sources for the information and any opinions in this communication are believed to be reliable, but Futures International, LLC does not warrant or guarantee the accuracy of such information or opinions. Futures International, LLC and its principals and employees may take positions different from any positions described in this communication. Past results are not necessarily indicative of future results.