PDF attached
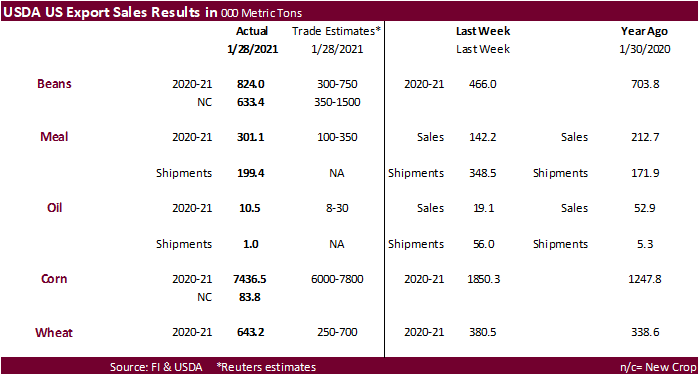
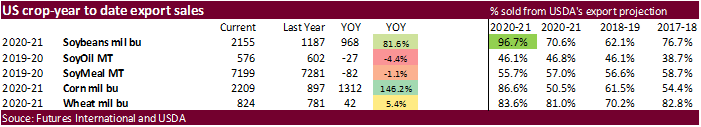
Sales in soybeans, corn and wheat were excellent. Text below.
U.S. EXPORT SALES FOR WEEK ENDING 1/28/2021
|
|
CURRENT MARKETING YEAR |
NEXT MARKETING YEAR |
||||||
|
COMMODITY |
NET SALES |
OUTSTANDING SALES |
WEEKLY EXPORTS |
ACCUMULATED EXPORTS |
NET SALES |
OUTSTANDING SALES |
||
|
CURRENT YEAR |
YEAR |
CURRENT YEAR |
YEAR |
|||||
|
|
THOUSAND METRIC TONS |
|||||||
|
WHEAT |
|
|
|
|
|
|
|
|
|
HRW |
187.4 |
1,358.1 |
1,814.1 |
185.4 |
6,186.8 |
6,060.9 |
37.5 |
202.0 |
|
SRW |
53.0 |
445.2 |
455.0 |
50.9 |
1,207.6 |
1,735.6 |
9.0 |
218.5 |
|
HRS |
250.4 |
2,019.1 |
1,558.8 |
125.7 |
4,638.9 |
4,552.4 |
13.0 |
67.0 |
|
WHITE |
152.3 |
2,415.2 |
1,139.2 |
135.2 |
3,485.1 |
3,135.7 |
34.0 |
70.1 |
|
DURUM |
0.0 |
167.2 |
190.4 |
0.8 |
490.6 |
623.8 |
0.0 |
0.0 |
|
TOTAL |
643.1 |
6,404.7 |
5,157.3 |
498.1 |
16,008.9 |
16,108.4 |
93.5 |
557.6 |
|
BARLEY |
0.0 |
11.8 |
16.7 |
1.5 |
18.7 |
32.0 |
2.0 |
14.5 |
|
CORN |
7,436.5 |
36,089.8 |
11,683.3 |
995.5 |
20,016.7 |
11,107.3 |
83.8 |
887.3 |
|
SORGHUM |
63.7 |
3,112.6 |
350.6 |
309.8 |
2,708.4 |
804.9 |
53.0 |
594.0 |
|
SOYBEANS |
824.0 |
11,131.8 |
5,471.4 |
1,963.4 |
47,525.7 |
26,770.4 |
633.4 |
4,246.4 |
|
SOY MEAL |
301.1 |
2,947.6 |
3,664.2 |
199.4 |
4,251.7 |
3,617.2 |
45.0 |
213.9 |
|
SOY OIL |
10.5 |
243.2 |
272.2 |
1.0 |
340.9 |
330.1 |
0.0 |
0.6 |
|
RICE |
|
|
|
|
|
|
|
|
|
L G RGH |
23.5 |
315.5 |
383.1 |
2.9 |
841.6 |
713.9 |
0.0 |
0.0 |
|
M S RGH |
0.0 |
12.3 |
18.5 |
2.6 |
16.7 |
16.8 |
0.0 |
0.0 |
|
L G BRN |
1.3 |
11.4 |
23.4 |
0.2 |
23.3 |
20.6 |
0.0 |
0.0 |
|
M&S BR |
0.3 |
53.1 |
67.8 |
0.7 |
53.2 |
22.7 |
0.0 |
0.0 |
|
L G MLD |
17.3 |
87.7 |
121.7 |
5.0 |
331.9 |
544.4 |
0.0 |
0.0 |
|
M S MLD |
55.0 |
204.7 |
128.8 |
18.8 |
261.8 |
328.6 |
0.0 |
0.0 |
|
TOTAL |
97.4 |
684.6 |
743.2 |
30.1 |
1,528.5 |
1,647.0 |
0.0 |
0.0 |
|
COTTON |
|
THOUSAND RUNNING BALES |
||||||
|
UPLAND |
286.7 |
6,051.4 |
7,379.5 |
319.0 |
6,714.6 |
5,467.1 |
3.8 |
943.2 |
|
PIMA |
19.0 |
270.6 |
224.2 |
20.2 |
393.9 |
205.2 |
0.0 |
1.1 |
This summary is based on reports from exporters for the period January 22-28, 2021.
Wheat: Net sales of 643,100 metric tons (MT) for 2020/2021 were up 69 percent from the previous week and up noticeably from the prior 4-week average. Increases primarily for China (134,000 MT), Nigeria (129,600 MT, including decreases of 36,000 MT), Mexico (77,100 MT, including decreases of 100 MT), Indonesia (72,000 MT), and the Philippines (68,600 MT, including decreases of 600 MT), were offset by reductions primarily for unknown destinations (31,000 MT). For 2021/2022, net sales of 93,500 MT were reported for Mexico (37,500 MT), the Philippines (34,000 MT), and unknown destinations (22,000 MT). Exports of 498,100 MT were down 2 percent from the previous week, but up 29 percent from the prior 4-week average. The destinations were primarily to Nigeria (99,600 MT), South Korea (77,300 MT), Mexico (69,700 MT), Japan (60,600 MT), and the Philippines (58,300 MT).
Optional Origin Sales: For 2020/2021, the current outstanding balance of 10,000 MT, all Spain.
Corn: Net sales of 7,436,500 MT for 2020/2021–a marketing-year high–were up noticeably from the previous week and from the prior 4-week average. Increases primarily for China (5,860,400 MT, including decreases of 100 MT), Japan (502,900 MT, including 4,500 MT switched from unknown destinations and decreases of 7,100 MT), Mexico (403,700 MT, including decreases of 17,600 MT), unknown destinations (402,900 MT), and South Korea (66,000 MT), were offset by reductions for Ecuador (1,400 MT), Costa Rica (600 MT), and Malaysia (100 MT). For 2021/2022, total net sales of 83,800 MT were reported for Japan. Exports of 995,500 MT were down 30 percent from the previous week and 17 percent from the prior 4-week average. The destinations were primarily to Japan (253,600 MT), China (209,500 MT), Mexico (190,900 MT), Colombia (108,800 MT), and Chile (45,300 MT).
Optional Origin Sales: For 2020/2021, new optional origin sales of 50,000 MT were reported for unknown destinations. The current outstanding balance of 1,319,400 MT is for South Korea (838,000 MT), unknown destinations (274,000 MT), Taiwan (140,000 MT), China (65,000 MT), and Ukraine (2,400 MT).
Barley: No net sales were reported for 2020/2021. For 2021/2022, total net sales of 2,000 MT were reported for Japan. Exports of 1,500 MT were to Japan (1,300 MT) and Taiwan (200 MT).
Sorghum: Net sales of 63,700 MT for 2020/2021 were down 66 percent from the previous week and 62 from the prior 4-week average. Increases reported for China (199,500 MT, including 136,000 MT switched from unknown destinations and decreases of 57,900 MT) and Mexico (200 MT), were offset by reductions for unknown destinations (136,000 MT). For 2021/2022, total net sales of 53,000 MT were for unknown destinations. Exports of 309,800 MT were up noticeably from the previous week and from the prior 4-week average. The destination was China.
Rice: Net sales of 97,400 MT for 2020/2021 were down 33 percent from the previous week, but up 46 percent from the prior 4-week average. Increases primarily for Japan (52,200 MT), Mexico (23,100 MT), Haiti (14,500 MT), El Salvador (4,500 MT, switched from Honduras), and Canada (3,100 MT, including decreases of 200 MT), were offset by reductions for Honduras (4,500 MT). Exports of 30,100 MT were down 48 percent from the previous week and 49 percent from the prior 4-week average. The destinations were primarily to Japan (13,900 MT), Mexico (6,700 MT), Canada (2,900 MT), Saudi Arabia (2,200 MT), and Jordan (1,200 MT).
Soybeans: Net sales of 824,000 MT for 2020/2021 were up 77 percent from the previous week and 4 percent from the prior 4-week average. Increases primarily for China (598,900 MT, including 455,000 MT switched from unknown destinations and decreases of 6,400 MT), Mexico (121,400 MT, including decreases of 1,200 MT), the Netherlands (115,500 MT, including 120,000 MT switched from unknown destinations and decreases of 4,500 MT), Egypt (110,000 MT), and Japan (87,500 MT, including 27,000 MT switched from unknown destinations and decreases of 4,600 MT), were offset by reductions primarily for unknown destinations (409,500 MT). For 2021/2022, net sales of 633,400 MT were primarily for China (528,000 MT), unknown destinations (57,500 MT), and Mexico (47,500 MT). Exports of 1,963,400 MT were down 11 percent from the previous week and 7 percent from the prior 4-week average. The destinations were primarily to China (1,263,600 MT), the Netherlands (115,500 MT), Mexico (93,500 MT), Saudi Arabia (68,000 MT), and Pakistan (67,400 MT).
Exports for Own Account: For 2020/2021, the current exports for own account outstanding balance is 6,100 MT, all Canada.
Soybean Cake and Meal: Net sales of 301,100 MT for 2020/2021 were up noticeably from the previous week and up 12 percent from the prior 4-week average. Increases primarily for the Philippines (135,500 MT), Indonesia (52,900 MT), Venezuela (21,600 MT), Colombia (21,400 MT), and Ireland (19,400 MT, including 18,000 MT switched from unknown destinations), were offset by reductions for unknown destinations (17,300 MT) and Ecuador (1,500 MT). For 2021/2022, total net sales of 45,000 MT were for unknown destinations. Exports of 199,400 MT were down 43 percent from the previous week and 26 percent from the prior 4-week average. The destinations were primarily to Bangladesh (48,600 MT), Mexico (41,600 MT), Ireland (19,400 MT), Canada (19,400 MT), and Venezuela (18,600 MT).
Soybean Oil: Net sales of 10,500 MT for 2020/2021 were down 45 percent from the previous week and 51 percent from the prior 4-week average. Increases primarily for Colombia (7,300 MT), Guatemala (5,000 MT), Canada (4,600 MT), Venezuela (3,000 MT), and South Korea (2,000 MT), were offset by reductions for unknown destinations (15,000 MT). Exports of 1,000 MT were down 98 percent from the previous week and 97 percent from the prior 4-week average. The destinations were primarily to Mexico (600 MT).
Cotton: Net sales of 286,700 RB for 2020/2021 were down 11 percent from the previous week, but up 5 percent from the prior 4-week average. Increases primarily for China (85,400 RB, including 1,300 RB switched from Hong Kong and 400 RB switched from Germany), Turkey (71,400 RB), Pakistan (51,200 RB), Vietnam (30,200 RB, including 300 RB switched from Japan), and Indonesia (21,700 RB, including decreases of 2,800 RB), were offset by reductions for Guatemala (1,800 RB), Hong Kong (1,300 RB), and Germany (400 RB). For 2021/2022, net sales of 3,800 RB reported for Thailand (9,200 RB) and Indonesia (7,400 RB), were offset by reductions for China (10,600 RB) and Mexico (2,200 RB). Exports of 319,000 RB were up 16 percent from the previous week and 12 percent from the prior 4-week average. Exports were primarily to China (106,500 RB), Vietnam (72,000 RB), Pakistan (42,300 RB), Mexico (18,300 RB), and Turkey (17,100 RB). Net sales of Pima totaling 19,000 RB were down 27 percent from the previous week and 17 percent from the prior 4-week average. Increases were primarily for China (13,100 RB), India (3,100 RB), Turkey (800 RB), South Korea (500 RB), and Pakistan (400 RB). Exports of 20,200 RB were up 61 percent from the previous week and 85 percent from the prior 4-week average. The destinations were primarily to Vietnam (5,600 RB), India (4,600 RB), China (2,400 RB), Pakistan (1,900 RB), and Peru (1,600 RB).
Exports for Own Account: For 2020/2021, new exports for own account totaling 7,900 RB were to China (5,800 RB) and Vietnam (2,100 RB). Exports for own account totaling 1,000 RB to Indonesia were applied to new or outstanding sales. The current exports for own account outstanding balance of 15,500 RB is for China (11,700 RB) and Vietnam (3,800 RB).
Hides and Skins: Net sales of 421,300 pieces for 2021, primarily for China (289,700 whole cattle hides, including decreases of 10,500 pieces), South Korea (80,400 whole cattle hides, including decreases of 1,500 pieces), Mexico (18,600 whole cattle hides, including decreases of 1,700 pieces), Thailand (12,100 whole cattle hides, including decreases of 1,000 pieces), and Taiwan (9,600 whole cattle hides, including decreases of 200 pieces), were offset by reductions primarily for Brazil (600 pieces). Additionally, net sales of 7,300 kip skins resulting in increases for Belgium (7,500 Kip skins, including decreases of 500 kip skins), were offset by reductions for Italy (100 kip skins). Exports of 409,700 pieces for 2021 were primarily to China (258,000 pieces), South Korea (67,500 pieces), Mexico (44,800 pieces), Thailand (15,700 pieces), and Brazil (10,200 pieces). Additionally, exports of 7,000 kip skins were primarily to Belgium (5,100 kip skins).
Net sales of 94,900 wet blues for 2021, primarily for Italy (56,900 unsplit and 200 grain splits), China (23,700 unsplit and 2,700 grain splits, including decreases of 200 grain splits), Vietnam (4,400 unsplit, including decreases of 100 unsplit), South Korea (3,200 grain splits), and Brazil (1,800 unsplit, including decreases of 100 unsplit), were offset by reductions for Thailand (300 unsplit) and Taiwan (100 unsplit). Exports of 165,800 wet blues for 2021 were primarily to China (47,900 unsplit ad 7,600 grain splits), Vietnam (44,700 unsplit), Italy (31,500 unsplit and 7,800 grain splits), Thailand (10,200 unsplit), and Brazil (7,300 unsplit). Net sales reductions of 75,600 splits were reported for Vietnam (54,900 pounds, including decreases of 55,100 pounds) and China (20,700 pounds). Exports of 325,400 pounds were to Vietnam (281,400 pounds) and China (44,000 pounds).
Pork: Net sales of 46,300 MT reported for 2021, increases primarily for China (17,900 MT, including decreases of 1,300 MT), Mexico (10,300 MT, including decreases of 500 MT), Japan (4,000 MT, including decreases of 100 MT), Canada (2,900 MT, including decreases of 400 MT), and the Philippines (2,600 MT, including decreases of 200 MT), were offset by reductions primarily for El Salvador (100 MT). Exports of 38,300 MT were primarily to China (12,000 MT), Mexico (10,800 MT), Japan (4,600 MT), South Korea (2,700 MT), and Canada (1,800 MT).
February 4, 2021 1 FOREIGN AGRICULTURAL SERVICE/USDA
SUMMARY OF EXPORT TRANSACTIONS
REPORTED UNDER THE DAILY SALES REPORTING SYSTEM
FOR PERIOD ENDING JANUARY 28, 2020
COMMODITY DESTINATION QUANITY (MT) MARKETING YEAR
CORN CHINA 5,848,000 MT 1/ 2020/2021
CORN UNKNOWN 316,400 MT 1/ 2020/2021
CORN MEXICO 125,730 MT 1/ 2020/2021
CORN JAPAN 110,000 MT 1/ 2020/2021
SOYBEANS CHINA 264,000 MT 1/ 2021/2022
SOYBEANS UNKNOWN 126,500 MT 1/ 2020/2021
SOYBEAN MEAL PHILIPPINES 133,000 MT 1/ 2020/2021
1/ Export Sales.
Terry Reilly
Senior Commodity Analyst – Grain and Oilseeds
Futures International
One Lincoln Center
18 W 140 Butterfield Rd.
Oakbrook Terrace, Il. 60181
W: 312.604.1366
ICE IM: treilly1
Skype: fi.treilly

Trading of futures, options, swaps and other derivatives is risky and is not suitable for all persons. All of these investment products are leveraged, and you can lose more than your initial deposit. Each investment product is offered only to and from jurisdictions where solicitation and sale are lawful, and in accordance with applicable laws and regulations in such jurisdiction. The information provided here should not be relied upon as a substitute for independent research before making your investment decisions. Futures International, LLC is merely providing this information for your general information and the information does not take into account any particular individual’s investment objectives, financial situation, or needs. All investors should obtain advice based on their unique situation before making any investment decision. The contents of this communication and any attachments are for informational purposes only and under no circumstances should they be construed as an offer to buy or sell, or a solicitation to buy or sell any future, option, swap or other derivative. The sources for the information and any opinions in this communication are believed to be reliable, but Futures International, LLC does not warrant or guarantee the accuracy of such information or opinions. Futures International, LLC and its principals and employees may take positions different from any positions described in this communication. Past results are not necessarily indicative of future results.