PDF attached
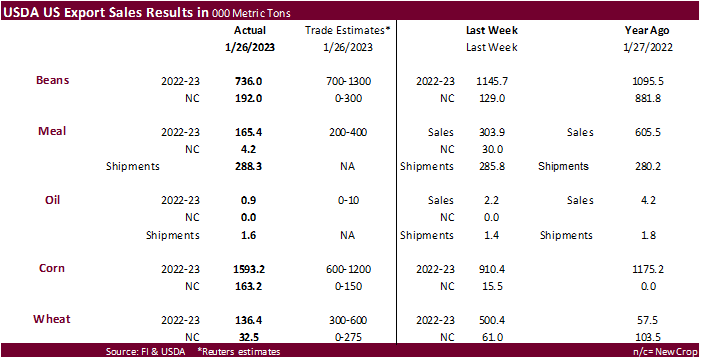
Soybean sales were near the low end of trade expectations while corn came in above a trade range. The corn sales included 432,100 tons for unknown and 319,500 tons for China (136,000 switched from unknown). The Soybean sales included China for 782,400 tons but 613,000 tons were switched from unknown. Soybean meal sales were poor and soybean oil again well below its respected average. All-wheat sales significantly slowed. One cargo was booked by Egypt. Sorghum sales were good at 110,500 tons (57,500 unknown and 53,000 China). Pork sales of 30,900 tons were good again and included 15,100 tons for Mexico and 3,700 for Japan.
U.S. EXPORT SALES FOR WEEK ENDING 1/26/2023
|
|
CURRENT MARKETING YEAR |
NEXT MARKETING YEAR |
||||||
|
COMMODITY |
NET SALES |
OUTSTANDING SALES |
WEEKLY EXPORTS |
ACCUMULATED EXPORTS |
NET SALES |
OUTSTANDING SALES |
||
|
CURRENT YEAR |
YEAR AGO |
CURRENT YEAR |
YEAR AGO |
|||||
|
|
THOUSAND METRIC TONS |
|||||||
|
WHEAT |
|
|
|
|
|
|
|
|
|
HRW |
14.9 |
905.2 |
2,036.6 |
137.9 |
3,487.6 |
4,815.0 |
0.0 |
91.3 |
|
SRW |
24.2 |
717.2 |
710.6 |
28.7 |
1,816.2 |
1,848.1 |
23.0 |
124.6 |
|
HRS |
38.5 |
1,247.8 |
1,266.7 |
204.8 |
3,580.6 |
3,366.3 |
0.0 |
49.8 |
|
WHITE |
60.9 |
1,262.2 |
751.0 |
95.2 |
2,842.6 |
2,300.2 |
9.1 |
23.4 |
|
DURUM |
-2.0 |
113.2 |
54.6 |
29.5 |
198.0 |
113.1 |
0.4 |
1.9 |
|
TOTAL |
136.4 |
4,245.6 |
4,819.5 |
496.2 |
11,925.0 |
12,442.8 |
32.5 |
291.0 |
|
BARLEY |
0.0 |
4.4 |
17.1 |
0.0 |
7.2 |
13.4 |
0.0 |
0.0 |
|
CORN |
1,593.2 |
13,021.3 |
25,557.6 |
598.3 |
12,610.6 |
19,565.7 |
163.2 |
1,427.1 |
|
SORGHUM |
110.5 |
437.8 |
4,130.0 |
0.9 |
293.4 |
2,086.0 |
0.0 |
0.0 |
|
SOYBEANS |
736.0 |
11,683.1 |
8,868.1 |
1,959.6 |
35,588.3 |
36,295.4 |
192.0 |
718.0 |
|
SOY MEAL |
165.4 |
3,149.6 |
3,263.6 |
288.3 |
3,885.4 |
4,216.9 |
4.2 |
52.5 |
|
SOY OIL |
0.9 |
18.5 |
178.5 |
1.5 |
22.9 |
306.3 |
0.0 |
0.6 |
|
RICE |
|
|
|
|
|
|
|
|
|
L G RGH |
6.6 |
89.0 |
215.4 |
1.5 |
245.7 |
671.5 |
0.0 |
0.0 |
|
M S RGH |
0.0 |
11.1 |
9.9 |
1.1 |
15.8 |
3.8 |
0.0 |
0.0 |
|
L G BRN |
0.1 |
4.8 |
20.0 |
0.5 |
11.4 |
28.4 |
0.0 |
0.0 |
|
M&S BR |
0.1 |
35.8 |
68.3 |
0.1 |
8.4 |
17.0 |
0.0 |
0.0 |
|
L G MLD |
16.0 |
144.8 |
76.9 |
23.4 |
340.2 |
435.4 |
0.0 |
0.0 |
|
M S MLD |
1.7 |
133.6 |
155.1 |
1.5 |
123.3 |
213.6 |
0.0 |
0.0 |
|
TOTAL |
24.4 |
419.0 |
545.6 |
28.2 |
744.8 |
1,369.8 |
0.0 |
0.0 |
|
COTTON |
|
THOUSAND RUNNING BALES |
||||||
|
UPLAND |
171.2 |
4,864.1 |
8,087.6 |
212.2 |
4,589.1 |
3,903.1 |
20.2 |
1,256.4 |
|
PIMA |
-0.8 |
53.1 |
214.8 |
7.8 |
77.2 |
179.8 |
2.4 |
3.5 |
Export Sales Highlights
This summary is based on reports from exporters for the period January 20-26, 2023.
Wheat: Net sales of 136,400 metric tons (MT) for 2022/2023 were down 73 percent from the previous week and 51 percent from the prior 4-week average. Increases primarily for Egypt (60,000 MT switched from unknown destinations), Jamaica (22,000 MT), Singapore (22,000 MT switched from Thailand), Trinidad and Tobago (17,400 MT, including 9,500 MT switched from the Dominican Republic), and Peru (12,500 MT), were offset by reductions primarily for Thailand (19,600 MT), the Dominican Republic (9,200 MT), Japan (6,900 MT), Mexico (2,700 MT), and Panama (1,500). Net sales of 32,500 for 2023/2024 were primarily for Mexico (23,000 MT) and Japan (9,100 MT). Exports of 496,200 MT were up 88 percent from the previous week and up noticeably from the prior 4-week average. The destinations were primarily to Japan (98,500 MT), Mexico (85,900 MT), Thailand (58,100 MT), Iraq (52,500 MT), and Chile (47,400 MT).
Corn: Net sales of 1,593,200 MT for 2022/2023 were up 75 percent from the previous week and up noticeably from the prior 4-week average. Increases primarily for unknown destinations (423,100 MT), Mexico (323,600 MT, including decreases of 78,000 MT), China (319,500 MT, including 136,000 MT switched from unknown destinations and 140,000 MT – late), Colombia (196,500 MT), and El Salvador (55,300 MT, including 34,800 MT switched from Guatemala and decreases of 2,800 MT), were offset by reductions for Guatemala (22,500 MT) and Canada (500 MT). Net sales of 163,200 MT for 2023/2024 were reported for Mexico (152,200 MT) and Japan (11,000 MT). Exports of 598,300 MT were down 34 percent from the previous week and 14 percent from the prior 4-week average. The destinations were primarily to Mexico (227,900 MT), China (138,700 MT), Japan (102,000 MT), El Salvador (58,600 MT), and Panama (18,000 MT).
Late Reporting: For 2022/2023, net sales totaling 140,000 MT of corn were reported late for China.
Barley: No net sales or exports were reported for the week.
Sorghum: Net sales of 110,500 MT for 2022/2023 were up 56 percent from the previous week and 70 percent from the prior 4-week average. Increases were reported for unknown destinations (57,500 MT) and China (53,000 MT). Exports of 900 MT were down 99 percent from the previous week and 95 percent from the prior 4-week average. The destination was to Mexico.
Rice: Net sales of 24,400 MT for 2022/2023 were down 43 percent from the previous week and 21 percent from the prior 4-week average. Increases were primarily for Haiti (15,100 MT, including decreases of 200 MT), Honduras (5,600 MT), Canada (1,100 MT, including decreases of 100 MT), Guatemala (1,000 MT), and Mexico (500 MT). Exports of 28,200 MT were down 58 percent from the previous week and 33 percent from the prior 4-week average. The destinations were primarily to Haiti (22,200 MT), Mexico (2,900 MT), Canada (2,200 MT), Belgium (200 MT), and the Netherlands (100 MT).
Soybeans: Net sales of 736,000 MT for 2022/2023 were down 36 percent from the previous week and 18 percent from the prior 4-week average. Increases primarily for China (782,400 MT, including 613,000 MT switched from unknown destinations and decreases of 10,200 MT), Japan (96,300 MT, including 73,700 MT switched from unknown destinations and decreases of 2,100 MT), Indonesia (86,000 MT, including 68,000 MT switched from unknown destinations and decreases of 300 MT), Taiwan (71,300 MT, including 66,000 MT switched from unknown destinations and decreases of 1,200 MT), and the Netherlands (68,000 MT, including 66,000 MT switched from unknown destinations), were offset by reductions primarily for unknown destinations (523,200 MT). Net sales of 192,000 MT for 2023/2024 were reported for unknown destinations (132,000 MT) and China (60,000 MT). Exports of 1,959,600 MT were up 3 percent from the previous week and 11 percent from the prior 4-week average. The destinations were primarily to China (1,415,300 MT), Japan (123,600 MT), Taiwan (94,100 MT), Indonesia (90,700 MT), and Vietnam (70,900 MT).
Optional Origin Sales: For 2022/2023, the current outstanding balance of 300 MT, all South Korea.
Export for Own Account: For 2022/2023, the current exports for own account outstanding balance is 1,500 MT, all Canada.
Soybean Cake and Meal: Net sales of 165,400 MT for 2022/2023 were down 46 percent from the previous week and 12 percent from the prior 4-week average. Increases primarily for the United Kingdom (30,000 MT switched from Ireland), Panama (29,500 MT, including decreases of 100 MT), Morocco (27,000 MT), Colombia (26,700 MT, including decreases of 2,300 MT), and Canada (20,400 MT, including decreases of 5,400 MT), were offset by reductions primarily for Ireland (30,000 MT) and Spain (14,000 MT). Total net sales of 4,200 MT for 2023/2024 were for Canada. Exports of 288,300 MT were up 1 percent from the previous week and 3 percent from the prior 4-week average. The destinations were primarily to Venezuela (64,400 MT), the Philippines (50,200 MT), Colombia (45,800 MT), Mexico (31,800 MT), and Honduras (26,300 MT).
Soybean Oil: Net sales of 900 MT for 2022/2023 were down 62 percent from the previous week and 12 percent from the prior 4-week average. Increases were primarily for Mexico (700 MT). Exports of 1,500 MT were up 10 percent from the previous week and 99 percent from the prior 4-week average. The destinations were to Mexico (1,000 MT) and Canada (500 MT).
Cotton: Net sales of 171,200 RB for 2022/2023 were down 20 percent from the previous week, but up 28 percent from the prior 4-week average. Increases primarily for China (119,800 RB, including decreases of 3,300 RB), Turkey (44,000 RB, including decreases of 11,800 RB), Indonesia (8,800 RB, including 1,600 RB switched from Japan and decreases of 300 RB), Taiwan (2,000 RB), and Japan (900 RB), were offset by reductions primarily for Mexico (2,800 RB) and Thailand (1,200 RB). Net sales of 20,200 RB for 2023/2024 were reported for Turkey (18,000 RB) and Thailand (2,200 RB). Exports of 212,200 RB were up 21 percent from the previous week and 41 percent from the prior 4-week average. The destinations were primarily to China (59,200 RB), Pakistan (45,300 RB), Turkey (24,400 RB), Vietnam (20,400 RB), and Mexico (18,000 RB). Net sales reductions of Pima totaling 800 RB for 2022/2023 were down noticeably from the previous week and from the prior 4-week average. Increases reported for Turkey (1,100 RB, including 100 RB switched from India), Egypt (900 RB), Pakistan (400 RB), and Japan (200 RB), were more than offset by reductions for Italy (1,300 RB), Taiwan (900 RB), Peru (900 RB), India (200 RB), and China (100 RB). Total net sales of Pima totaling 2,400 RB for 2023/2024 were for Italy. Exports of 7,800 RB were up noticeably from the previous week and up 72 percent from the prior 4-week average. The destinations were primarily to India (5,400 RB), Indonesia (1,000 RB), Turkey (500 RB), Thailand (400 RB), and Japan (200 RB).
Optional Origin Sales: For 2022/2023, the current outstanding balance of 9,300 RB, all Malaysia.
Export for Own Account: For 2022/2023, new exports for own account totaling 24,800 RB were to China (19,400 RB), South Korea (2,400 RB), Turkey (1,600 RB), and Vietnam (1,400 RB). Exports for own account totaling 14,000 RB primarily to Vietnam (7,200 RB) and China (6,300 RB) were applied to new or outstanding sales. The current exports for own account outstanding balance of 114,700 RB are for China (88,100 RB), Vietnam (16,100 RB), Pakistan (5,000 RB), South Korea (2,400 RB), Turkey (1,600 RB), and India (1,500 RB).
Hides and Skins: Net sales of 356,200 pieces for 2023 primarily for China (213,700 whole cattle hides, including decreases of 19,600 pieces), South Korea (52,700 whole cattle hides, including decreases of 3,600 pieces), Mexico (48,900 whole cattle hides, including decreases of 1,000 pieces), Turkey (22,400 whole cattle hides, including decreases of 100 pieces), and Indonesia (7,400 whole cattle hides), were offset by reductions primarily for Thailand (1,200 pieces). Total net sales reductions of 4,500 calf skins were for Italy. In addition, net sales of 2,100 kip skins were reported for China (1,200 kip skins) and Italy (1,100 kip skins), were offset by reductions for Canada (200 kip skins). Exports of 505,800 whole cattle hides exports were primarily to China (315,200 pieces), South Korea (84,100 pieces), Mexico (55,700 pieces), Turkey (12,900 pieces), and Thailand (9,800 pieces). Exports of 5,800 calf skins were to Italy. In addition, exports of 1,300 kip skins were to Canada.
Net sales of 62,200 wet blues for 2023 primarily for Italy (25,300 unsplit, including decreases of 900 unsplit), Vietnam (24,000 unsplit), China (5,200 unsplit), Thailand (4,500 unsplit), and South Korea (3,200 grain splits), were offset by reductions for Brazil (200 grain splits). Exports of 107,300 wet blues were primarily to Italy (56,700 unsplit), Vietnam (14,400 unsplit), China (10,800 unsplit), Mexico (7,200 unsplit), and Thailand (6,200 unsplit). Net sales reductions of 15,700 splits for 2023 were reported for Hong Kong (8,800 pounds), Vietnam (6,500 pounds), and China (400 pounds). No exports of splits were reported this week.
Beef: Net sales of 25,200 MT for 2023 were primarily for South Korea (7,100 MT, including decreases of 400 MT), Japan (6,800 MT, including decreases of 700 MT), China (4,300 MT, including decreases of 100 MT), Mexico (3,300 MT, including decreases of 100 MT), and Canada (2,100 MT, including decreases of 200 MT). Exports of 18,900 MT were primarily to South Korea (5,300 MT), Japan (4,900 MT), China (3,500 MT), Mexico (1,800 MT), and Taiwan (1,000 MT).
Pork: Net sales of 30,900 MT for 2023 primarily for Mexico (15,100 MT, including decreases of 400 MT), Japan (3,700 MT, including decreases of 700 MT), Canada (3,100 MT, including decreases of 500 MT), Colombia (2,200 MT, including decreases of 200 MT), and Australia (2,200 MT), were offset by reductions for Vietnam (100 MT). Exports of 35,500 MT were primarily to Mexico (16,400 MT), China (5,700 MT), Japan (3,800 MT), South Korea (2,800 MT), and Canada (2,400 MT).
Terry Reilly
Senior Commodity Analyst – Grain and Oilseeds
Futures International
One Lincoln Center
18W140 Butterfield Rd.
Suite 1450
Oakbrook Terrace, Il. 60181
Work: 312.604.1366
ICE IM: treilly1
Skype IM: fi.treilly
DISCLAIMER:
The contents of this communication and any attachments are for informational purposes only and under no circumstances should they be construed as an offer to buy or sell, or a solicitation to buy or sell any future, option, swap or other derivative. The sources for the information and any opinions in this communication are believed to be reliable, but Futures International, LLC does not warrant or guarantee the accuracy of such information or opinions. This communication may contain links to third party websites which are not under the control of FI and FI is not responsible for their content.
Trading of futures, options, swaps and other derivatives is risky and is not suitable for all persons. All of these investment products are leveraged, and you can lose more than your initial deposit. Each investment product is offered only to and from jurisdictions where solicitation and sale are lawful, and in accordance with applicable laws and regulations in such jurisdiction. The information provided here should not be relied upon as a substitute for independent research before making your investment decisions. Futures International, LLC is merely providing this information for your general information and the information does not take into account any particular individual’s investment objectives, financial situation, or needs. All investors should obtain advice based on their unique situation before making any investment decision. Futures International, LLC and its principals and employees may take positions different from any positions described in this communication. Past results are not necessarily indicative of future results.
#non-promo