PDF attached
USDA export sales
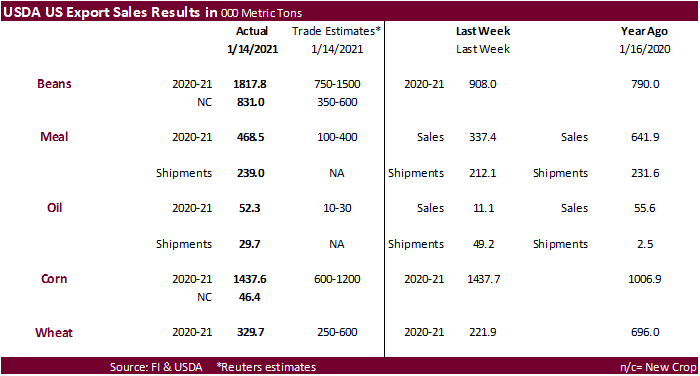
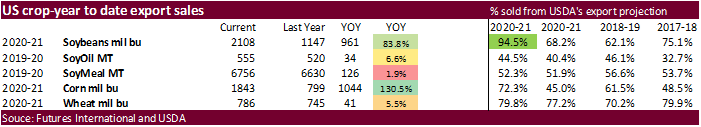
USDA export sales were above expectations for soybeans, meal, soybean oil and corn. They were within expectations for wheat. The report was viewed as supportive all around. China committed 864,100 tons of soybeans (including 396,000 switched from unknown) for old crop and 319,000 tons for new-crop. Pork sales were 45,200 tons and included 9,700 for China. Sorghum sales were 293,500 tons and included 268,500 tons for China.
This summary is based on reports from exporters for the period January 8-14, 2021.
Wheat: Net sales of 329,600 metric tons (MT) for 2020/2021 were up 49 percent from the previous week, but down 7 percent from the prior 4-week average. Increases primarily for Indonesia (105,900 MT, including 49,900 MT switched from unknown destinations and decreases of 700 MT), Japan (76,900 MT, including decreases of 600 MT), unknown destinations (75,500 MT), China (65,000 MT), and Mexico (46,200 MT, including decreases of 33,200 MT), were offset by reductions primarily for Nigeria (49,900 MT). Exports of 264,000 MT were down 26 percent from the previous week and 33 percent from the prior 4-week average. The destinations were primarily to Indonesia (108,400 MT), Mexico (84,300 MT), Japan (27,400 MT), Taiwan (19,100 MT), and Peru (13,000 MT).
Optional Origin Sales: For 2020/2021, the current outstanding balance of 10,000 MT, all Spain.
Corn: Net sales of 1,437,600 MT for 2020/2021 were unchanged from the previous week, but up 51 percent from the prior 4-week average. Increases primarily for Mexico (588,400 MT, including decreases of 14,300 MT), Japan (420,600 MT, including 50,000 MT switched from unknown destinations and decreases of 30,800 MT), Colombia (126,000 MT, including 93,500 MT switched from unknown destinations and decreases of 61,300 MT), Nicaragua (97,900 MT), and Morocco (81,000 MT), were offset by reductions primarily for unknown destinations (136,500 MT). For 2021/2022, total net sales of 46,400 MT were for Japan. Exports of 886,700 MT were down 39 percent from the previous week and 24 percent from the prior 4-week average. The destinations were primarily to Mexico (198,000 MT), Colombia (168,000 MT), Japan (152,800 MT), South Korea (72,500 MT), and China (71,400 MT).
Optional Origin Sales: For 2020/2021, options were exercised to export 52,000 MT to Japan from other than the United States. The current outstanding balance of 1,299,400 MT is for South Korea (838,000 MT), unknown destinations (224,000 MT), Taiwan (140,000 MT), China (65,000 MT), and Ukraine (32,400 MT).
Barley: No net sales or exports were reported for the week.
Sorghum: Net sales of 293,500 MT for 2020/2021 were up 54 percent from the previous week and up noticeably from the prior 4-week average. Increases were primarily for China (268,500 MT, including 30,000 MT switched from unknown destinations and decreases of 7,500 MT) and unknown destinations (25,000 MT). Exports of 220,500 MT were up noticeably from the previous week and up 95 percent from the prior 4-week average. The destinations were China (220,400 MT) and South Korea (100 MT).
Rice: Net sales of 69,800 MT for 2020/2021 were up noticeably from the previous week and up 33 percent from the prior 4-week average. Increases were primarily for Haiti (17,000 MT, including decreases of 100 MT), Mexico (16,700 MT), Honduras (7,200 MT), Japan (6,900 MT), and Taiwan (5,500 MT). Exports of 57,300 MT were up noticeably from the previous week, but down 21 percent from the prior 4-week average. The destinations were primarily to Mexico (24,100 MT), Haiti (22,400 MT), Canada (2,900 MT), Jordan (1,800 MT), and Japan (1,500 MT).
Exports for Own Account: For 2020/2021, the current exports for own account outstanding balance is 100 MT, all Canada.
Soybeans: Net sales of 1,817,700 MT for 2020/2021 were up noticeably from the previous week and from the prior 4-week average. Increases primarily for China (864,100 MT, including 396,000 MT switched from unknown destinations and decreases of 17,900 MT), the Netherlands (236,000 MT, including 101,000 MT switched from unknown destinations and decreases of 500 MT), Mexico (113,400 MT, including decreases of 500 MT), Pakistan (67,300 MT, including 66,000 MT switched from unknown destinations and decreases of 2,300 MT), and Spain (60,200 MT, including 60,000 MT switched from unknown destinations), were offset by reductions for Bangladesh (5,000 MT) and Peru (800 MT). For 2021/2022, net sales of 831,000 MT were for unknown destinations (452,000 MT), China (319,000 MT), and Spain (60,000 MT). Exports of 2,379,100 MT were up 17 percent from the previous week and 9 percent from the prior 4-week average. The destinations were primarily to China (1,349,900 MT), Pakistan (137,300 MT, including 67,700 MT late–see below), the Netherlands (106,000 MT), Egypt (98,400 MT), and Thailand (94,200 MT).
Exports for Own Account: For 2020/2021, the current exports for own account outstanding balance is 6,100 MT, all Canada.
Late Reporting: For 2020/2021, exports totaling 67,700 MT were reported late to Pakistan.
Export Adjustments: Accumulated export of soybeans to Spain were adjusted down 66,924 MT for week ending November 26th. The correct destination for these shipments is Italy (41,924 MT) and Romania (25,000 MT) are included in this week’s report. Accumulated export of soybeans to the Netherlands were adjusted down 59,317 MT for week ending December 31st. The correct destination for these shipments is Germany and is included in this week’s report.
Soybean Cake and Meal: Net sales of 468,500 MT for 2020/2021–marketing-year high–were up 39 percent from the previous week and up noticeably from the prior 4-week average. Increases primarily for Morocco (106,500 MT), Colombia (69,800 MT), Ecuador (55,000 MT), Vietnam (50,000 MT, switched from unknown destinations), and Mexico (48,800 MT, including decreases of 3,000 MT), were offset by reductions primarily for unknown destinations (80,000 MT). Exports of 239,000 MT were up 13 percent from the previous week, but down 12 percent from the prior 4-week average. The destinations were primarily to the Philippines (47,600 MT), Ecuador (33,300 MT), Spain (29,100 MT), Canada (26,900 MT), and Guatemala (26,400 MT).
Soybean Oil: Net sales of 52,300 MT for 2020/2021 were up noticeably from the previous week and from the prior 4-week average. Increases primarily for Guatemala (22,900 MT, including decreases of 200 MT), the Dominican Republic (13,400 MT, including decrease 8,200 MT), South Korea (11,000 MT), Peru (4,100 MT), and Canada (700 MT), were offset by reductions primarily for Venezuela (100 MT). Exports of 29,700 MT were down 40 percent from the previous, but up 22 percent from the prior 4-week average. The destinations were primarily to Peru (11,500 MT), Venezuela (7,500 MT), Colombia (6,600 MT), Guatemala (2,900 MT), and Mexico (700 MT).
Cotton: Net sales of 292,400 RB for 2020/2021 were down 10 percent from the previous week and 1 percent from the prior 4-week average. Increases primarily for Vietnam (123,700 RB, including 200 RB switched from Japan), Pakistan (66,100 RB, including decreases of 200 RB), Turkey (46,000 RB), Bangladesh (37,600 RB), and Indonesia (13,400 RB, including 200 RB switched from Japan and decreases of 2,800 RB), were offset by reductions primarily for China (22,300 RB). For 2021/2022, net sales of 39,500 RB were primarily for Bangladesh (18,000 RB), Pakistan (11,000 RB), Mexico (6,000 RB), and Turkey (4,4000 RB). Exports of 322,400 RB were up 17 percent from the previous week and 18 percent from the prior 4-week average. Exports were primarily to China (137,100 RB), Pakistan (54,800 RB), Vietnam (39,400 RB), Mexico (21,000 RB), and Turkey (13,300 RB). Net sales of Pima totaling 23,800 RB were down 34 percent from the previous week, but up 8 percent from the prior 4-week average. Increases were primarily for India (9,300 RB, including 400 RB switched from Pakistan), Vietnam (4,400 RB), Peru (1,900 RB), United Arab Emirates (1,900 RB), and Turkey (1,600 RB). Exports of 8,400 RB were down 19 percent from the previous week and 36 percent from the prior 4-week average. The destinations were primarily to India (2,500 RB), Bangladesh (2,200 RB), Honduras (1,200 RB), Pakistan (1,000 RB), and Peru (900 RB).
Exports for Own Account: For 2020/2021, new exports for own account totaling 2,400 RB were to China (1,900 RB) and Indonesia (400 RB). Exports for own account totaling 1,700 RB to China were applied to new or outstanding sales. The current exports for own account outstanding balance of 5,100 RB is for China (4,700 RB) and Indonesia (400 RB).
Hides and Skins: Net sales of 367,900 pieces for 2021, primarily for China (232,200 whole cattle hides, including decreases of 16,200 pieces), South Korea (71,500 whole cattle hides, including decreases of 6,300 pieces), Mexico (33,000 whole cattle hides, including decreases of 6,400 pieces), Brazil (15,600 whole cattle hides), and Thailand (7,600 whole cattle hides, including decreases of 800 pieces), were offset by reductions for Japan (200 pieces). Exports of 396,200 pieces for 2021 were primarily to China (245,800 pieces), South Korea (79,500 pieces), Mexico (38,400 pieces), Taiwan (14,100 pieces), and Thailand (11,100 pieces).
Net sales of 198,000 wet blues for 2021, primarily for China (96,800 unsplit), Vietnam (85,700 unsplit, including decreases of 700 unsplit), Italy (7,400 unsplit and 200 grain splits, including decreases of 200 unsplit), Mexico (4,500 grain splits and 1,700 unsplit), and Taiwan (1,800 unsplit), were offset by reductions primarily for Thailand (200 unsplit). Exports of 134,000 wet blues for 2021 were primarily to Vietnam (44,400 unsplit and 1,900 grain splits), China (33,900 unsplit), Italy (11,100 unsplit and 8,100 grain splits), Thailand (14,700 unsplit), and Brazil (6,800 unsplit). Net sales of splits, 361,200 pounds for 2021, were reported for China (354,300 pounds) and Vietnam (6,900 pounds, including decreases of 400 pounds). Total exports of 323,300 pounds were to Vietnam.
Pork: Net sales of 45,200 MT reported for 2021, increases primarily for Mexico (13,200 MT, including decreases of 800 MT), China (9,700 MT, including decreases of 1,100 MT), Canada (5,000 MT, including decreases of 400 MT), the Philippines (4,500 MT, including decreases of 800 MT), and Japan (4,200 MT, including decreases of 100 MT), were offset by reductions primarily for El Salvador (100 MT) and Australia (100 MT). Exports of 40,800 MT were primarily to Mexico (13,300 MT), China (10,600 MT), Japan (5,000 MT), South Korea (3,900 MT), and Canada (1,900 MT).
U.S. EXPORT SALES FOR WEEK ENDING 01/14/2021
|
|
CURRENT MARKETING YEAR |
NEXT MARKETING YEAR |
||||||
|
COMMODITY |
NET SALES |
OUTSTANDING SALES |
WEEKLY EXPORTS |
ACCUMULATED EXPORTS |
NET SALES |
OUTSTANDING SALES |
||
|
CURRENT YEAR |
YEAR |
CURRENT YEAR |
YEAR |
|||||
|
|
THOUSAND METRIC TONS |
|||||||
|
WHEAT |
|
|
|
|
|
|
|
|
|
HRW |
30.9 |
1,393.6 |
1,608.9 |
83.6 |
5,854.6 |
5,825.2 |
0.0 |
22.0 |
|
SRW |
-1.7 |
475.5 |
437.2 |
22.0 |
1,109.8 |
1,692.6 |
0.0 |
145.0 |
|
HRS |
160.1 |
1,921.9 |
1,430.6 |
54.6 |
4,349.5 |
4,373.7 |
0.0 |
45.0 |
|
WHITE |
70.4 |
2,423.2 |
1,128.5 |
103.7 |
3,202.2 |
2,970.0 |
0.0 |
36.1 |
|
DURUM |
70.0 |
170.8 |
190.4 |
0.0 |
488.9 |
623.8 |
0.0 |
0.0 |
|
TOTAL |
329.6 |
6,384.9 |
4,795.6 |
264.0 |
15,005.0 |
15,485.3 |
0.0 |
248.1 |
|
BARLEY |
0.0 |
13.7 |
29.8 |
0.0 |
16.9 |
29.9 |
0.0 |
12.5 |
|
CORN |
1,437.6 |
29,212.4 |
10,481.8 |
886.7 |
17,607.3 |
9,826.3 |
46.4 |
803.4 |
|
SORGHUM |
293.5 |
3,292.2 |
508.4 |
220.5 |
2,280.1 |
632.0 |
0.0 |
478.0 |
|
SOYBEANS |
1,817.7 |
13,999.7 |
6,977.5 |
2,379.1 |
43,367.8 |
24,225.9 |
831.0 |
2,048.6 |
|
SOY MEAL |
468.5 |
3,052.3 |
3,373.8 |
239.0 |
3,703.7 |
3,256.1 |
0.0 |
78.9 |
|
SOY OIL |
52.3 |
270.5 |
197.3 |
29.7 |
284.0 |
322.7 |
0.0 |
0.6 |
|
RICE |
|
|
|
|
|
|
|
|
|
L G RGH |
27.1 |
207.4 |
345.8 |
22.6 |
809.6 |
681.5 |
0.0 |
0.0 |
|
M S RGH |
0.0 |
14.8 |
19.3 |
0.8 |
14.1 |
16.0 |
0.0 |
0.0 |
|
L G BRN |
0.1 |
10.3 |
21.8 |
0.3 |
23.0 |
20.2 |
0.0 |
0.0 |
|
M&S BR |
9.8 |
53.5 |
71.0 |
1.6 |
52.2 |
19.0 |
0.0 |
0.0 |
|
L G MLD |
14.0 |
61.2 |
135.9 |
24.9 |
323.0 |
522.7 |
0.0 |
0.0 |
|
M S MLD |
18.9 |
183.2 |
132.3 |
7.2 |
218.2 |
295.6 |
0.0 |
0.0 |
|
TOTAL |
69.8 |
530.5 |
726.1 |
57.3 |
1,440.1 |
1,555.0 |
0.0 |
0.0 |
|
COTTON |
|
THOUSAND RUNNING BALES |
||||||
|
UPLAND |
292.4 |
6,036.2 |
7,446.0 |
322.4 |
6,120.4 |
4,721.2 |
39.5 |
885.8 |
|
PIMA |
23.8 |
258.6 |
221.5 |
8.4 |
361.0 |
186.6 |
0.0 |
1.1 |
Terry Reilly
Senior Commodity Analyst – Grain and Oilseeds
Futures International
One Lincoln Center
18 W 140 Butterfield Rd.
Oakbrook Terrace, Il. 60181
W: 312.604.1366
ICE IM: treilly1
Skype: fi.treilly

Trading of futures, options, swaps and other derivatives is risky and is not suitable for all persons. All of these investment products are leveraged, and you can lose more than your initial deposit. Each investment product is offered only to and from jurisdictions where solicitation and sale are lawful, and in accordance with applicable laws and regulations in such jurisdiction. The information provided here should not be relied upon as a substitute for independent research before making your investment decisions. Futures International, LLC is merely providing this information for your general information and the information does not take into account any particular individual’s investment objectives, financial situation, or needs. All investors should obtain advice based on their unique situation before making any investment decision. The contents of this communication and any attachments are for informational purposes only and under no circumstances should they be construed as an offer to buy or sell, or a solicitation to buy or sell any future, option, swap or other derivative. The sources for the information and any opinions in this communication are believed to be reliable, but Futures International, LLC does not warrant or guarantee the accuracy of such information or opinions. Futures International, LLC and its principals and employees may take positions different from any positions described in this communication. Past results are not necessarily indicative of future results.