PDF attached
USDA export sales
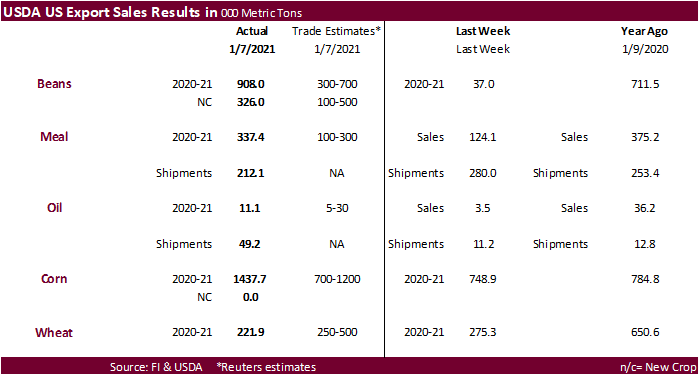
· USDA export sales for soybeans of 908,000 tons for 2020-21 were above expectations and new-crop sales were withing expectations at 326,000 tons. For current crop year, it included China (758,300 MT, including 264,000 MT switched from unknown destinations and decreases of 79,800 MT), followed by the EU and Mexico. For 2021-22, net sales included 326,000 MT for unknown destinations (260,000 MT) and China (66,000 MT). Exports of 2,040,000 tons.
· Soybean meal sales were good at 337,400 tons, a marketing year high, and shipments ok at 212,100 tons. El Salvador, Vietnam and the Philippines were good buyers.
· Soybean oil sales were low at 11,100 tons but shipments were good at 49,200 tons.
· USDA corn export sales of 1.438 million tons were above expectations. Japan and Columbia were big buyers. China was in there for 88,000 tons but most of that was switched from unknown.
· USDA export sales for sorghum were very good at 190,900 tons and included unknown for 120,000 tons.
· USDA pork sales were 23,800 tons.
· All-wheat USDA export sales of 221,900 tons were at the low end of expectations.
This summary is based on reports from exporters for the period January 1-7, 2021.
Wheat: Net sales of 221,900 metric tons (MT) for 2020/2021 were down 19 percent from the previous week and 49 percent from the prior 4-week average. Increases primarily for Bangladesh (55,000 MT), Mexico (46,200 MT, including decreases of 5,800 MT), Malaysia (34,000 MT, switched from unknown destinations), unknown destinations (25,000 MT), and Nigeria (23,800 MT, including decreases of 3,100 MT), were offset by reductions for Guatemala (6,100 MT), El Salvador (3,900 MT), and China (1,600 MT). For 2021/2022, net sales of 10,100 MT were primarily for Guatemala (6,100 MT). Exports of 358,500 MT were down 14 percent from the previous week and 2 percent from the prior 4-week average. The destinations were primarily to South Korea (68,400 MT), Japan (65,700 MT), China (58,400 MT), the Philippines (56,900 MT), and Mexico (46,800 MT).
Optional Origin Sales: For 2020/2021, the current outstanding balance of 10,000 MT, all Spain.
Corn: Net sales of 1,437,700 MT for 2020/2021 were up 92 percent from the previous week and 34 percent from the prior 4-week average. Increases primarily for Japan (401,500 MT, including 66,400 MT switched from unknown destinations), unknown destinations (334,500 MT), Colombia (125,900 MT, including 40,000 MT switched from unknown destinations and decreases of 84,100 MT), Mexico (124,100 MT, including decreases of 200 MT), and China (88,500 MT, including 70,000 MT switched from unknown destinations and decreases of 1,100 MT), were offset by reductions for El Salvador (24,000 MT). Exports of 1,464,300 MT were up 43 percent from the previous week and 41 percent from the prior 4-week average. The destinations were primarily to China (555,500 MT), Mexico (300,300 MT), Japan (168,400 MT), Colombia (89,700 MT), and Peru (75,400 MT).
Optional Origin Sales: For 2020/2021, the current outstanding balance of 1,351,400 MT is for South Korea (838,000 MT), unknown destinations (224,000 MT), Taiwan (140,000 MT), China (65,000 MT), Japan (52,000 MT), and Ukraine (32,400 MT).
Barley: No net sales or exports were reported for the week.
Sorghum: Net sales of 190,900 MT for 2020/2021 were up noticeably from the previous week and up 76 percent from the prior 4-week average. Increases were reported for unknown destinations (120,000 MT) and China (70,900 MT, including 68,000 MT switched from unknown destinations and decreases of 55,000 MT). Exports of 74,300 MT were down 13 percent from the previous week and 58 percent from the prior 4-week average. The destination was primarily to China.
Rice: Net sales of 12,900 MT for 2020/2021 were down 66 percent from the previous week and 86 percent from the prior 4-week average. Increases were primarily for Canada (3,600 MT), Jordan (2,800 MT), Saudi Arabia (2,700 MT), Mexico (1,400 MT), and Guatemala (1,200 MT). Exports of 19,200 MT were down 81 percent from the previous week and 82 percent from the prior 4-week average. The destinations were primarily to Japan (13,500 MT), Canada (2,400 MT), Mexico (1,400 MT), Saudi Arabia (700 MT), and Haiti (400 MT).
Exports for Own Account: For 2020/2021, new exports for own account totaling 100 MT were for Canada. The current exports for own account outstanding balance is 100 MT, all Canada.
Soybeans: Net sales of 908,000 MT for 2020/2021 were up noticeably from the previous week and up 93 percent from the prior 4-week average. Increases primarily for China (758,300 MT, including 264,000 MT switched from unknown destinations and decreases of 79,800 MT), Spain (143,000 MT, including 130,000 MT switched from unknown destinations), Mexico (98,100 MT, including decreases 200 MT), the Netherlands (85,500 MT, including 78,000 MT switched from unknown destinations), and Pakistan (70,100 MT, including 66,000 MT switched from unknown destinations), were offset by reductions primarily for unknown destinations (586,300 MT). For 2021/2022, net sales of 326,000 MT were for unknown destinations (260,000 MT) and China (66,000 MT). Exports of 2,040,000 MT were up 10 percent from the previous week, but down 12 percent from the prior 4-week average. The destinations were primarily to China (1,166,000 MT), Spain (143,000 MT), Mexico (109,600 MT), Vietnam (89,700 MT), and the Netherlands (85,500 MT).
Exports for Own Account: For 2020/2021, the current exports for own account outstanding balance is 6,100 MT, all Canada.
Soybean Cake and Meal: Net sales of 337,400 MT for 2020/2021–marketing-year high–were up noticeably from the previous week and up 97 percent from the prior 4-week average. Increases primarily for El Salvador (82,000 MT), Vietnam (49,900 MT, including decreases of 1,100 MT), the Philippines (45,100 MT, including decreases of 1,000 MT), Chile (35,000 MT), and Ecuador (31,700 MT, including decreases of 100 MT), were offset by reductions for unknown destinations (7,000 MT), Nepal (1,000 MT), and Colombia (300 MT). For 2021/2022, total net sales of 60,000 MT were for unknown destinations. Exports of 212,100 MT were down 24 percent from the previous week and from the prior 4-week average. The destinations were primarily to Colombia (52,600 MT), Vietnam (50,100 MT), Mexico (42,800 MT), Canada (20,800 MT), and the United Kingdom (19,500 MT).
Soybean Oil: Net sales of 11,100 MT for 2020/2021 were up noticeably from the previous week, but down 52 percent from the prior 4-week average. Increases primarily for unknown destinations (8,500 MT), Mexico (2,500 MT), Guatemala (700 MT, switched from Jamaica), and Canada (100 MT), were offset by reductions for Jamaica (700 MT). Exports of 49,200 MT were up noticeably from the previous and from the prior 4-week average. The destinations were primarily to India (36,000 MT), Guatemala (7,500 MT), Jamaica (2,800 MT), Mexico (2,200 MT), and Canada (400 MT).
Cotton: Net sales of 326,000 RB for 2020/2021 were up noticeably from the previous week and up 2 percent from the prior 4-week average. Increases primarily for China (151,200 RB, including 2,900 RB switched from Hong Kong and decreases of 15,400 RB), Pakistan (56,600 RB), Turkey (39,000 RB), Bangladesh (24,300 RB, including decreases of 6,000 RB), and Vietnam (23,800 RB, including decreases of 10,000 RB), were offset by reductions for Hong Kong (2,900 RB) and Malaysia (1,500 RB). For 2021/2022, net sales of 50,300 RB were for Malaysia (22,000 RB), Guatemala (13,200 RB), Bangladesh (8,800 RB), and Peru (6,300 RB). Exports of 274,600 RB were up 2 percent from the previous week and from the prior 4-week average. Exports were primarily to China (156,800 RB), Vietnam (40,800 RB), Pakistan (26,400 RB), Mexico (11,300 RB), and Turkey (11,000 RB). Net sales of Pima totaling 35,900 RB–a marketing-year high–were up noticeably from the previous week and from the prior 4-week average. Increases primarily for India (20,700 RB), Vietnam (8,800 RB), China (7,000 RB, including 2,600 RB switched from Hong Kong), Pakistan (1,300 RB), and Thailand (1,300 RB), were offset by reductions for Hong Kong (2,600 RB) and Bangladesh (1,500 RB). For 2021/2022, total net sales of 400 RB were for India. Exports of 10,300 RB were down 17 percent from the previous week and 37 percent from the prior 4-week average. The destinations were primarily to China (5,200 RB), India (1,700 RB), Pakistan (1,500 RB), Peru (1,000 RB), and Egypt (700 RB).
Exports for Own Account: For 2020/2021, new exports for own account totaling 100 RB were to China. The current exports for own account outstanding balance of 4,500 RB is for China.
Hides and Skins: Net sales of 340,400 pieces for 2021, primarily for China (232,400 whole cattle hides, including decreases of 8,100 pieces), South Korea (55,600 whole cattle hides, including decreases of 700 pieces), Mexico (25,600 whole cattle hides, including decreases of 2,100 pieces), Taiwan (10,900 whole cattle hides, including decreases of 700 pieces), and Brazil (5,600 whole cattle hides), were offset by reductions primarily for Indonesia (500 pieces). Additionally, net sales reductions of 500 kip skins were for Belgium. Exports of 357,800 pieces for 2021 were primarily to China (249,900 pieces), South Korea (56,000 pieces), Mexico (17,700 pieces), Taiwan (9,300 pieces), and Thailand (8,400 pieces). Additionally, exports of 5,100 kip skins were reported to Belgium.
Net sales of 140,000 wet blues for 2021 were reported for Italy (47,400 unsplit and 38,000 grain splits, including decreases of 100 unsplit), Vietnam (33,400 unsplit and 100 grain splits, including decreases of 100 unsplit), Thailand (11,500 unsplit, including decreases of 500 unsplit), China (8,000 unsplit), and Taiwan (1,700 grain splits), were offset by reductions primarily for Germany (100 grain splits) and Brazil (100 unsplit). Exports of 130,100 wet blues for 2021 were primarily to Vietnam (43,200 unsplit), China (30,100 unsplit and 3,200 grain splits), Italy (10,400 unsplit and 7,900 grain splits), Thailand (13,500 unsplit), and Taiwan (8,000 unsplit). Net sales of splits, 450,800 pounds for 2021, were primarily for Vietnam (427,000 pounds, including decreases of 800 pounds). Total exports of 538,300 pounds were to Vietnam.
Pork: Net sales of 23,800 MT reported for 2021, increases primarily for Mexico (6,600 MT, including decreases of 700 MT), Japan (3,400 MT, including decreases of 200 MT), South Korea (3,300 MT, including decreases of 500 MT), the Philippines (2,400 MT), and Colombia (2,400 MT, including decreases of 100 MT), were offset by reductions primarily for Australia (100 MT). Exports of 30,000 MT were primarily to China (11,500 MT), Mexico (6,900 MT), Japan (3,300 MT), South Korea (2,300 MT), and Canada (1,500 MT).
January 14, 2021 1 FOREIGN AGRICULTURAL SERVICE/USDA
U.S. EXPORT SALES FOR WEEK ENDING 01/07/2021
|
|
CURRENT MARKETING YEAR |
NEXT MARKETING YEAR |
||||||
|
COMMODITY |
NET SALES |
OUTSTANDING SALES |
WEEKLY EXPORTS |
ACCUMULATED EXPORTS |
NET SALES |
OUTSTANDING SALES |
||
|
CURRENT YEAR |
YEAR |
CURRENT YEAR |
YEAR |
|||||
|
|
THOUSAND METRIC TONS |
|||||||
|
WHEAT |
|
|
|
|
|
|
|
|
|
HRW |
93.0 |
1,446.4 |
1,537.6 |
106.2 |
5,770.9 |
5,612.2 |
0.0 |
22.0 |
|
SRW |
9.6 |
499.2 |
461.1 |
5.5 |
1,087.8 |
1,663.4 |
0.0 |
145.0 |
|
HRS |
130.3 |
1,816.4 |
1,383.1 |
67.3 |
4,294.9 |
4,201.1 |
0.0 |
45.0 |
|
WHITE |
-11.0 |
2,456.5 |
1,055.8 |
179.5 |
3,098.5 |
2,859.8 |
10.1 |
36.1 |
|
DURUM |
0.0 |
100.8 |
187.1 |
0.0 |
488.9 |
623.8 |
0.0 |
0.0 |
|
TOTAL |
221.9 |
6,319.3 |
4,624.6 |
358.5 |
14,741.0 |
14,960.3 |
10.1 |
248.1 |
|
BARLEY |
0.0 |
13.7 |
30.2 |
0.0 |
16.9 |
29.5 |
0.0 |
12.5 |
|
CORN |
1,437.7 |
28,661.5 |
9,867.0 |
1,464.3 |
16,720.6 |
9,434.3 |
0.0 |
757.0 |
|
SORGHUM |
190.9 |
3,219.2 |
514.1 |
74.3 |
2,059.5 |
615.3 |
0.0 |
478.0 |
|
SOYBEANS |
908.0 |
14,561.1 |
7,240.6 |
2,040.0 |
41,114.9 |
23,172.9 |
326.0 |
1,217.6 |
|
SOY MEAL |
337.4 |
2,822.8 |
2,963.5 |
212.1 |
3,464.7 |
3,024.5 |
60.0 |
78.9 |
|
SOY OIL |
11.1 |
247.9 |
144.2 |
49.2 |
254.3 |
320.2 |
0.0 |
0.6 |
|
RICE |
|
|
|
|
|
|
|
|
|
L G RGH |
1.2 |
202.9 |
327.4 |
0.0 |
787.0 |
677.9 |
0.0 |
0.0 |
|
M S RGH |
0.0 |
15.6 |
14.9 |
0.6 |
13.3 |
15.9 |
0.0 |
0.0 |
|
L G BRN |
1.6 |
10.5 |
20.8 |
0.6 |
22.7 |
19.9 |
0.0 |
0.0 |
|
M&S BR |
0.3 |
45.3 |
43.4 |
0.2 |
50.7 |
15.8 |
0.0 |
0.0 |
|
L G MLD |
5.0 |
72.2 |
149.4 |
2.9 |
298.0 |
491.9 |
0.0 |
0.0 |
|
M S MLD |
4.8 |
171.5 |
163.8 |
14.8 |
211.0 |
261.3 |
0.0 |
0.0 |
|
TOTAL |
12.9 |
518.1 |
719.7 |
19.2 |
1,382.7 |
1,482.8 |
0.0 |
0.0 |
|
COTTON |
|
THOUSAND RUNNING BALES |
||||||
|
UPLAND |
326.0 |
6,066.2 |
7,420.8 |
274.6 |
5,798.0 |
4,438.6 |
50.3 |
846.3 |
|
PIMA |
35.9 |
243.1 |
207.8 |
10.3 |
352.7 |
180.1 |
0.4 |
1.1 |
Terry Reilly
Senior Commodity Analyst – Grain and Oilseeds
Futures International
One Lincoln Center
18 W 140 Butterfield Rd.
Oakbrook Terrace, Il. 60181
W: 312.604.1366
ICE IM: treilly1
Skype: fi.treilly

Trading of futures, options, swaps and other derivatives is risky and is not suitable for all persons. All of these investment products are leveraged, and you can lose more than your initial deposit. Each investment product is offered only to and from jurisdictions where solicitation and sale are lawful, and in accordance with applicable laws and regulations in such jurisdiction. The information provided here should not be relied upon as a substitute for independent research before making your investment decisions. Futures International, LLC is merely providing this information for your general information and the information does not take into account any particular individual’s investment objectives, financial situation, or needs. All investors should obtain advice based on their unique situation before making any investment decision. The contents of this communication and any attachments are for informational purposes only and under no circumstances should they be construed as an offer to buy or sell, or a solicitation to buy or sell any future, option, swap or other derivative. The sources for the information and any opinions in this communication are believed to be reliable, but Futures International, LLC does not warrant or guarantee the accuracy of such information or opinions. Futures International, LLC and its principals and employees may take positions different from any positions described in this communication. Past results are not necessarily indicative of future results.