PDF attached
US Change In Non-Farm Payrolls Dec: 223K (exp 202K, R prev 256K)
– Unemployment Rate Dec: 3.5% (exp 3.7%, R prev 3.6%)
– Average Hourly Earnings (M/M) Dec: 0.3% (exp 0.4%, R prev 0.4%)
– Average Hourly Earnings (Y/Y) Dec: 4.6% (exp 5.0%, R prev 4.8%)
US Change In Private Payrolls Dec: 220K (exp 183K, R prev 202K)
– Change In Manufacturing Payrolls Dec: 8K (exp 8K, R prev 8K)
Fed Swaps Show 36Bps Of Hikes Priced For February, Sees Cycle Peak 5.05%
Canadian Money Markets Raise Bets On 25Bps Hike By BoC This Month
Canada Net Change In Employment Dec: 104.0K (exp 5.0K, prev 10.1K)
– Unemployment Rate Dec: 5.0% (exp 5.2%, prev 5.1%)
– Participation Rate Dec: 65.0% (prev 64.8%)
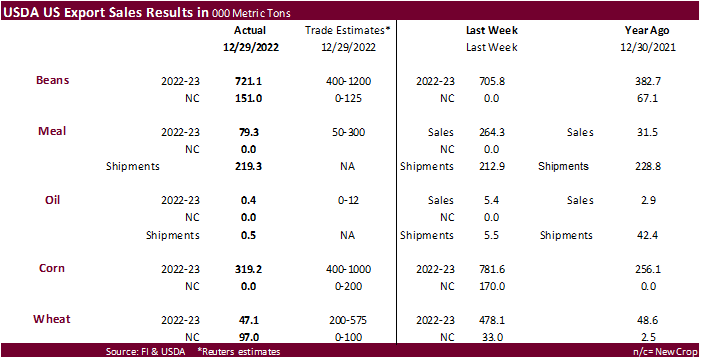
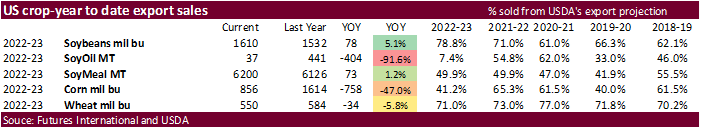
USDA export sales numbers were poor. Soybean complex came in near the low end of expectations and grains below a range of trade estimates. Soybean sales included China for 421,800 tons but included 71,400 switched from unknown. The Philippines bought less than expected soybean meal. Corn sales didn’t factor in the 170k 24-hour sale for Japan (it was counted in the previous week). Wheat sales were a marketing year low.
U.S. EXPORT SALES FOR WEEK ENDING 12/29/2022
|
|
CURRENT MARKETING YEAR |
NEXT MARKETING YEAR |
||||||
|
COMMODITY |
NET SALES |
OUTSTANDING SALES |
WEEKLY EXPORTS |
ACCUMULATED EXPORTS |
NET SALES |
OUTSTANDING SALES |
||
|
CURRENT YEAR |
YEAR |
CURRENT YEAR |
YEAR |
|||||
|
|
THOUSAND METRIC TONS |
|||||||
|
WHEAT |
|
|
|
|
|
|
|
|
|
HRW |
-13.6 |
941.8 |
2,095.3 |
46.2 |
3,174.3 |
4,225.9 |
30.0 |
69.3 |
|
SRW |
-3.5 |
632.1 |
689.8 |
13.0 |
1,748.2 |
1,622.2 |
28.0 |
41.6 |
|
HRS |
12.7 |
1,349.9 |
1,221.0 |
20.7 |
3,173.2 |
3,019.0 |
39.0 |
49.8 |
|
WHITE |
51.5 |
1,267.3 |
807.3 |
1.5 |
2,416.8 |
2,068.8 |
0.0 |
0.3 |
|
DURUM |
0.0 |
116.7 |
21.2 |
0.0 |
149.5 |
112.7 |
0.0 |
0.0 |
|
TOTAL |
47.1 |
4,307.8 |
4,834.5 |
81.5 |
10,662.1 |
11,048.6 |
97.0 |
161.0 |
|
BARLEY |
0.0 |
5.2 |
19.0 |
0.0 |
6.5 |
11.5 |
0.0 |
0.0 |
|
CORN |
319.2 |
11,743.6 |
26,344.1 |
761.8 |
9,996.9 |
14,652.8 |
0.0 |
1,139.0 |
|
SORGHUM |
0.0 |
141.1 |
3,695.0 |
1.1 |
219.8 |
1,613.1 |
0.0 |
0.0 |
|
SOYBEANS |
721.0 |
15,644.7 |
11,088.3 |
1,478.3 |
28,184.0 |
30,613.6 |
151.0 |
331.0 |
|
SOY MEAL |
79.3 |
3,502.3 |
2,984.0 |
219.3 |
2,697.5 |
3,142.4 |
0.0 |
18.3 |
|
SOY OIL |
0.4 |
18.2 |
248.1 |
0.5 |
18.9 |
192.6 |
0.0 |
0.6 |
|
RICE |
|
|
|
|
|
|
|
|
|
L G RGH |
-0.8 |
122.5 |
177.0 |
45.3 |
191.5 |
582.3 |
0.0 |
0.0 |
|
M S RGH |
0.0 |
13.7 |
10.8 |
0.0 |
13.2 |
2.9 |
0.0 |
0.0 |
|
L G BRN |
0.1 |
8.3 |
3.8 |
0.3 |
7.5 |
27.1 |
0.0 |
0.0 |
|
M&S BR |
0.0 |
7.7 |
68.3 |
0.4 |
7.0 |
15.4 |
0.0 |
0.0 |
|
L G MLD |
19.1 |
152.0 |
57.9 |
1.6 |
280.7 |
392.9 |
0.0 |
0.0 |
|
M S MLD |
5.3 |
135.9 |
100.8 |
2.8 |
99.5 |
179.2 |
0.0 |
0.0 |
|
TOTAL |
23.6 |
440.1 |
418.7 |
50.4 |
599.4 |
1,199.8 |
0.0 |
0.0 |
|
COTTON |
|
THOUSAND RUNNING BALES |
||||||
|
UPLAND |
39.6 |
4,918.9 |
7,556.5 |
93.6 |
3,867.5 |
3,036.8 |
0.0 |
1,203.1 |
|
PIMA |
-0.9 |
65.1 |
232.1 |
3.4 |
54.8 |
144.8 |
0.0 |
1.1 |
This summary is based on reports from exporters for the period December 23-29, 2022.
Wheat: Net sales of 47,100 metric tons (MT) for 2022/2023 primarily for China (65,000 MT switched from unknown destinations), Thailand (53,000 MT), and Vietnam (43,000 MT switched from the Philippines), were offset by reductions primarily for the Philippines (43,000 MT), unknown destinations (39,000 MT), Nigeria (24,000 MT), and Trinidad and Tobago (10,000 MT). Net sales of 97,000 MT for 2023/2024 were reported for Mexico (33,000 MT), unknown destinations (30,000 MT), Nigeria (24,000 MT), and Trinidad and Tobago (10,000 MT). Exports of 81,500 MT were to Mexico (81,200 MT), Canada (200 MT), and the United Arab Emirates (100 MT).
Corn: Net sales of 319,200 MT for 2022/2023 primarily for Mexico (145,100 MT, including decreases of 500 MT), Honduras (83,200 MT), Japan (49,500 MT, including 69,500 MT switched from unknown destinations and decreases of 20,000 MT), Nicaragua (48,300 MT, including 8,300 MT switched from El Salvador), and Costa Rica (25,100 MT, including decreases of 400 MT), were offset by reductions for unknown destinations (53,400 MT), El Salvador (8,200 MT), and the Philippines (800 MT). Exports of 761,800 MT were primarily to China (348,400 MT), Mexico (226,800 MT), Japan (69,600 MT), Honduras (53,700 MT), and Panama (25,400 MT).
Barley: No net sales or exports were reported for the week.
Sorghum: No net sales were reported for the week. Exports of 1,100 MT were to Mexico.
Rice: Net sales of 23,600 MT for 2022/2023 primarily for Haiti (15,000 MT), South Korea (5,000 MT), Canada (3,200 MT), Saudi Arabia (800 MT), and Nicaragua (600 MT), were offset by reductions for Guatemala (900 MT) and El Salvador (600 MT). Exports of 50,400 MT were primarily to Nicaragua (25,600 MT), Guatemala (11,900 MT), El Salvador (6,500 MT), Canada (2,100 MT), and South Korea (1,600 MT).
Soybeans: Net sales of 721,000 MT for 2022/2023 primarily for China (421,800 MT, including 71,400 MT switched from unknown destinations and decreases of 67,000 MT), Turkey (97,900 MT, including 50,800 MT switched from Egypt and 43,600 MT switched from unknown destinations), Mexico (87,600 MT, including decreases of 900 MT), the United Kingdom (65,300 MT, including 60,000 MT switched from unknown destinations), and Taiwan (62,900 MT, including 50,000 MT switched from unknown destinations and decreases of 200 MT), were offset by reductions primarily for unknown destinations (129,000 MT). Net sales of 151,000 MT for 2023/2024 were reported for China (66,000 MT), unknown destinations (66,000 MT), and Japan (19,000 MT). Exports of 1,478,300 MT were primarily to China (899,500 MT), Mexico (155,000 MT), Turkey (97,900 MT), the United Kingdom (65,300 MT), and Taiwan (60,900 MT).
Optional Origin Sales: For 2022/2023, the current outstanding balance of 300 MT, all South Korea.
Export for Own Account: For 2022/2023, the current exports for own account outstanding balance is 1,500 MT, all Canada.
Soybean Cake and Meal: Net sales of 79,300 MT for 2022/2023 primarily for the Philippines (26,400 MT, including decreases of 500 MT), the Dominican Republic (18,000 MT), Canada (14,500 MT), Colombia (9,100 MT, including decreases of 18,200 MT), and Nicaragua (8,100 MT, including 3,100 MT switched from El Salvador and decreases of 4,600 MT), were offset by reductions primarily for Morocco (6,000 MT) and El Salvador (3,200 MT). Exports of 219,300 MT were primarily to Colombia (67,400 MT), the Philippines (50,000 MT), Canada (19,000 MT), Panama (18,600 MT), and Guatemala (18,400 MT).
Soybean Oil: Net sales of 400 MT for 2022/2023 were reported for Mexico (300 MT) and Canada (100 MT). Exports of 500 MT were to Canada (300 MT) and Mexico (200 MT).
Cotton: Net sales of 39,600 RB for 2022/2023 primarily for Vietnam (15,500 RB, including 13,000 RB switched from China), Turkey (10,900 RB, including decreases of 2,800 RB), Japan (6,200 RB), Indonesia (5,500 RB, including 900 RB switched from China and 600 RB switched from Vietnam), and Pakistan (4,300 RB), were offset by reductions for China (7,700 RB) and Peru (2,600 RB). Exports of 93,600 RB were primarily to China (33,600 RB), Pakistan (24,400 RB), Turkey (11,600 RB), Taiwan (4,400 RB), and Malaysia (3,400 RB). Net sales reductions of Pima totaling 900 RB resulting in increases for Honduras (500 RB) and Colombia (100 RB), were more than offset by reductions for India (1,500 RB). Exports of 3,400 RB were primarily to India (1,300 RB), China (1,200 RB), and Indonesia (500 RB).
Optional Origin Sales: For 2022/2023, the current outstanding balance of 9,300 RB, all Malaysia.
Export for Own Account: For 2022/2023, new exports for own account totaling 1,000 RB were to China. Exports for own account totaling 1,100 RB primarily to Pakistan (1,000 RB) were applied to new or outstanding sales. The current exports for own account outstanding balance of 119,300 RB are for China (88,200 RB), Vietnam (22,700 RB), Pakistan (6,500 RB), India (1,500 RB), and Indonesia (400 RB).
Hides and Skins: Net sales of 104,100 pieces for 2022 primarily for China (66,100 whole cattle hides, including decreases of 43,400 pieces), Brazil (25,200 whole cattle hides, including decreases of 100 pieces), South Korea (15,500 whole cattle hides, including decreases of 4,200 pieces), and Mexico (5,700 whole cattle hides, including decreases of 2,900 pieces), were offset by reductions for Thailand (9,100 pieces). Net sales of 320,900 pieces for 2023 primarily for China (206,200 whole cattle hides), Brazil (38,300 whole cattle hides), South Korea (25,800 whole cattle hides), Mexico (20,400 whole cattle hides), and Italy (15,000 whole cattle hides), were offset by reductions for Japan (1,100 pieces). Exports of 317,700 whole cattle hides exports were primarily to China (229,000 pieces), South Korea (38,800 pieces), Brazil (13,600 pieces), Mexico (13,000 pieces), and Indonesia (11,200 pieces).
Net sales of 109,800 wet blues for 2022 reported for China (58,000 unsplit), Vietnam (29,700 unsplit), Italy (23,200 unsplit, including decreases of 1,600 unsplit), and Thailand (2,000 unsplit), were offset by reductions for the Dominican Republic (2,400 unsplit) and India (700 unsplit). Net sales of 20,400 wet blues for 2023 primarily for Taiwan (8,500 unsplit), China (5,300 unsplit), the Dominican Republic (4,800 unsplit), and Italy (3,200 unsplit), were offset by reductions for Thailand (2,000 unsplit). Exports of 108,900 wet blues were primarily to Italy (64,700 unsplit), China (17,600 unsplit), Vietnam (11,900 unsplit), Thailand (11,200 unsplit), and Brazil (2,200 grain splits). Total net sales of 25,300 splits, including decreases of 51,900 splits were for Vietnam. Net sales of 583,000 splits for 2023 for Taiwan (615,000 pounds) and Hong Kong (3,400 pounds), were offset by reductions for Vietnam (35,400 pounds). Exports of 354,100 splits were to Vietnam.
Beef: Net sales reductions of 6,900 MT for 2022 were primarily for Japan (2,200 MT), South Korea (1,900 MT), China (1,000 MT), Taiwan (900 MT), and Hong Kong (500 MT). Net sales of 12,500 MT for 2023 were primarily for Japan (4,400 MT), South Korea (2,100 MT), Taiwan (2,100 MT), China (1,500 MT), and Hong Kong (900 MT). Exports of 11,700 MT were primarily to Japan (4,500 MT), South Korea (3,100 MT), China (1,100 MT), Mexico (900 MT), and Canada (800 MT).
Pork: Net sales reduction of 51,900 MT for 2022 were primarily for Mexico (21,800 MT), Japan (9,200 MT), South Korea (5,800 MT), Canada (4,400 MT), and Australia (4,200 MT). Net sales of 73,600 MT for 2023 were primarily for Mexico (31,000 MT), Japan (15,700 MT), South Korea (7,000 MT), Canada (5,400 MT), and Australia (5,300 MT). Exports of 19,400 MT were primarily to Mexico (8,700 MT), China (3,000 MT), Japan (2,600 MT), South Korea (1,300 MT), and Colombia (1,000 MT).
Terry Reilly
Senior Commodity Analyst – Grain and Oilseeds
Futures International
One Lincoln Center
18 W 140 Butterfield Rd.
Oakbrook Terrace, Il. 60181
W: 312.604.1366
ICE IM: treilly1
Skype: fi.treilly

Trading of futures, options, swaps and other derivatives is risky and is not suitable for all persons. All of these investment products are leveraged, and you can lose more than your initial deposit. Each investment product is offered only to and from jurisdictions where solicitation and sale are lawful, and in accordance with applicable laws and regulations in such jurisdiction. The information provided here should not be relied upon as a substitute for independent research before making your investment decisions. Futures International, LLC is merely providing this information for your general information and the information does not take into account any particular individual’s investment objectives, financial situation, or needs. All investors should obtain advice based on their unique situation before making any investment decision. The contents of this communication and any attachments are for informational purposes only and under no circumstances should they be construed as an offer to buy or sell, or a solicitation to buy or sell any future, option, swap or other derivative. The sources for the information and any opinions in this communication are believed to be reliable, but Futures International, LLC does not warrant or guarantee the accuracy of such information or opinions. Futures International, LLC and its principals and employees may take positions different from any positions described in this communication. Past results are not necessarily indicative of future results.