PDF attached


Higher
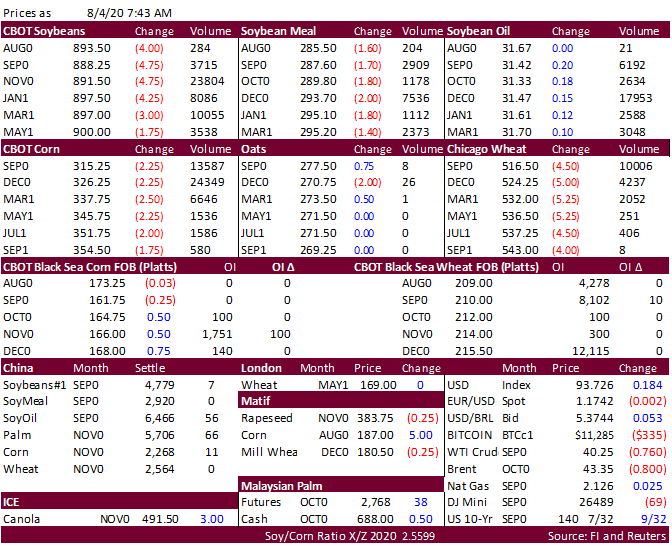
trade in Asian vegetable oil overnight.  US soybeans, corn and wheat area on the defensive on large crop production prospects.  US SBO is higher and meal lower.  USD was up 7 points earlier this morning and WTI down 71 cents.  US soybean conditions were up
one point while corn was unchanged.  Spring wheat improved 3 points. The US high pressure ridge for the US is now projected to be  short lived.   IA, NE, and OH are in need of additional rain.  StoneX sees big soybean and corn crops (yields 54.2 and 182.4). 
Yesterday’s NASS crush report was seen supportive for soybean oil.  Soybean and Corn Advisory sees Argentina’s 2021-22 soybean crop at 52MMT, 2 million above this year.  USDA is at 50MMT for 2020-21 and 50 for 2019-20.  UGA lowered their view of the Ukraine
rapeseed crop to 2.93MMT from 3.33 million previously.  Thailand seeks 192,600 tons of wheat and 107,700 tons of feed barley. Japan is in for 130,295 tons of food wheat.  Managed money shortened their net short position in Chicago wheat yesterday by 10,000
contracts to nearly flat. 


Weather
and Crop Progress


7
Day Precipitation Outlook


Bloomberg
Ag Calendar

TUESDAY,
August 4:

  • U.S.
    Purdue Agriculture Sentiment
  • New
    Zealand global dairy trade auction
  • Australia
    commodity index

WEDNESDAY,
August 5:

  • EIA
    U.S. weekly ethanol inventories, production, 10:30am
  • China’s
    CNGOIC to release supply-demand reports on corn, soybeans
  • French
    Agriculture ministry’s 2020 grain estimates
  • Malaysia’s
    palm oil export data for August 1-5
  • New
    Zealand Commodity Price

THURSDAY,
August 6:

  • FAO
    World Food Price Index
  • USDA
    weekly crop net-export sales for corn, soybeans, wheat, cotton, pork, beef, 8:30am
  • Port
    of Rouen data on French grain exports

FRIDAY,
August 7:

  • China’s
    foreign trade data for July, including imports of soybeans and meat
  • ICE
    Futures Europe weekly commitments of traders report, 1:30pm (6:30pm London)
  • CFTC
    commitments of traders weekly report on positions for various U.S. futures and options, 3:30pm
  • FranceAgriMer
    weekly update on crop conditions

Source:
Bloomberg and FI


USDA
inspections versus Reuters trade range                                                    

Wheat                 
500,110                 versus   450000-675000  range

Corn                     
716,127                 versus   700000-1150000                range

Soybeans           
551,543                 versus   375000-700000  range


Macros


Corn.

  • US
    soybeans, corn and wheat area on the defensive on large crop production prospects. 
  • USD
    was up 9 points earlier this morning and WTI down 70 cents. 
  • UGA:
    Ukraine 2020-21 corn estimate was raised to 38.9 million tons, a record, versus 36.8MMT earlier.  Exports may reach 33MMT tons vs 31m tons expected earlier.
  • Heat
    and dryness remain a concern for parts of Ukraine and Romania. 
  • IA,
    NE, and OH are in need of additional rain. 
  • US
    corn conditions were unchanged at 72% G/E, at trade expectations, and compare to 57% a year ago.  Corn dough 39% vs 22% last week, and 20% a year ago.  Corn silking 92% vs 82% last week, and 72% a year ago. 
  • StoneX:
    US corn yield and production: 182.4/15.320 billion; soybeans: 54.2/4.496 billion
  • USDA
    US corn export inspections as of July 30, 2020 were 716,127 tons, within a range of trade expectations, below 840,796 tons previous week and compares to 645,822 tons year ago. Major countries included Japan for 324,900 tons, Mexico for 228,658 tons, and Colombia
    for 86,284 tons.
  • Bloomberg:
    “Corn starch plants in China, the second-biggest consumer of the grain, are running at about 60% of capacity, according to SHZQ Futures, adding some have halted or scaled back output on costs. The government is expected to release feed-grade wheat, said the
    China National Grain and Oils Information Center.”
  • US
    corn usage for ethanol production rebounded to 379 million bushels for June versus 300 million in May and 245 million in April.  Year ago, corn use was 456 million.  Sorghum use fell to a multi-month low of 2.3 million. 


Corn
Export Developments


Soybean
complex
.


China
canola oil


·        
CBOT registrations for soybean oil were down 2 (Bunge). 

  • We
    heard China bought at least 8 cargoes of US and Brazilian soybeans on Monday.  4 traded out of the Gulf for Oct/Nov shipment and 4-6 out of Brazil for Mar/Apr. 
  • Soybean
    and Corn Advisory sees Argentina’s 2021-22 soybean crop at 52MMT, 2 million above this year.  USDA is at 53.5 MMT for 2020-21 and 50 for 2019-20. 
  • StoneX:
    US corn yield and production: 182.4/15.320 billion; soybeans: 54.2/4.496 billion
  • US
    soybean conditions were reported at 73% G/E vs 72% last week, and 54% a year ago.  Trade was looking for unchanged.  Soybeans blooming 85% G/E vs 76% last week, and 68% a year ago. 
  • UGA
    lowered their view of the Ukraine rapeseed crop to 2.93MMT from 3.33 million previously. 

·        
Rotterdam values this morning showed soybean oil for the Sep/Oct position was up 7 euros from this time previous session, rapeseed oil up about 3 in the nearby, and soybean meal when imported from South America unchanged to up
$3/ton.  

·        
China cash crush margins as of this morning, using our calculation, were 136 cents per bushel (150 previous) and compares to 150 cents a week ago and 79 cents around this time last year.


·        
Palm oil:  Market is projecting 8 percent drop in July palm production. 

·        
The European Union imported 1.37 million tons of soybean imports during the July 1 and August 2 period, 6 percent below the same period year ago. EU rapeseed imports reached 90,415 tons, down 68%.

  • USDA
    US soybean export inspections as of July 30, 2020 were 551,543 tons, within a range of trade expectations, above 504,645 tons previous week and compares to 1,032,874 tons year ago. Major countries included Egypt for 87,811 tons, Indonesia for 83,715 tons,
    and China Main for 71,977 tons.
  • The
    US June crush was reported at 177.3 million bushels, 0.6 bushel below a Bloomberg trade guess below 179.5 million for May 2020, and well above 157.6 million for June 2019.  But on a daily adjusted basis, the crush was 5.91 million bushels per day, up from
    5.79 million during the month of May.  The largest surprise was soybean oil stocks.  At the end of June, they fell to 2.271 billion pounds from 2.447 billion in May, 72 million pounds below the average trade guess, and smallest since December.  Note the soybean
    oil yield was 11.48, up from 11.46 for May.  Soybean meal stocks of 462,000 short tons are down from 498,000 previous month. 


Oilseeds
Export Developments


BRL

Source:
Reuters and FI


Wheat

  • US
    wheat futures

    are lower on harvest pressure, large production prospects for Russia and Australia (now forecast 1-3 MMT above USDA’s 26 MMT estimate), and fund selling. 
  • Managed
    money are near flat for CBOT Chicago wheat. 
  • Russia’s
    AgMin: wheat yields rose to 3.66 tons/hectare as of Aug. 3, up 0.05 tons/hectare from a year earlier.  Yesterday IKAR increased their estimate for the 2020-21 Russian wheat crop to 79.5MMT from 78 million previously. 
  • Romania’s
    wheat crop could fall 40 percent to 5.5-5.6 million tons, according to the AgMin. 
  • US
    spring wheat harvesting progress is slowly picking up.  It advanced 4 points to 5 percent and compares to 2 percent a year ago.  The trade was looking for 8 percent. 
  • Spring
    wheat conditions increased 3 points to 73% and compare to 70% last week, and 73% a year ago.  This was a surprise.  The trade was looking for unchanged. 
  • Winter
    wheat harvest was reported at 85%, below 89% trade estimate, and compares to 81% last week and 80% a year ago. 
  • Paris
    December wheat was down 0.25 euros at 180.50.  
  • EU
    soft wheat exports as of July 1 reached 635,453 tons by Aug. 2, 68% below the same period a year ago.
  • USDA
    US all-wheat export inspections as of July 30, 2020 were 500,110 tons, within a range of trade expectations, below 544,010 tons previous week and compares to 416,177 tons year ago. Major countries included Philippines for 102,832 tons, Japan for 91,201 tons,
    and Indonesia for 57,749 tons.


Export
Developments.

  • Thailand
    seeks 192,600 tons of wheat and 107,700 tons of Australian (only) feed barley on Wed.
  • Japan
    is in for 130,295 tons of food wheat on August 6. 
  • Japan
    seeks 80,000 tons of feed wheat and 100,000 tons of barley on Aug 5 for arrival by end of Jan. 
  • Syria
    looks to sell and export 100,000 tons of feed barley with offers by Sep 1. 


Rice/Other

  • Cotton 45% G/E vs 49% last week, and 54% a year ago
  • Sorghum 55% G/E vs 53% last week, and 68% a year ago

·        
Mauritius seeks 6,000 tons of white rice on August 17 for October through December delivery. 


Terry Reilly

Senior Commodity Analyst – Grain and Oilseeds

Futures International │190 S LaSalle St., Suite 410│Chicago, IL  60603

W: 312.604.1366

treilly@futures-int.com

AIM: fi_treilly

ICE IM: 
treilly1

Skype: fi.treilly


Description: Description: Description: Description: FImail


Trading of futures, options, swaps and other derivatives is risky and is not suitable for all persons.  All of these investment products are leveraged, and you can lose more than your initial deposit.  Each investment product is offered
only to and from jurisdictions where solicitation and sale are lawful, and in accordance with applicable laws and regulations in such jurisdiction.  The information provided here should not be relied upon as a substitute for independent research before making
your investment decisions.  Futures International, LLC is merely providing this information for your general information and the information does not take into account any particular individual’s investment objectives, financial situation, or needs.  All investors
should obtain advice based on their unique situation before making any investment decision.  The contents of this communication and any attachments are for informational purposes only and under no circumstances should they be construed as an offer to buy or
sell, or a solicitation to buy or sell any future, option, swap or other derivative.  The sources for the information and any opinions in this communication are believed to be reliable, but Futures International, LLC does not warrant or guarantee the accuracy
of such information or opinions.  Futures International, LLC and its principals and employees may take positions different from any positions described in this communication.  Past results are not necessarily indicative of future results.