PDF attached


US
one day past precipitation


USDA
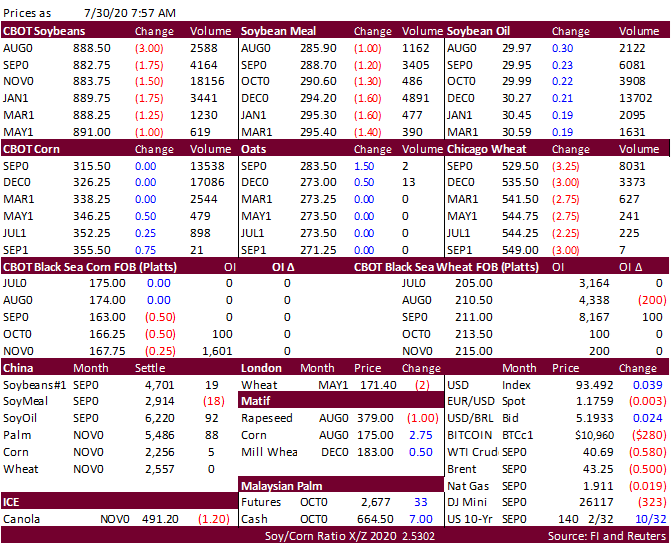
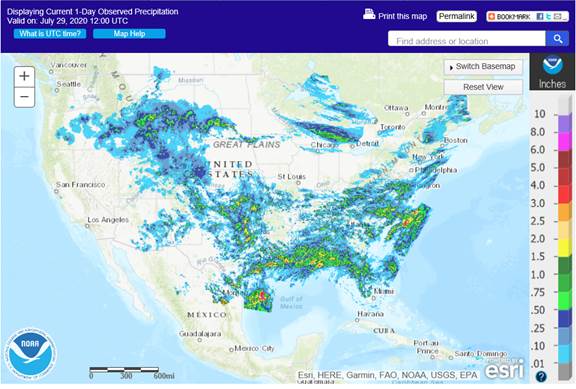
new-crop soybean and sorghum export sales were excellent, corn poor, and wheat very good.  Soybeans were lower on follow through selling from very good US weather.  Today is position day for August CBOT contracts.  We see FND deliveries at zero to 50 soybeans,
zero to 150 soybean meal and 1500-2500 soybean oil.  Malaysian palm futures were up 32 MYR and cash increased $9.00/ton.  Indonesia aims to reach its B40 biodiesel target by July 2021. China soybean crush margins eased on our calculation
but still promote buying.  Corn futures were slightly higher after four days of losses on technical rebound after futures contracts traded near their respected contract lows on Wednesday.  Wheat futures are reversing course by trading lower, stuck this week
in a two-sided trading pattern.  Japan seeks 80,000 tons of feed wheat and 100,000 tons of barley on Aug 5 for arrival by end of Jan. 


Weather
and Crop Progress


UNITED
STATES

  • No
    change was noted in the first week of the outlook
    • Northern
      parts of the Midwest and the northern Plains along with Canada’s Prairies experience restricted rainfall and some net drying
    • Lower
      Midwest northern Delta and parts of the southeastern states get routinely occurring rainfall
    • Tropical
      Isaias will reach the lower east coast of Florida Saturday and follow the coast to the Carolinas bringing significant rain to some coastal areas
      • The
        storm may reduce rain in interior parts of the southeastern states for a brief period this weekend into early next week
  • Rain
    was reduced in the upper Midwest Aug. 6-8
    • Some
      of the reduction was needed
  • Some
    reduction in rain was noted for the northern Plains and eastern Canada Prairies
    • Some
      reduction was needed, but a little too much rain may have been removed
  • Rain
    was reduced in the northern Plains and upper Midwest again Aug 11-13
    • Too
      much rain was removed
  • Rain
    was increased in much of the southern Plains and a part of the Delta Aug 11-13
    • Some
      of this increase was overdone

The
bottom line is still a good one for U.S. crop development. There may be some pockets of dryness, but most of the nation’s crops will continue to perform relatively well. The pockets of dryness will be a problem for the local farmers, but the big picture for
the country remains mostly quite good for a very good production year.


EUROPE/BLACK
SEA

  • No
    changes were noted in the first week of the outlook
  • Rain
    was increased in western Europe Aug. 6-8 and reduced in eastern Europe
    • The
      increase was mostly light, but not out of the realm of possibilities
  • A
    more significant increase in rain was suggested for France and immediate neighboring areas Aug 9-11 as well as in areas of eastern Europe from parts of Poland, Czech Republic and Austria to Ukraine and southwestern Belarus
    • Some
      of the increase was overdone, but rain is expected in western Europe
  • Additional
    rain was advertised for western through southeastern Europe August 12-13
    • The
      increase in rainfall was overdone


The
increase in rainfall for western Europe was way overdone today.  The model brings two upper level low pressure systems into western Europe during the second week of the outlook, but the European model has a stronger ridge present over central and western Europe
to minimize the potential for such rain events. The remainder of Europe’s weather remains mostly unchanged with pockets of dryness in southeastern areas. Some showers may impact far northwestern Europe briefly after August 8, but amounts will not be nearly
those advertised by the GFS model.  The Canadian model is similar to the European solution keeping rainfall to a minimum.


RUSSIA
NEW LANDS

  • Better
    model agreement is present this morning for the New Lands
    • Scattered
      showers and thunderstorms will continue in the Ural Mountains and other western New Lands locations over the next couple of weeks, but conditions in the eastern New Lands will be drier biased
    • Some
      crop moisture stress will continue in a part of the spring wheat and sunseed production region
    • Recent
      rain has brought a little relief to dryness especially in the Ural Mountains region, but rain is still needed in the New Lands east of that region


CHINA

  • Waves
    of significant rain are still advertised for northern China next week and into the following weekend
    • Both
      the European and GFS models agree with this feature, although they are not agreeing on the region of wettest conditions
    • Waves
      of rain will occur from Shanxi and a part of Henan through Hebei and Shandong to portions of the Korean Peninsula
      • The
        GFS has this area of heavy rain farther to the north impacting Liaoning and Jilin as well
      • The
        GFS produces copious amounts of rain resulting in flooding for parts of northern China
      • The
        European model has backed off of some of the greatest rain, but still suggests amounts of 4.00 to more than 8.00 inches with parts of the Korean Peninsula getting more than 12.00 inches resulting in serious flooding and a threat to the region’s rice crop and
        personal property
  • Net
    drying is still advertised for the Yangtze River Basin during the coming ten days, although totally dry weather is unlikely
  • Coastal
    flooding is also expected in the south of China because of a couple of tropical cyclones
    • One
      tropical cyclone will move through southwestern Guangdong to southern Guangxi and northeastern Vietnam during the weekend
    • Another
      tropical wave will move into Guangdong and Fujian early to mid-week next week resulting in more heavy rain and some flooding

The
bottom line is one of improvement for China’s Yangtze River Basin and a continuation of favorable weather in many other areas. Flooding in coastal areas of the south will be a concern for this weekend and early next week as noted above. Flooding may also evolve
in parts of the north during the week next week, although confidence on where the greatest rain will fall is low. If the GFS model is correct some important rice, corn and soybean areas might be impacted. If the European model run is more correct the Korean
Peninsula will feel the brunt of this precipitation event. Too much rain in northern China would not be welcome and a close watch on the situation is warranted. The European solution is preferred.


AUSTRALIA

  • An
    important rain event will develop in southeastern parts of Western Australia early next week that will shift to New South Wales and Queensland later in the week next week
    • This
      feature has been on the recent model runs and should verify
    • It
      brings some needed rain to South Australia as well as Queensland and additional rain for New South Wales
      • The
        event will be a boon toward improving winter crop establishment in some of the wetter areas
  • Another
    weather event Aug. 8-9 impacts Western Australia and reaches South Australia Aug 9-10 before moving farther to the east Aug. 10-11
  • Another
    weather system was advertised in Western Australia during the Aug 12-13 period

There
is plenty of warm water to the west of Australia to support these increasing rain events and confidence is high for an improving trend even though some of the rainfall may not be timed or placed just right. The bottom line is quite favorable for future winter
wheat, barley and canola development.


SOUTH
AMERICA

  • The
    earliest that some rain might reach into the dry wheat areas of Argentina will be during the middle part of next week, but amounts look to be very light and inadequate in fixing dryness in Cordoba
    • The
      moisture will be good for other winter crop areas to the east and south
  • Additional
    rain was advertised for Buenos Aires Aug. 11-13, but western areas are left with little to no rain
  • Overall,
    the first week of the outlook was a little wetter in Cordoba, Santa Fe and Entre Rios and some rain is expected, but it will not be a large amount


7
Day Precipitation Outlook


Bloomberg
Ag Calendar

THURSDAY,
July 30:

  • USDA
    weekly crop net-export sales for corn, soybeans, wheat, cotton, pork, beef, 8:30am
  • Port
    of Rouen data on French grain exports
  • The
    Australian Grains Industry Conference (online event)
  • Poland
    to publish grain harvest estimates

FRIDAY,
July 31:

  • ICE
    Futures Europe weekly commitments of traders report, 1:30pm (6:30pm London)
  • CFTC
    commitments of traders weekly report on positions for various U.S. futures and options, 3:30pm
  • FranceAgriMer
    weekly update on crop conditions
  • Malaysia’s
    palm oil export data for July 1-31 (tentative)
  • U.S.
    agricultural prices paid, received, 3pm
  • HOLIDAY:
    Singapore, Indonesia, Malaysia

Source:
Bloomberg and FI


USDA
new-crop soybean export sales

exceeded expectations while old-crop were below.  Soybean meal export sales were within trade estimates but shipments were slow.  Soybean oil sales were poor along with lackluster shipments.  Corn export sales showed net reductions for old crop and new-crop
were 639,000 tons, below expectations.  Wheat sales were once again very good. 
Sorghum sales
were poor for old crop but excellent for new-crop of 163,000 tons.  Pork sales were 39,600 tons. 


Macros

US
GDP Annualized (Q/Q) Q2 A: -32.9% (est -34.5%; prev -5.0%)

US
GDP Personal Consumption Q2 A: -34.6% (est -34.5%; prev -6.8%)

US
Core PCE (Q/Q) Q2 A: -1.1% (est -0.9%; prev 1.7

US
GDP Price Index Q2 A: -1.8% (est -0.1%; prev 1.4%)

US
Initial Jobless Claims Jul 25: 1434K (est 1445K; prevR 1422K; prev 1416K)

US
Continuing Claims Jul 18: 17018K (est 16200K; prevR 16151K; prev 16197K)


Corn.


Corn
Export Developments


Soybean
complex
.

·        
Soybeans
were
lower on follow through selling from very good US weather.  Soybean meal is under pressure while soybean oil higher following Malaysian palm and tight South American soybean oil stocks.  

·        
USDA soybean export sales were poor for old crop and excellent for new-crop.  USDA: For 2020/2021, net sales of 3,344,200 MT primarily for China (1,989,000 MT), unknown destinations (1,232,900 MT), Mexico (64,800 MT), Egypt (43,000
MT), and Taiwan (39,000 MT), were offset by reductions for Switzerland (60,000 MT).  Product sales were ok to lackluster. 

·        
Today is position day for August CBOT contracts.  We see FND deliveries at zero to 50 soybeans, zero to 150 soybean meal and 1500-2500 soybean oil. 

·        
Nearby oil spreads are firm this morning. 

·        
US Gulf soybean oil is around a 6-month high of $760/ton fob. 

·        
Yesterday funds sold an estimated net 4,000 soybeans, sold 1,000 meal and bought 3,000 soybean oil. 

·        
Yesterday ICE canola futures rallied to a 21-month high. 

·        
There were no changes in CBOT registrations. 

·        
Rotterdam values this morning showed soybean oil for the August/September position was up 5 euros from this time previous session, rapeseed oil down about 7 in the nearby, and soybean meal when imported from South America mixed.  

·        
China cash crush margins as of this morning, using our calculation, were 148 cents per bushel (153 previous) and compares to 147 cents a week ago and 41 cents around this time last year.

·        
Palm oil was higher.  On a monthly basis palm was up 16.5%, most since September 2015. 

·        
Indonesia aims to reach its B40 biodiesel target by July 2021. 


Oilseeds
Export Developments


Soybean
oil has a story centered around slowing South American soybean crush and increase in demand for biodiesel production.


Wheat

  • US
    wheat futures

    are lower despite rumors Brazil bought US and Canadian wheat this week.  Wheat appears to be stick in a two-sided trading pattern. 
  • USDA
    export sales for all-wheat beat expectations for the second consecutive week.  See text after the wheat section. 
  • Yesterday
    funds bought an estimated net 7,000 Chicago wheat contracts. 
  • BB
    – The ruble is trading at the lowest level against the dollar in more than two months. A weaker ruble promotes Russian wheat exports. 
  • There
    are concerns about dryness for the next couple weeks for France, Germany and parts of the southern Balkan Countries as well as crop areas from eastern Ukraine into Kazakhstan and Russia’s southern region. 
  • For
    the US Northern Plains, net drying will occur over the next week.  Topsoil moisture is short for the western areas of the Northern Plains. 
  • Paris
    December wheat was unchanged at 182.50.  
  • USDA
    Attaché estimated Argentina new-crop wheat production at 20 million tons, up from their forecast of 19.3 million tons for 2019-20. 
    https://apps.fas.usda.gov/newgainapi/api/Report/DownloadReportByFileName?fileName=Grain%20and%20Feed%20Update_Buenos%20Aires_Argentina_07-15-2020


Export
Developments.

  • Japan
    seeks 80,000 tons of feed wheat and 100,000 tons of barley on Aug 5 for arrival by end of Jan. 
  • Lowest
    offer wheat $225.95 and barley $205.40:   Tunisia seeks 50,000 tons of milling wheat, 25,000 tons of durum, and 100,000 tons of barley. 
  • Results
    awaited: The Philippines seeks 216,000 tons of wheat on July 30 for September through December shipment. 
  • The
    other day Egypt ended up buying 470,000 tons of wheat, according to Reuters.
  • Results
    awaited:  Syria seeks 200,000 tons of milling wheat from Russia by July 28. 
  • Syria
    looks to sell and export 100,000 tons of feed barley with offers by Sep 1. 


Rice/Other

·        
(Bloomberg) — China has bought more than $1 billion worth of American cotton in the past three months
.


Export Sales Highlights 

This
summary is based on reports from exporters for the period July 17-23, 2020.

Wheat:  Net
sales of 676,600 metric tons (MT) for 2020/2021 were up 10 percent from the previous week and 30 percent from the prior 4-week average.  Increases were primarily for the Philippines (132,400 MT, including 16,000 MT switched from unknown destinations and decreases
of 9,500 MT), Taiwan (102,800 MT, including decreases of 1,000 MT), Brazil (62,100 MT), Mexico (60,400 MT, including decreases of 65,100 MT), and Japan (60,200 MT).  Exports of 505,400 MT were down 4 percent from the previous week and 2 percent from the prior
4-week average.  The destinations were primarily to the Philippines (93,400 MT), Thailand (62,800 MT), Mexico (62,200 MT), Brazil (62,100 MT), and Chile (46,500 MT). 

Corn: 
Net sales reductions of 29,300 MT for 2019/2020–a marketing-year low–were down noticeably from the previous week and from the prior 4-week average.  Increases primarily for Colombia (41,800 MT, including decreases of 3,200 MT), unknown destinations (27,600
MT), Japan (13,100 MT, including decreases of 2,500 MT), Taiwan (13,000 MT), and Guatemala (11,400 MT, including 4,000 MT switched from Costa Rica, 4,000 MT switched from El Salvador, and 2,000 MT switched from Nicaragua), were offset by reductions primarily
for Canada (53,700 MT), Mexico (44,100 MT), Panama (22,100 MT), and El Salvador (14,300 MT).  For 2020/2021, net sales of 638,700 MT primarily for unknown destinations (245,900 MT), Mexico (112,000 MT), Japan (100,000 MT), Canada (75,700 MT), and Honduras
(32,000 MT), were offset by reductions for Colombia (4,000 MT).  Exports of 971,200 MT were down 8 percent from the previous week and 15 percent from the prior 4-week average.  The destinations were primarily to Mexico (360,800 MT), Japan (355,100 MT), China
(67,900 MT), Guatemala (66,500 MT), and Colombia (58,800 MT). 

Optional
Origin Sales:
  For
2019/2020, new exports for own account totaling 65,000 MT were to South Korea.  The current outstanding balance of 455,000 MT is for South Korea (325,000 MT), Vietnam (65,000 MT), and Taiwan (65,000 MT).  For 2020/2021, the current outstanding balance of 260,000
MT is for Vietnam (195,000 MT) and South Korea (65,000 MT).

Barley: 
No net sales for 2020/2021 were reported for the week.  Exports of 300 MT were to South Korea.

Sorghum: 
Net sales of 4,300 MT for 2019/2020 were down 95 percent from the previous week and from the prior 4-week average.  Increases reported for China (71,400 MT, including 68,000 MT switched from unknown destinations) and Japan (900 MT), were offset by reductions
for unknown destinations (68,000 MT).  For 2020/2021, net sales of 163,000 MT were for unknown destinations (98,000 MT) and China (65,000 MT).  Exports of 82,600 MT were down 33 percent from the previous week and 12 percent from the prior 4-week average. 
The destinations were to China (71,700 MT) and Japan (10,900 MT).

Rice: 
Net sales of 23,000 MT for 2019/2020 were up 78 percent from the previous week and 18 percent from the prior 4-week average.  Increases were primarily for Haiti (15,300 MT), Canada (1,900 MT), the Dominican Republic (1,900 MT), Saudi Arabia (1,800 MT),
and Mexico (600 MT). 
For
2020/2021, net sales of 6,000 MT were primarily for Costa Rica.  Exports of 12,000 MT were down 78 percent from the previous week and 67 percent from the prior 4-week average.  The destinations were primarily to Canada (3,400 MT), Saudi Arabia (2,900 MT),
Japan (1,700 MT), Israel (1,000 MT), and Mexico (800 MT).

Soybeans: 
Net sales of 257,800 MT for 2019/2020 were down 29 percent from the previous week and 45 percent from the prior 4-week average.  Increases primarily for Germany (152,400 MT), Egypt (151,200 MT, including 38,000 MT switched from unknown destinations and decreases
of 800 MT), the Netherlands (116,900 MT, including 55,000 MT switched from unknown destinations), Bangladesh (59,000 MT, switched from unknown destinations), and Indonesia (47,100 MT, including decreases of 10,400 MT), were offset by reductions primarily for
unknown destinations (323,600 MT) and China (64,300 MT).  For 2020/2021, net sales of 3,344,200 MT primarily for China (1,989,000 MT), unknown destinations (1,232,900 MT), Mexico (64,800 MT), Egypt (43,000 MT), and Taiwan (39,000 MT), were offset by reductions
for Switzerland (60,000 MT).  Exports of 674,500 MT were up 44 percent from the previous week and 42 percent from the prior 4-week average.  The destinations were primarily to Germany (152,400 MT), China (135,600 MT), Mexico (113,400 MT), the Netherlands (56,900
MT), and Algeria (41,800 MT). 

Exports
for Own Account:
 
For 2019/2020, the current exports for own account outstanding balance is 2,100 MT, all Canada.

Export
Adjustments:
 
Accumulated export of soybeans to the Netherland were adjusted down 18,000 MT for week ending February 6th, 26,072 MT for week ending February 27th, 64,651 MT for week ending March 5th, and 43,644 MT for week ending March 12th
The correct destination for these shipments is Germany and is included in this week’s report.

Soybean
Cake and Meal

Net sales of 260,900 MT for 2019/2020 were up noticeably from the previous week and from the prior 4-week average.  Increases primarily for the Philippines (137,300 MT), Mexico (33,800 MT), Australia (25,000 MT), Canada (24,400 MT, including decreases of 300
MT), and Colombia (20,000 MT, including decreases of 200 MT), were offset by reductions for El Salvador (5,200 MT), Panama (3,400 MT), Belgium (1,500 MT), and the Dominican Republic (800 MT). 
For
2020/2021, net sales of 32,900 MT primarily for Canada (14,300 MT), Guatemala (11,800 MT), El Salvador (4,200 MT), Panama (3,400 MT), and the Philippines (2,000 MT), were offset by reductions for Morocco (5,000 MT).  Exports of 185,300 MT were down 10 percent
from the previous week and 19 percent from the prior 4-week average.  The destinations were primarily to Colombia (41,700 MT), Morocco (30,600 MT), Canada (21,900 MT), Guatemala (21,800 MT), and Mexico (18,700 MT). 

Soybean
Oil: 
Net
sales of 800 MT for 2019/2020 were primarily for Canada (300 MT), Mexico (300 MT), and the Dominican Republic (200 MT).  For 2020/2021, total net sales of 10,000 MT were for South Korea.  Exports of 10,900 MT were down 71 percent from the previous week and
34 percent from the prior 4-week average.  The destinations were primarily to Colombia (3,000 MT), Guatemala (2,400 MT), Nicaragua (2,100 MT), El Salvador (1,900 MT), and Canada (800 MT). 

Cotton: 
Net sales of 118,700 RB for 2019/2020 were up noticeably from the previous week and from the prior 4-week average.  Increases primarily for Vietnam (76,500 RB, including 2,200 RB switched from China and 800 RB switched from South Korea), China (22,100 RB),
Bangladesh (17,600 RB), Turkey (4,000 RB), and Brazil (3,900 RB, switched from Ecuador), were offset by reductions for Ecuador (3,900 RB), Pakistan (2,500 RB), Mexico (2,100 RB), the Philippines (1,900 RB), and India (1,800 RB).  For 2020/2021, net sales of
9,500 RB primarily for Vietnam (3,000 RB), Pakistan (2,600 RB), Turkey (1,500 RB), Thailand (1,400 RB), and Bangladesh (1,100 RB), were offset by reductions for Japan (400 RB).  Exports of 320,800 RB were up 18 percent from the previous week and 8 percent
from the prior 4-week average.  Exports were primarily to China (105,100 RB), Vietnam (93,100 RB), Turkey (41,700 RB), Bangladesh (25,400 RB), and Pakistan (18,500 RB).  Net sales of Pima totaling 9,100 RB were down 20 percent from the previous week, but up
48 percent from the prior 4-week average.  Increases primarily for China (5,700 RB), Pakistan (1,700 RB), Italy (1,400 RB), Thailand (1,100 RB), and Turkey (1,000 RB), were offset by reductions for India (3,500 RB).  For 2020/2021, total net sales of 500 RB
were for Peru.  Exports of 7,800 RB were up noticeably from the previous week and from the prior 4-week average.  The destinations were primarily to China (3,100 RB), Pakistan (1,100 RB), Peru (900 RB), India (800 RB), and Bangladesh (700 RB).  

Exports
for Own Account:
 
For 2019/2020, new exports for own account totaling 26,800 RB were to Vietnam (17,300 RB), Pakistan (4,800 RB), China (3,300 RB), and Bangladesh (1,400 RB).  Exports for own account totaling 15,300 RB were primarily to Vietnam (10,900 RB) were applied to new
or outstanding sales. Decreases were reported for Indonesia (4,300 RB).  The current exports for own account outstanding balance of 31,300 RB is for China (14,300 RB), Vietnam (10,200 RB), Indonesia (3,900 RB),
Bangladesh
(2,500 RB), and Pakistan (400 RB).

Hides
and Skins:

Net sales of 447,600 pieces for 2020 were up 4 percent from the previous week, but down 12 percent from the prior 4-week average.  Increases primarily for China (343,100 whole cattle hides, including decreases of 12,000 pieces), Mexico (60,100 whole cattle
hides, including decreases of 900 pieces), South Korea (32,000 whole cattle hides, including decreases of 2,300 pieces), Turkey (8,100 whole cattle hides), and Vietnam (3,400 whole cattle hides), were offset by reductions primarily for Indonesia (200 whole
cattle hides) and Brazil (100 whole cattle hides).  Exports of 544,400 pieces reported for 2020 were up 41 percent from the previous week and 23 percent from the prior 4-week average.  Whole cattle hides exports were primarily to China (421,100 pieces), Mexico
(53,100 pieces), South Korea (47,700 pieces), Brazil (11,400 pieces), and Vietnam (4,500 pieces).

Net
sales of 133,100 wet blues for 2020 were down 16 percent from the previous week, but up noticeably from the prior 4-week average.  Increases primarily for Brazil (39,900 grain splits), China (39,800 unsplit, including decreases of 200 unsplit), Thailand (20,000
unsplit), Italy (15,100 unsplit, including decreases of 300 unsplit), and Vietnam (11,200 unsplit), were offset by reductions for Taiwan(2,400 unsplit).  Exports of 100,400 wet blues for 2020 were up 23 percent from the previous week and 40 percent from the
prior 4-week average.  The destinations were primarily to Italy (42,800 unsplit and 6,400 grain splits), China (13,600 unsplit), Thailand (12,400 unsplit), Vietnam (7,600 unsplit), and Mexico (6,000 grain splits).  Net sales of 237,800 splits were for China
(166,300 pounds, including decreases of 3,700 pounds) and Vietnam (71,500 pounds, including decreases of 5,200 pounds).  Exports of 394,900 pounds were to Vietnam.

Beef:
Net
sales of 29,500 MT reported for 2020–a marketing-year high–were up 89 percent from the previous week and 81 percent from the prior 4-week average.  Increases primarily for South Korea (11,500 MT, including decreases of 600 MT), Japan (10,600 MT, including
decreases of 400 MT), Taiwan (1,500 MT, including decreases of 200 MT), China (1,400 MT), and Hong Kong (1,300 MT, including decreases of 100 MT), were offset by reductions primarily for Chile (100 MT) and the Philippines (100 MT).  For 2021, net sales of
1,200 MT were primarily for Mexico (1,100 MT) and the Philippines (100 MT).  Exports of 18,300 MT were up 14 percent from the previous week and 19 percent from the prior 4-week average.  The destinations were primarily to Japan (6,600 MT), South Korea (5,700
MT), Taiwan (1,400 MT), Canada (1,200 MT), and Hong Kong (1,000 MT).


Pork:
Net sales of
39,600 MT reported for 2020 were up 24 percent from the previous week and 12 percent from the prior 4-week average.  Increases primarily for China (17,800 MT, including decreases of 1,200 MT), Mexico (15,400 MT, including decreases of 200 MT), Canada (2,300
MT, including decreases of 400 MT), Japan (900 MT, including decreases of 1,800 MT),  and the Philippines (800 MT, including 200 MT switched from Vietnam), were offset by reductions primarily for Australia (400 MT).  For 2021, total net sales of 400 MT were
for Australia.  Exports of 31,500 MT were down 12 percent from the previous week and 3 percent from the prior 4-week average.  The destinations were primarily to China (10,200 MT), Mexico (9,200 MT), Japan (4,400 MT), Canada (2,300 MT), and South Korea (1,000
MT).


U.S. EXPORT SALES FOR WEEK ENDING 7/23/2020                            


CURRENT MARKETING YEAR

NEXT MARKETING YEAR

COMMODITY

NET SALES

OUTSTANDING SALES

WEEKLY EXPORTS

ACCUMULATED EXPORTS

NET SALES

OUTSTANDING SALES

CURRENT YEAR

YEAR
AGO

CURRENT YEAR

YEAR
AGO


THOUSAND METRIC TONS

WHEAT


   HRW    

210.9

1,732.0

1,532.4

174.4

1,792.4

2,025.0

0.0

0.0

   SRW    

37.5

659.9

853.8

53.2

266.7

320.9

0.0

0.0

   HRS     

247.1

1,808.3

1,393.2

208.8

1,047.1

821.4

0.0

0.0

   WHITE   

158.1

1,280.4

998.8

49.9

646.1

568.7

0.0

0.0

   DURUM  

23.0

207.0

303.7

19.0

177.8

59.4

0.0

0.0

     TOTAL

676.6

5,687.6

5,081.9

505.4

3,930.2

3,795.3

0.0

0.0

BARLEY

0.0

36.3

48.8

0.3

2.4

7.9

0.0

0.0

CORN

-29.3

5,677.7

3,894.6

971.2

38,003.4

45,990.7

638.7

8,327.6

SORGHUM

4.3

723.9

150.8

82.6

3,640.7

1,502.6

163.0

984.0

SOYBEANS

257.8

7,448.7

7,784.9

674.5

39,329.7

40,940.1

3,344.2

13,731.2

SOY MEAL

260.9

1,794.6

2,046.1

185.3

9,876.5

9,538.2

32.9

557.3

SOY OIL

0.8

215.2

127.3

10.9

1,029.8

716.6

10.0

21.0

RICE


   L G RGH

0.0

93.3

182.8

0.0

1,329.4

1,347.8

6.0

75.5

   M S RGH

0.0

23.6

14.7

0.0

72.9

88.6

0.0

5.7

   L G BRN

0.0

9.9

2.0

0.2

59.1

39.9

0.0

0.0

   M&S BR

0.1

31.7

0.1

0.1

87.6

152.8

0.0

0.0

   L G MLD

19.7

66.9

184.2

5.3

864.8

863.1

0.0

0.0

   M S MLD

3.1

80.6

89.5

6.4

667.6

571.9

0.0

0.1

     TOTAL

23.0

305.9

473.3

12.0

3,081.4

3,064.1

6.0

81.3

COTTON


THOUSAND RUNNING BALES      

   UPLAND

118.7

3,340.7

2,657.1

320.8

13,784.2

12,886.2

9.5

3,546.3

   PIMA

9.1

136.8

82.5

7.8

466.6

642.9

0.5

38.5


Terry Reilly

Senior Commodity Analyst – Grain and Oilseeds

Futures International │190 S LaSalle St., Suite 410│Chicago, IL  60603

W: 312.604.1366

treilly@futures-int.com

AIM: fi_treilly

ICE IM: 
treilly1

Skype: fi.treilly


Description: Description: Description: Description: FImail


Trading of futures, options, swaps and other derivatives is risky and is not suitable for all persons.  All of these investment products are leveraged, and you can lose more than your initial deposit.  Each investment product is offered
only to and from jurisdictions where solicitation and sale are lawful, and in accordance with applicable laws and regulations in such jurisdiction.  The information provided here should not be relied upon as a substitute for independent research before making
your investment decisions.  Futures International, LLC is merely providing this information for your general information and the information does not take into account any particular individual’s investment objectives, financial situation, or needs.  All investors
should obtain advice based on their unique situation before making any investment decision.  The contents of this communication and any attachments are for informational purposes only and under no circumstances should they be construed as an offer to buy or
sell, or a solicitation to buy or sell any future, option, swap or other derivative.  The sources for the information and any opinions in this communication are believed to be reliable, but Futures International, LLC does not warrant or guarantee the accuracy
of such information or opinions.  Futures International, LLC and its principals and employees may take positions different from any positions described in this communication.  Past results are not necessarily indicative of future results.