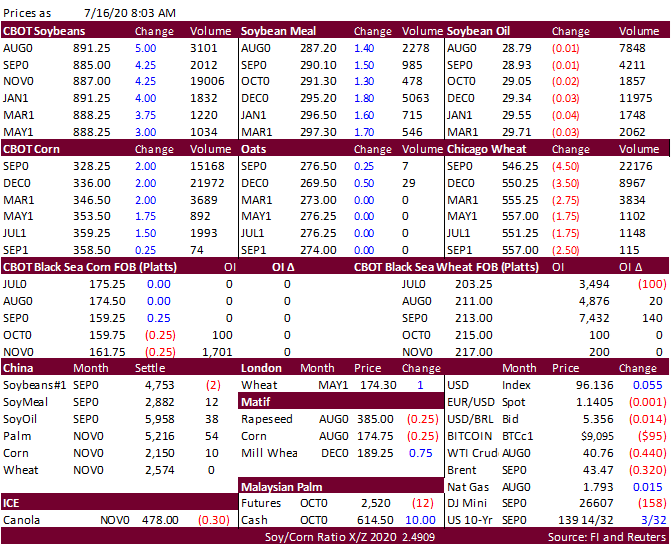
PDF attached


Morning.  


A
combined 873,000 tons of old and new-crop soybean 24-hour sales were sold to China and unknown.


USDA
export sales showed new-crop corn sales below expectations despite the Chinese sale. China booked 768,300 tons of old crop corn and 600,000 tons new-crop.  Soybeans and meal were within expectations. Soybean oil on the lighter side.  Wheat exceeded expectations.
38,500 tons were recorded for pork and 72,700 tons for sorghum. 


Soybeans
and corn are higher again on follow through bullish sentiment over Chinese demand.  Chicago wheat is lower after reaching a 3-month high. China was said to be in for US wheat on Wednesday.  The first week of the GFS model was wetter for areas across Nebraska
through Iowa and Missouri to Ohio, Kentucky, Virginia and North Carolina, and wetter for Missouri and Delta for the July 23-25 period.  The northern half of the Canadian Prairies was wetter for the July 23-25 period.  We heard China bought 3-4 Q4 US soybean
cargoes.  Malaysian palm oil traded lower after a 4-session winning streak.  WTI crude is lower and USD higher.  Reuters: Argentina does not plan to increase grains export taxes – Agriculture Minister. China sold 4.026 million tons of corn out of reserves
at an average selling price of 1,950 yuan per ton.  32 million tons were sold at auction this season, not including Sinograin sales.  China’s pork production fell 4.7 percent in Q2 (April-June), a seventh consecutive of a decline, to 9.6 million tons, according
to Reuters. Saudi Arabia seeks 720,000 tons of barley on Friday.  South Korea’s KOCOPIA group bought 60,000 tons of corn from Brazil at $196.31/ton c&f for Sep 5-25 arrival.  South Korea’s KFA group passed on 69,000 tons of corn. Lowest price was said to be
$195.37/ton c&f for Nov 15 arrival.  South Korea’s FLC group bought 65,000 tons of corn, optional origin, at $184.74/ton c&f for Oct 10 arrival.  Russia’s Hydrometcentre warned unfavorable weather in the first half of July may downgrade grain harvest estimates. 
They still look for a large crop, equal to an average crop of recent years.  Strategie Grains lowered their EU soft wheat crop at 130.3MMT from 130.9MMT, 11.5 percent below 2019. 


Weather
and Crop Progress


US
CPC: Above normal precipitation favored for the northern Great Plains and upper Miss Valley.  Aug-Sep above normal temperatures. 


UNITED
STATES

  • The
    first week of the 06z GFS model run was wetter in “portions” of the region from Nebraska through Iowa and Missouri to Ohio, Kentucky, Virginia and North Carolina
    • Some
      of these increases were overdone
  • GFS
    increased rain eastern Kansas and Missouri, the Delta and southeastern states July 23-25
    • Some
      of the increase was overdone
  • GFS
    increased rain in the northwest half of Canada’s Prairies July 23-25 while rain was reduced in the southeastern parts of the Prairies, northeastern North Dakota and from northern Minnesota to Upper Michigan
    • Some
      of these changes were needed
  • A
    small reduction in lower Midwest rainfall was suggested July 26-28 while rain was increased in the Delta and southeastern states
    • Some
      of these changes were needed, but the lower Midwest may be a little dry
  • Rain
    was increased from South Dakota to northwestern Wisconsin July 26-28 while reduced from the Dakotas to northern Minnesota
    • Some
      of the change was needed; the previous GFS model run was too wet, but the placement of rain on this new model run looks a little questionable
  • GFS
    reduced rain from Colorado to eastern South Dakota, Minnesota and Wisconsin July 29-30
    • Some
      of this reduction was needed


The
general theme for the coming week remains about the same as that of Wednesday with rain likely in most of the Midwest at one time or another and sufficient rain will be present to support reproducing corn and flowering soybeans. Very few areas will be completely
missed by rain, but some areas will need greater amounts to fully restore soil moisture after recent drying. Temperatures will be quite warm across the Midwest this weekend and possibly again late next week and into the following weekend which may accelerate
drying. Pockets of dryness are expected during the next two weeks, but a widespread generalized problem with moisture shortages is unlikely. A close watch on the distribution of rain is warranted because some of the rain advertised seems a little overdone
and pockets of dryness at the end of this month could fester into a more stressful environment in August if rainfall becomes more limited in the southwestern Corn Belt and Delta as expected.


RUSSIA
NEW LANDS

  • GFS
    model has backed off on some of the rainfall advertised for the New Lands during this coming week
    • Some
      showers are expected, but some relief from dryness is expected in some areas, but the need for greater and more widespread rain will continue
  • 06z
    GFS model run and the 00z European model run have increased rainfall in the central New Lands late next week and into the following weekend
    • Some
      of this increase was a little overdone, but this forecast may be better than that advertised previously this week
  • A
    few showers were also advertised for July 29-30 in a part of the central New Lands which was an increase over the previous model run forecast
    • The
      increase may verify, but rain amounts will have to remain light


Today’s
forecast for the New Lands has improved over that of earlier this week with rising confidence. The strong ridge of high pressure and limited rainfall that has dominated this week will begin to break down this weekend, although today and Friday may again be
hot and dry. The breakdown of the ridge will be a gradual process and even though temperatures will become less oppressive during the weekend and early next week there will continue to be a warm bias and rainfall will be limited to scattered showers in only
a portion of the region. Greater “potential” relief may come along later next week and into the following weekend, although that period of time will need to be closely monitored due to the potential that the ridge might reassert itself on the region in future
model runs.


EUROPE/BLACK
SEA REGION

  • Both
    the European and GFS model runs are suggesting a higher potential for rain in western Europe during the second weekend of the outlook
    • The
      GFS is much wetter than the European model, but “some” relief to drying may occur in a “part” of France, the U.K. and neighboring areas at that time if the models are correct
  • The
    only change noted by the GFS in this first week of the outlook was a small increase in eastern Ukraine rainfall early next week
    • Some
      of this increase may be overdone; the European and Canadian models keep the region limited on rainfall through day ten
  • Northwestern
    Europe will continue be drier biased through the coming week, despite a few showers briefly early next week that will have little impact on overall dryness in France, the U.K., Belgium or Germany


CHINA

  • GFS
    model has returned heavier rainfall to the heart of the Northeast Provinces this weekend into Monday
    • The
      advertised rainfall may be a little overdone with 2.00 to 5.00 inches of rain advertised from northeastern Hebei to northwestern Heilongjiang
  • Little
    other change was noted over the next ten days with excessive rain still expected in the Yangtze River Basin during a part of this period with the GFS promoting some of this heavy rain as far northeast as Shandong; the European model has the greatest rain from
    northern Jiangsu to Sichuan and northern parts of Hunan


China’s
bottom line remains too wet for parts of the Yangtze River Basin and areas northeast into Jiangsu and possibly far southern Shandong over the next ten days. A better mix of weather is expected to the north, although some heavy rain is possible for a brief
period of time weekend and early next week. Far southeastern China may experience net drying for a while.


AUSTRALIA

  • Not
    much change was noted in the outlook today through day 10
    • Previously
      advertised rain in Queensland and northern New South Wales has been greatly reduced with most of the rain now likely in southeastern Queensland near the coast Tuesday into Thursday of next week and this solution seems to make more sense than Wednesday’s model
      runs


SOUTH
AMERICA

Today’s
model solutions have diminished some of the rain advertised for western Argentina, although rain is still expected late this weekend into early next week. Some of the reduction was needed and all of the rain that falls will be welcome, although more will certainly
be needed. Far southern Brazil rainfall was reduced in the 06z GFS model run and that change was needed after the previous model run was too wet.

Source:
World Weather Inc. and FI


U.S. Drought Monitor Change Map


Bloomberg
Ag Calendar

THURSDAY,
July 16:

  • USDA
    weekly crop net-export sales for corn, soybeans, wheat, cotton, pork, beef, 8:30am
  • Port
    of Rouen data on French grain exports
  • North
    America 2Q cocoa grindings
  • European
    Cocoa Association 2Q grind data

FRIDAY,
July 17:

  • ICE
    Futures Europe weekly commitments of traders report, 1:30pm (6:30pm London)
  • CFTC
    commitments of traders weekly report on positions for various U.S. futures and options, 3:30pm
  • FranceAgriMer
    weekly update on crop conditions
  • Cocoa
    Association of Asia releases 2Q cocoa grind data

Source:
Bloomberg and FI


USDA
export sales showed new-crop corn sales below expectations despite the Chinese sale. China booked 768,300 tons of old crop corn and 600,000 tons new-crop.  Soybeans and meal were within expectations. Soybean oil on the lighter side.  Wheat exceeded expectations.
38,500 tons were recorded for pork and 72,700 tons for sorghum.


Macros

US
Retail Sales Ex Auto (M/M) Jun: 7.5% (exp 5.0%; prev 18.2%)

–        
Retail Sales ex Auto And Gas (M/M) Jun: 7.3% (exp 5.0%; R prev 12.1%)

US
Initial Jobless Claims Jul-11: 1300K (exp 1250K; R prev 1310K)

–        
Continuing Claims Jul-10: 17338K (exp 17500K; R prev 17760K)

US
Philadelphia Fed Business Outlook Jul: 24.1 (exp 20.0; prev 27.5)


Corn.

·        
The USD was 7 higher by 7:46 am CT. 


Corn
Export Developments

  • Saudi
    Arabia seeks 720,000 tons of barley on Friday. 
  • South
    Korea’s KOCOPIA group bought 60,000 tons of corn from Brazil at $196.31/ton c&f for Sep 5-25 arrival. 
  • South
    Korea’s KFA group passed on 69,000 tons of corn. Lowest price was said to be $195.37/ton c&f for Nov 15 arrival. 
  • South
    Korea’s FLC group bought 65,000 tons of corn, optional origin, at $184.74/ton c&f for Oct 10 arrival. 
  • Results
    awaited: Iran seeks 200,000 tons of corn and 200,000 tons of barley on Wednesday for Aug/Sep delivery. 


Soybean
complex
.

·        
News for the soybean complex is light. 

·        
We heard China bought at least 3-4 soybean cargoes from the US for Q4 shipment. 

·        
Rotterdam values this morning showed soybean oil for the August/September position was up 7 euros from this time previous session, rapeseed oil down 8 in the nearby, and soybean meal when imported from South America unchanged
to 3 euros higher. 

·        
China cash crush margins as of this morning, using our calculation, were 125 cents per bushel (119 previous) and compares to 89 cents a week ago and 41 cents around this time last year.

·        
NOPA reported a US June crush at 167.3 million bushels, 5.1 million above an average trade guess.  NOPA end of June soybean oil stocks of 1.778 billion pounds were 35 million below a trade guess and down from 1.880 billion pounds
reported at the end of May.   The June crush was a record for that month.  Daily adjusted it improved to 5.58 million bushels per day from 5.47 million last month.  Soybean meal exports were good at 835,400 short tons and were the second highest for the month
of June in at least 15 years.  Soybean oil stocks for end of June were the highest for that month since 2019.  With a large crush, implied soybean oil demand was good.  June exports were likely high. 


Oilseeds
Export Developments

·        
Oil World noted combined US sales of sorghum, corn, wheat and soybeans (4) to China from March to mid-June total 18.3 million tons (18.8MMT after this morning) from 5.6 million year earlier, while actual exports remain low at
4.2MMT vs. 5.7 year earlier. 


Wheat

·        
Paris December wheat was up 0.50 at 189.00, at the time this was written.


Export
Developments.

·        
Japan bought 125,957 tons of food wheat from the US, Canada, and/or Australia. 

  • Jordan
    seeks 120,000 tons of wheat on July 21 for Sep-Nov shipment. 
  • Japan
    in an SBS import tender seeks 80,000 tons of feed wheat and 100,000 tons of barley on July 22 for arrival by December 24.
  • Ethiopia
    postponed an import tender for 400,000 tons of wheat to July 20 from July 10. 
  • Syria
    seeks 200,000 tons of milling wheat from Russia by July 28. 


Rice/Other

  • None
    reported


U.S. EXPORT SALES FOR WEEK ENDING 7/9/2020                        


CURRENT MARKETING YEAR

NEXT MARKETING YEAR

COMMODITY

NET SALES

OUTSTANDING SALES

WEEKLY EXPORTS

ACCUMULATED EXPORTS

NET SALES

OUTSTANDING SALES

CURRENT YEAR

YEAR
AGO

CURRENT YEAR

YEAR
AGO


THOUSAND METRIC TONS

WHEAT


   HRW    

349.7

1,871.1

1,642.9

304.2

1,312.0

1,509.3

0.0

0.0

   SRW    

14.4

535.5

837.3

89.7

207.6

277.0

0.0

0.0

   HRS     

280.8

1,680.0

1,297.1

184.6

772.1

639.8

0.0

0.0

   WHITE   

103.0

1,151.1

994.3

57.5

468.6

404.1

0.0

0.0

   DURUM  

16.5

190.0

173.2

5.5

136.7

59.4

0.0

0.0

     TOTAL

764.4

5,427.7

4,944.9

641.4

2,896.9

2,889.6

0.0

0.0

BARLEY

-3.0

36.9

46.3

0.3

1.8

5.5

0.0

0.0

CORN

981.1

7,508.6

4,913.0

1,014.3

35,981.2

44,708.0

655.4

5,361.7

SORGHUM

72.7

848.3

201.5

70.6

3,434.9

1,447.7

53.0

646.0

SOYBEANS

313.0

7,967.5

9,278.8

575.3

38,340.3

39,381.3

767.6

8,086.5

SOY MEAL

177.2

1,878.4

2,175.3

204.4

9,486.5

9,208.3

27.8

470.2

SOY OIL

5.7

242.8

145.7

2.6

981.1

680.0

0.0

11.0

RICE


   L G RGH

0.4

94.7

230.0

4.9

1,323.3

1,264.0

12.5

69.5

   M S RGH

0.0

23.6

14.8

0.0

72.9

88.6

0.0

5.7

   L G BRN

0.1

10.4

2.4

0.8

58.0

39.3

0.0

0.0

   M&S BR

0.1

31.7

0.1

0.0

87.5

152.4

0.0

0.0

   L G MLD

15.2

65.2

158.8

5.6

840.5

840.0

0.0

0.0

   M S MLD

2.8

111.7

127.2

6.8

632.0

528.2

0.0

0.1

     TOTAL

18.5

337.2

533.3

18.2

3,014.2

2,912.4

12.5

75.2

COTTON


THOUSAND RUNNING BALES      

   UPLAND

-17.5

3,827.2

3,093.4

311.7

13,192.1

12,276.7

29.1

3,525.9

   PIMA

5.8

126.5

95.5

0.8

456.5

628.1

0.0

37.5


Export Sales Highlights 

This
summary is based on reports from exporters for the period July 3-9, 2020.

Wheat:  Net
sales of 764,400 metric tons (MT) for 2020/2021–a marketing-year high–were up noticeably from the previous week and up 77 percent from the prior 4-week average.  Increases primarily for China (323,700 MT), Mexico (132,800 MT, including 22,000 MT switched
from unknown destinations and decreases of 5,100 MT), Indonesia (81,500 MT), Japan (67,300 MT), and the Philippines (66,000 MT), were offset by reductions for unknown destinations (41,300 MT), Venezuela (18,000 MT), Malaysia (1,700 MT), and Nicaragua (200
MT).  Exports of 641,400 MT were up 56 percent from the previous week and 23 percent from the prior 4-week average.  The destinations were primarily to China (113,700 MT), Taiwan (94,500 MT), Japan (92,000 MT), Mexico (83,800 MT), and the Philippines (66,000
MT). 

Corn: 
Net sales of 981,100 MT for 2019/2020 were up noticeably from the previous week and from the prior 4-week average.  Increases primarily for China (768,300 MT), Colombia (109,800 MT), Peru (74,700 MT, including 68,400 MT switched from unknown destinations),
Saudi Arabia (71,500 MT, including 65,000 MT switched from unknown destinations), and Japan (52,500 MT, including 42,300 MT switched from unknown destinations and decreases of 800 MT), were offset by reductions primarily for unknown destinations (145,700 MT),
Nicaragua (14,000 MT), Guatemala (8,400 MT), Costa Rica (8,400 MT), and South Korea (2,200 MT).  For 2020/2021, net sales of 655,400 MT primarily for China (600,000 MT), Japan (54,000 MT), Guatemala (32,500 MT), Honduras (20,900 MT), and Costa Rica (8,000
MT), were offset by reductions for unknown destinations (62,000 MT).  Exports of 1,014,300 MT were down 7 percent from the previous week and 14 percent from the prior 4-week average.  The destinations were primarily to Mexico (275,400 MT), Japan (228,000 MT),
China (119,700 MT), Peru (96,400 MT), and Saudi Arabia (71,500 MT). 

Optional
Origin Sales:  For 2019/2020, the current outstanding balance of 325,000 MT is for South Korea (195,000 MT), Vietnam (65,000 MT), and Taiwan (65,000 MT).  For 2020/2021, the current outstanding balance of 195,000 MT is for Vietnam.

Barley: 
Net sales reductions of 3,000 MT for 2020/2021–a marketing-year low–were reported for Japan.  Exports of 300 MT were primarily to South Korea (200 MT) and Taiwan (100 MT).

Sorghum: 
Net sales of 72,700 MT for 2019/2020 were up 35 percent from the previous week and 50 from the prior 4-week average.  Increases reported for China (135,100 MT, including 66,000 MT switched from unknown destinations), were offset by reductions for unknown destinations
(62,400 MT).  For 2020/2021, total net sales of 53,000 MT were for unknown destinations.  Exports of 70,600 MT were up 38 percent from the previous week, but down 44 percent from the prior 4-week average.  The destination was China.

Rice: 
Net sales
of 18,500 MT for 2019/2020 were down 14 percent from the previous week, but up 56 from the prior 4-week average.  Increases were primarily for Haiti (11,200 MT), Canada (3,200 MT, including decreases of 100 MT), Mexico (1,800 MT), Saudi Arabia (600 MT), and
Qatar (400 MT)

For 2020/2021, total net sales of 12,500 MT were for Nicaragua.  E
xports
of 18,200 MT were down 14 percent from the previous week and 63 percent from the prior 4-week average.  The destinations were primarily to Mexico (5,700 MT), Japan (3,800 MT), Canada (3,600 MT), Saudi Arabia (2,800 MT), and Taiwan (600 MT).

Exports
for Own Account:
 
For 2019/2020, the current exports for own account outstanding balance is 100 MT, all Canada.

Soybeans: 
Net sales of 313,000 MT for 2019/2020 were down 67 percent from the previous week and 46 percent from the prior 4-week average.  Increases primarily for Indonesia (95,500 MT, including 68,000 MT switched from unknown destinations), Egypt (75,000 MT), Pakistan
(58,300 MT, including 60,000 MT switched from unknown destinations and decreases of 1,700 MT), Mexico (55,700 MT, including 47,500 MT switched from unknown destinations and decreases of 1,300 MT), and Tunisia (37,100 MT, including 32,000 MT switched from China),
were offset by reductions for Algeria (35,000 MT), unknown destinations (19,500 MT), China (5,800 MT), and Panama (300 MT).  For 2020/2021, net sales of 767,600 MT were primarily for China (389,000 MT), unknown destinations (176,000 MT), Spain (75,000 MT),
Algeria (35,000 MT), and Mexico (19,600 MT).  Exports of 575,300 MT were up 23 percent from the previous week and 49 percent from the prior 4-week average.  The destinations were primarily to China (227,900 MT), Indonesia (89,100 MT), Mexico (70,700 MT), Tunisia
(67,100 MT), and Pakistan (58,300 MT). 

Exports
for Own Account:
 
For 2019/2020, the current exports for own account outstanding balance is 2,100 MT, all Canada.

Soybean
Cake and Meal: 
Net
sales of 177,200 MT for 2019/2020 were up 43 percent from the previous week and 54 percent from the prior 4-week average.  Increases primarily for Japan (33,000 MT, including 3,000 MT switched from unknown destinations), Colombia (31,000 MT), the Dominican
Republic (30,000 MT), Canada (20,400 MT), and the Philippines (19,400 MT), were offset by reductions primarily for unknown destinations (8,000 MT). 
For
2020/2021, net sales of 27,800 MT were for Honduras (12,000 MT), El Salvador (6,300 MT), Costa Rica (6,000 MT), the Philippines (2,500 MT), and unknown destinations (1,000 MT). 
Exports
of 204,400 MT were down 34 percent from the previous week and 18 percent from the prior 4-week average.  The destinations were primarily to the Philippines (94,100 MT), Mexico (31,600 MT), Canada (27,800 MT), Guatemala (9,800 MT), and Panama (6,600 MT). 

Soybean
Oil: 
Net
sales of 5,700 MT for 2019/2020 were primarily for Guatemala (4,200 MT, including decreases of 3,000 MT), Mexico (800 MT), the Dominican Republic (500 MT), and Canada (200 MT).  Exports of 2,600 MT were up 25 percent from the previous week, but down 87 percent
from the prior 4-week average.  The destinations were primarily to Mexico (1,500 MT), Trinidad and Tobago (700 MT), and Canada (300 MT).

Cotton: 
Net sales reductions of 17,500 RB for 2019/2020 were down noticeably from the previous week and from the prior 4-week average.  Increases primarily for Vietnam (26,500 RB, including 4,600 RB switched from China, 2,200 RB switched from South Korea, and 1,000
RB switched from Hong Kong), Pakistan (6,400 RB), and Indonesia (2,100 RB, including 1,700 RB switched from Taiwan and 200 RB switched from Japan), were more than offset by reductions primarily for China (38,600 RB), El Salvador (4,000 RB), Peru (3,600 RB),
Thailand (2,900 RB), and Bangladesh (1,300 RB).  For 2020/2021, net sales of 29,100 RB primarily for China (8,800 RB), South Korea (6,600 RB), Bangladesh (4,400 RB), El Salvador (4,000 RB), and Indonesia (3,700 RB), were offset by reductions for Pakistan (500
RB).  Exports of 311,700 RB were down 5 percent from the previous week and 2 percent from the prior 4-week average.  Exports were primarily to Vietnam (94,500 RB), China (91,700 RB), Turkey (36,700 RB), Pakistan (32,900 RB), and Bangladesh (12,700 RB).  Net
sales of Pima totaling 5,800 RB were up noticeably from the previous week and up 39 percent from the prior 4-week average.  Increases were primarily for China (1,800 RB), Egypt (1,300 RB), Pakistan (1,100 RB), India (600 RB), and Turkey (400 RB).  Exports
of 800 RB–a marketing-year low–were down 89 percent from the previous week and 88 percent from the prior 4-week average.  The destinations were to Pakistan (400 RB), Honduras (300 RB), and Indonesia (100 RB). 

Exports
for Own Account:
 
For 2019/2020, new exports for own account totaling 400 RB were to Vietnam.  Exports for own account totaling 6,800 RB to Vietnam (4,700 RB), China (900 RB), Pakistan (600 RB), and Bangladesh (600 RB) were applied to new or outstanding sales.  The current
exports for own account outstanding balance of 18,400 RB is for China (8,500 RB), Indonesia (8,200 RB),
Bangladesh
(1,000 RB), and
Vietnam
(700 RB).

Hides
and Skins:

Net sales of 573,900 pieces for 2020 were down 9 percent from the previous week, but up 16 percent from the prior 4-week average.  Increases primarily for China (438,300 whole cattle hides, including decreases of 17,900 pieces), South Korea (69,700 whole cattle
hides, including decreases of 300 pieces), Mexico (26,000 whole cattle hides, including decreases of 2,500 pieces), Brazil (14,300 whole cattle hides), and Thailand (8,700 whole cattle hides, including decreases of 4,100 pieces), were offset by reductions
for Indonesia (300 pieces).
   
Exports of 464,100 pieces reported for 2020 were down 10 percent from the previous week, but up 4 percent from the prior 4-week average.  Whole cattle hides exports were primarily to China (369,700 pieces), South Korea (41,000
pieces), Mexico (21,700 pieces), Thailand (19,000 pieces), and Indonesia (6,600 pieces).  In addition, exports of 1,300 kip skins were to Canada.

Net
sales of 12,500 wet blues for 2020 resulting in increases for China (63,600 unsplit and 4,400 grain splits), Italy (4,600 unsplit), India (1,900 grain splits), Taiwan (1,600 grain splits), and South Korea (1,500 grain splits), were more than offset by reductions
for Mexico (64,900 grain splits).  Exports of 80,900 wet blues for 2020 were up 73 percent from the previous week and 17 percent from the prior 4-week average.  The destinations were primarily to China (40,100 unsplit), Italy (28,000 unsplit), Thailand (4,000
unsplit), Taiwan (3,200 unsplit), and Vietnam (2,900 unsplit).  Net sales of 244,400 splits were for China (240,600 pounds) and Vietnam (3,800 pounds).  Exports of 40,000 pounds were to Vietnam.

Beef:
Net
sales of 27,800 MT reported for 2020 were up noticeably from the previous week and up 68 percent from the prior 4-week average.  Increases were primarily for South Korea (7,900 MT, including decreases of 400 MT), Japan (6,300 MT, including decreases of 400
MT), Mexico (3,600 MT, including decreases of 100 MT), Taiwan (2,500 MT, including decreases of 100 MT),  and Canada (2,000 MT, including decreases of 200 MT).  Exports of 15,500 MT were up 3 percent from the previous week and 9 percent from the prior 4-week
average.  The destinations were primarily to Japan (5,200 MT), South Korea (5,100 MT), Taiwan (1,200 MT), Canada (1,000 MT), and Mexico (800 MT).

Pork:
Net sales of 38,500 MT reported for 2020 were up 22 percent from the previous week and 16 percent from the prior 4-week average.  Increases were primarily for Mexico (10,100 MT, including decreases of 400 MT), China (8,000 MT, including decreases of
800 MT), Canada (5,700 MT, including decreases of 400 MT), Japan (3,700 MT, including decreases of 300 MT),  and South Korea (3,300 MT, including decreases of 300 MT).  Exports of 29,300 MT were down 13 percent from the previous week and 8 percent from the
prior 4-week average.  The destinations were primarily to China (12,300 MT), Mexico (7,600 MT), Japan (2,700 MT, including 100 MT late – see below), Canada (2,100 MT), and South Korea (1,600 MT).


Terry Reilly

Senior Commodity Analyst – Grain and Oilseeds

Futures International │190 S LaSalle St., Suite 410│Chicago, IL  60603

W: 312.604.1366

treilly@futures-int.com

AIM: fi_treilly

ICE IM: 
treilly1

Skype: fi.treilly


Description: Description: Description: Description: FImail


Trading of futures, options, swaps and other derivatives is risky and is not suitable for all persons.  All of these investment products are leveraged, and you can lose more than your initial deposit.  Each investment product is offered
only to and from jurisdictions where solicitation and sale are lawful, and in accordance with applicable laws and regulations in such jurisdiction.  The information provided here should not be relied upon as a substitute for independent research before making
your investment decisions.  Futures International, LLC is merely providing this information for your general information and the information does not take into account any particular individual’s investment objectives, financial situation, or needs.  All investors
should obtain advice based on their unique situation before making any investment decision.  The contents of this communication and any attachments are for informational purposes only and under no circumstances should they be construed as an offer to buy or
sell, or a solicitation to buy or sell any future, option, swap or other derivative.  The sources for the information and any opinions in this communication are believed to be reliable, but Futures International, LLC does not warrant or guarantee the accuracy
of such information or opinions.  Futures International, LLC and its principals and employees may take positions different from any positions described in this communication.  Past results are not necessarily indicative of future results.