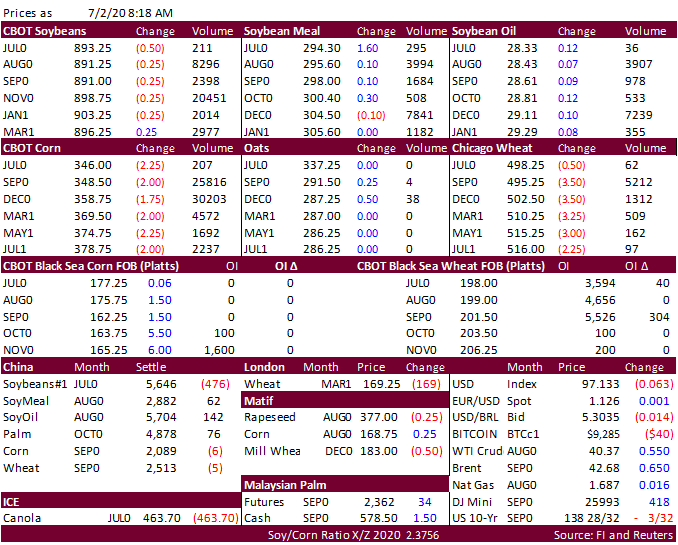
PDF attached


Morning.
Mixed trade in the ags this morning but we could see corn and soybeans move higher.  Private exporters sold 202,000 tons of new-crop corn to China and 126,000 new-crop soybeans to China.  Profit taking is seen in corn and soybeans today
ahead of the long US holiday weekend.  News is light.  Today we close early for the US July 4 holiday (12:05 PM CT).  Friday CFTC should release Commitment of Traders.  Banks are open but CBOT will be closed.  China sold all of its corn offered at auction,
roughly 4 million tons.  They also sold 8 million tons of cotton, all offered.  Jordan is in for wheat.  Offshore values are basically flat for soybean oil but leading meal lower.  Look for a light trade today.  USDA export sales were seen neutral for the
soybean complex, lighter side for corn and within expectations for wheat.  US weather outlook was largely unchanged for week one. 


Weather
and Crop Progress

UNITED
STATES

  • No
    big changes were noted overnight in the first week of the outlook
    • Rain
      was increased in Oklahoma and reduced in central through north-central Texas early next week
      • The
        changes were needed, although a little too much rain may be advertised from southwestern Kansas to western Arkansas
    • Rain
      was reduced in Virginia and increased from northeastern Alabama through Georgia to South Carolina during the first half of next week
    • Temperatures
      are still advertised warmer than usual in the northern Plains and northern Midwest and a little cooler than usual in the Pacific Northwest while seasonable in other key crop areas
  • GFS
    Ensemble pushes ridge axis into the Rocky Mountains July 10 and it prevails there through July 18
  • GFS
    Operational does not push the ridge into the Rocky Mountains and leaves it there, but flattens the top of the ridge and allows high heights to continue over a large part of the Plains and Midwest through July 18 – World Weather, Inc. prefers the GFS Ensemble
    solution
  • GFS
    increased rainfall in the southeastern states for July 9-11
    • Some
      of the increase was overdone
  • GFS
    increased rainfall in southern Canada’s Prairies and in random areas from central Nebraska to central Minnesota
    • The
      Canada increase was needed, but the locally strong storms Nebraska to Minnesota may  have been overdone
  • Scattered
    showers were increased across the Great Lakes region July 12-14
    • Some
      of this increase was needed
  • Rain
    was reduced in the eastern Canada Prairies July 12-14
    • The
      change was needed
  • Rain
    was removed from Missouri and the lower Midwest July 15-16
    • The
      change was needed
  • GFS
    develops a tropical cyclone near the upper west coast of peninsular Florida July 14 and allows the storm to meander near the northwestern Florida coast through July 18 with no landfall, but the center of the storm was nearing Mobile Bay, Alabama on July 18
    • Confidence
      in this tropical event is extremely low


The
bottom line to the U.S. outlook remains similar to that of Wednesday with a warm and limited rainfall bias over the next two weeks in the heart of the Midwest. That comes from the operational GFS. World Weather, Inc. is looking for the Ensemble solution to
verify and if that is the case the July 12-18 period is likely to have a little more rainfall in it as a cool front moves across the northern and eastern Midwest during that week and temperatures will be seasonably warm, but not hot. In the meantime, the coming
week will be wettest in the northern Plains and a part of the upper Midwest as well as the Delta and southeastern states with net drying in areas between these two regions. Please be careful to not misinterpret our comments about July 12-18. There will be
some showers in the Midwest during that time, but rainfall will not be great enough to seriously reverse the drying trend, but “some” areas “might” get enough to slow the drying trend.


EUROPE/BLACK
SEA

  • No
    change in the first week of the outlook
    • Net
      drying will occur in France, parts of Germany, Belgium, southern England and possibly a few areas in Poland and the Iberian Peninsula
    • Net
      drying also occurs from eastern Ukraine into Russia’s Southern Region and southwestern Kazakhstan
  • GFS
    increased rain in western Europe July 9-11 and while rain was reduced in northwestern Russia and northeastern Europe
    • Some
      of the increase was overdone
  • Rain
    was increased July 12-14 from the eastern Balkan Countries into Ukraine and areas north into the Baltic States and western Russia
    • Some
      of this increase was overdone
  • Rain
    was reduced in southern France July 12-14
    • A
      little too much rain may have been removed
  • GFS
    increased rain in the North Sea region July 15-16 while reducing it from southern Germany and a part of the northwestern Balkan region to Belarus and northwestern Russia
    • The
      changes were a little exaggerated
  • GFS
    increased rainfall from Russia’s Southern Region into the Baltic States July 15-16
    • This
      increase was overdone


Our
official forecast is not changing for the next ten days. Drier biased conditions will prevail across France, southern parts of the U.K., portions of Germany, Belgium and the Iberian Peninsula. Net drying will also continue from eastern Ukraine into Russia’s
Southern Region and southwestern Kazakhstan. Some increase in shower activity will then be possible in the North Sea region for the period July 12-16 while a net drying bias remains in Russia’s Southern Region and eastern Ukraine. Scattered showers will occur
periodically in most other areas


RUSSIA
NEW LANDS

  • No
    change was noted in the first week of the outlook
    • Net
      drying is still advertised for the central New Lands for much of the coming ten days
  • GFS
    reduced rain in the western New Lands (mostly near and west of the Ural Mountains for July 9-11
    • This
      change was needed
  • Much
    less rain was also suggested for the July 12-16 period as well for all areas from the Ural Mountains region westward
    • This
      change was needed


Overall
concern about drying in the central New Lands will rise over the next couple of weeks, although the region is not expected to become too dry for a while. Temperatures will trend warmer, although not hot.


CHINA

No
significant change was noted in the first week of the outlook

  • Scattered
    showers occur in most of the nation at one time or another with heavy rain expected periodically in the Yangtze River Basin where local flooding is possible
  • The
    second week of the outlook is drier biased in most of northern China at least from July 9-14 before rain increases again July 15-16
    • The
      reduction in rainfall July 9-14 was welcome and should verify, although a little too much rain may have been removed from the region
  • GFS
    increased rainfall in parts of northern China (north of the Yellow River and into Liaoning
    • Some
      of the increase was overdone


China’s
southeastern provinces experience a drier second week of the outlook in today’s two most recent GFS model runs. The change offers hope for better crop conditions and a chance to improve property conditions after this year’s flooding. The Yangtze River Basin,
however, will continue to experience more flooding periodically, but the severity of that flooding is not likely to be nearly what it has been in recent weeks. Drier weather in Northern China July 9-14 would be welcome if it verifies. A little more sunshine
and warmer temperatures would benefit crops in Heilongjiang more than anywhere else.


INDIA

No
huge changes to the outlook were noted today, although the 06z GFS reduced some of the central and northern rainfall expected. The region still gets heavy to excessive rain over the next two weeks making the change subtle and not very impacting. Rain is still
advertised to move more deeply into far northern and northwestern India over time while the far south sees the most limiting rainfall. Areas in Pakistan and along the Rajasthan border are also expecting limited rainfall. These drier biased areas are not going
to be unusually dry.


AUSTRALIA

No
serious changes occurred to the outlook overnight. The greater rain suggested last evening for eastern Australia was removed from the two more recent GFS model runs and that change was needed. The majority of the nation’s greatest rain will continue periodically
in Victoria and southwestern parts of Western Australia. There is still need for greater rain in Queensland and interior South Australia


SOUTH
AMERICA

No
changes were noted overnight. The greatest rainfall over the next two weeks will continue in far southern Brazil and southern Paraguay. Some periodic flooding may occur from northern Rio Grande do Sul into southern Parana.

Source:
World Weather Inc. and FI


Bloomberg
Ag Calendar

THURSDAY,
July 2:

  • UN
    FAO world food price index, 4am
  • USDA
    weekly crop net-export sales for corn, soybeans, wheat, cotton, pork, beef, 8:30am
  • Port
    of Rouen data on French grain exports
  • AB
    Foods trading update

FRIDAY,
July 3:

  • U.S.
    Independence Day Holiday
  • ICE
    Futures Europe weekly commitments of traders report, 1:30pm (6:30pm London)
  • CFTC
    commitments of traders weekly report on positions for various U.S. futures and options, 3:30pm
  • FranceAgriMer
    weekly update on crop conditions

Source:
Bloomberg and FI


USDA
export sales text can be found below the wheat comment.  It’s seen neutral for the soybean complex and wheat, slightly bearish for corn.  Sorghum sales were good at 144,400 tons old crop and 68,000 new crop.  China took 594,000 tons of new crop soybeans. 
Pork sales were 39,200 tons. 


Macros

·        
US Change In Non-Farm Payrolls Jun: 4800K (est 3230K; prev 2509K)

·        
US Unemployment Rate Jun: 11.1% (est 12.5%; prev 13.3%)

·        
US Change In Private Payrolls Jun: 4767K (est 3000K; prevR 3232K; prev 3094K)

·        
US Change In Manufacturing Payrolls Jun: 356K (est 425K; prevR 250K; prev 225K)

·        
US Trade Balance (USD) May: 54.6B (est -53.2B; prevR -49.8B; prev -49.4B)

·        
US Census: Crude Oil Exports Fell To 2.93M B/D In May (vs. 3.08M In April)


Corn.

·        
Look for corn to possibly trade two-sided today after USDA announced the sales of 202,000 tons of new crop corn was sold to China.   

·        
USDA export sales for corn of 361,100 tons were below expectations and new-crop of 262,700 tons were just above expectations.   Shipments were a marketing year high of 1.44 million tons and included 144,300 for China-already known
from the Monday export inspections report.   

·        
Sorghum sales were good at 144,400 tons old crop and 68,000 new crop. 

·        
Pork sales were 39,200 tons and included 21,600 tons for China. 

·        
Funds bought an estimated net 35,000 corn contracts on Wednesday after buying 40,000 on Tuesday 33,000 on Monday. 

·        
China sold all of its 4 million tons of corn out of reserves. 

·        
The USDA Broiler Report showed eggs set in the US up 1 percent and chicks placed up 1 percent from year ago.  Cumulative placements from the week ending January 4, 2020 through June 27, 2020 for the United States were 4.83 billion.
Cumulative placements were down 1 percent from the same period a year earlier.

·        
US weekly ethanol production was up 7,000 barrels per day, or 0.8% to 900,000 barrels and stocks were down a large 870,000 barrels or 4.1% to 20.164 million barrels.  A Bloomberg poll looked for weekly US ethanol production to
be up 15,000 and stocks to decrease 65,000 barrels.  Cumulative crop year to date production is down 10 percent from the comparable period last season.  We are using 4.875 billion bushels for corn for ethanol usage, 25 million below USDA.  The week ending
June 26 stamps the ninth consecutive week of expansion following the April 24 low of 537,000 barrels.  Stocks are down ten consecutive weeks to 20.164 since peaking at 27.689 million as of April 17, a 27 percent decrease. 

·        
USDA NASS reported corn use for ethanol production during May below our expectations ay 300 million bushels and well below 4.59 million year ago. 


Corn
Export Developments

  • Under
    the 24-hour announcement system, private exporters sold 202,000 tons of new-crop corn to China. 


Soybean
complex
.

·        
August soybeans were slightly lower and products mostly higher at the electronic close.  Look for a two-sided trade.

  • Under
    the 24-hour announcement system, private exporters sold 126,000 tons of new-crop soybeans to China. 

·        
USDA export sales was seen neutral for the soybean complex.  China took 594,000 tons of new crop soybeans.  Meal shipments of just below 200,000 tons slowed from the previous week and soybean oil shipments of 23,700 tons were
down from 52,200 tons from last week. 

·        
The May US soybean crush for the US came in 0.9 million bu below expectations at 179.5 million bushels and soybean oil stocks 48 million pounds above expectations at 2.447 billion.  See table below. 

·        
Brazil’s Paranagua port was knocked offline due to strong winds, delaying shipping.  Abiove sees Brazil’s soybean production at 125MMT, up 0.5 from previous.  StoneX (formally FC Stone) is at 122.61 million tons.  Conab (120.5
last month) is due out next week. 

·        
Brazil exported 13.750 million tons of soybean during June, up from 8.552 million tons year earlier.  The 13.75 million tons was about 1.5-3.0 million tons above some trade estimates we read late last month. 

·        
Funds bought an estimated net 11,000 soybeans contracts on Wednesday, bought 7,000 meal and bought 2,000 soybean oil.

·        
China cash crush margins as of this morning, using our calculation, were 63 cents per bushel (63 previous) and compares to 47 cents a week ago and 50 cents around this time last year.

·        
Malaysia

Second
day higher after trading 5 consecutive days lower


Oilseeds
Export Developments


Wheat

·        
Wheat was lower early this morning on light profit taking and little change in the US weather forecast. 

·        
USDA export sales for all wheat of 414,300 tons were within expectations, down from 518,700 tons week ago. 

·        
Funds bought an estimated net 7,000 Chicago wheat contracts on Wednesday. 


Export
Developments.

  • Jordan
    seeks 120,000 tons of wheat for November and December shipment on July 7. 
  • Syria
    seeks 200,000 tons of milling wheat from Russia by July 28. 
  • Yesterday
    Thailand bought over 100,000 tons (sought 236,800 tons) of feed wheat for Aug-Jan 2021 shipment. (3 consignments).  $215.50-$219.00 / ton was noted. 
  • Japan
    seeks 80,000 tons of feed wheat and 100,000 tons of barley on Wednesday, July 8, for arrival by December 24. 
  • Ethiopia
    seeks 400,000 tons of wheat on July 10 for shipment within two months.    


Rice/Other

  • None reported


Export Sales Highlights   


This summary is based on reports from exporters for the period June 19-25, 2020.


Wheat:  Net sales of 414,300 metric tons (MT) were reported for delivery in marketing year 2020/2021.  Increases primarily for Taiwan (89,300 MT, including decreases of
700 MT), Yemen (80,000 MT), Japan (55,000 MT, including decreases of 100 MT), Nigeria (52,800 MT), and Mexico (40,200 MT, including decreases of 8,000 MT), were offset by reductions for unknown destinations (27,500 MT).   For 2021/2022, net sales of 75,000
MT were reported for unknown destinations (67,000 MT) and Mexico (8,000 MT).   Exports of 508,600 MT were primarily to the Philippines (166,300 MT), Japan (78,900 MT, including 13,100 MT late – see below), Indonesia (58,200 MT), Nigeria (45,300 MT), and Mexico
(36,600 MT).   Late Reporting:  For 2020/2021, exports to Japan (13,100 MT) were reported late.  


Corn:  Net sales of 361,100 MT for 2019/2020 were down 22 percent from the previous week and 32 percent from the prior 4-week average.  Increases primarily for Japan (240,100
MT, including 192,300 MT switched from unknown destinations and decreases of 1,800 MT), Mexico (168,300 MT, including 61,000 MT switched from unknown destinations and decreases of 14,900 MT), Colombia (75,100 MT, including 63,400 MT switched from unknown destinations
and decreases of 200 MT), Peru (41,700 MT), and Tunisia (31,000 MT, including 30,000 MT switched from unknown destinations), were offset by reductions primarily for unknown destinations (282,600 MT). 
For 2020/2021, net sales of 262,700 MT were primarily for unknown destinations (109,900 MT), Japan (100,500 MT), Mexico (22,400 MT), and Taiwan (13,500 MT). 
Exports of 1,439,900 MT–a marketing-year high–were up 10 percent from the previous week and 21 percent from the prior 4-week average.  The destinations were primarily to Japan (456,700 MT, including
144,600 MT late – see below), Mexico (283,400 MT), South Korea (173,300 MT, including 37,300 MT late – see below),
China (144,300 MT), and Colombia (101,600 MT).   Optional Origin Sales:  For 2019/2020, the current outstanding balance of 325,000 MT is for South Korea (195,000 MT), Vietnam (65,000 MT), and Taiwan
(65,000 MT).  For 2020/2021, the current outstanding balance of 195,000 MT is for Vietnam.  Late Reporting: For 2019/2020, net sales totaling 74,100 MT were reported late. These sales were reported for unknown destinations.   For 2019/2020, exports totaling
229,800 MT were reported late. The destinations were to Japan (144,600 MT), South Korea (37,300 MT), Tunisia (31,000 MT), and Jamaica (17,000 MT).   


Barley:  Net sales of 1,000 MT for 2020/2021 were primarily for South Korea (900 MT).  Exports of 800 MT were primarily to Japan.


Sorghum:  Net sales of 144,400 MT for 2019/2020 were up noticeably from the previous week and from the prior 4-week average.  Increases were primarily for China (76,800
MT, including 68,000 MT switched from unknown destinations), unknown destinations (62,800 MT), and Japan (4,700 MT, switched from unknown destinations).    For 2020/2021, total net sales of 68,000 MT were for unknown destinations.  Exports of 131,300 MT were
up 19 percent from the previous week, but down 19 percent from the prior 4-week average.    The destinations were to China (125,400 MT), Japan (4,700 MT late – see below), and Mexico (1,200 MT).  


Late Reporting:  For 2019/2020, exports totaling 4,700 MT were reported late.  The destination was to Japan.  


Rice:    Net sales of 24,900 MT for 2019/2020 were down noticeably from the previous week, but up noticeably from the prior 4-week average.  Increases primarily for Mexico
(20,500 MT), Saudi Arabia (2,100 MT), Honduras (1,600 MT, including 1,800 MT switched from Guatemala and decreases of 200 MT), Canada (1,100 MT), and Israel (600 MT), were offset by reductions for Guatemala (1,800 MT).  Exports of 52,500 MT were down 13 percent
from the previous week and 16 percent from the prior 4-week average.  The destinations were primarily to Colombia (26,000 MT), Honduras (11,600 MT), South Korea (3,400 MT), Japan (3,200 MT), and Saudi Arabia (2,100 MT).   Exports for Own Account:  For 2019/2020,
the current exports for own account outstanding balance is 100 MT, all Canada.


Soybeans:  Net sales of 241,700 MT for 2019/2020–a marketing-year low–were down 60 percent from the previous week and 63 percent from the prior 4-week average.  Increases
primarily for Egypt (81,000 MT, including 65,000 MT  switched from unknown destinations, decreases of 1,400 MT, and 13,400 MT late – see below), Mexico (45,500 MT, including decreases of 600 MT), Indonesia (35,300 MT, including decreases of 100 MT), Tunisia
(30,000 MT), and Taiwan (26,200 MT, including 15,000 MT switched from Japan and decreases of 100 MT), were offset by reductions primarily for Costa Rica (25,900 MT) and unknown destinations (13,000 MT). 
For 2020/2021, net sales of 841,700 MT were primarily for China (594,000 MT), unknown destinations (176,000 MT), Costa Rica (25,900 MT), Taiwan (19,500 MT), and Mexico (11,200 MT).  Exports of 389,000
MT were up 29 percent from the previous week and 6 percent from the prior 4-week average.  The destinations were primarily to Egypt (146,000 MT, including 13,400 MT late – see below), Mexico (64,700 MT), Japan (52,500 MT), Morocco (27,000 MT), and Colombia
(23,000 MT).    Exports for Own Account:  For 2019/2020, the current exports for own account outstanding balance is 2,100 MT, all Canada.  Late Reporting:  For 2019/2020, net sales totaling 50,000 MT were reported late. These sales were reported for unknown
destinations (36,600 MT) and Egypt (13,400 MT).  Exports totaling 13,400 MT were reported late.  The destination was to Egypt.  


Soybean Cake and Meal:    Net sales of 143,000 MT for 2019/2020 were up noticeably from the previous week, but down 40 percent from the prior 4-week average.  Increases
primarily for Mexico (60,700 MT), Canada (15,900 MT, including decreases of 100 MT), Honduras (11,700 MT, including 5,800 MT switched from El Salvador), the Dominican Republic (10,200 MT), and Peru (10,000 MT), were offset by reductions for unknown destinations
(4,000 MT) and South Korea (100 MT).    For 2020/2021, net sales of 13,000 MT were primarily for the Dominican Republic (10,000 MT), Panama (2,300 MT), and El Salvador (500 MT).    Exports of 192,400 MT were down 35 percent from the previous week and 20 percent
from the prior 4-week average.  The destinations were primarily to the Philippines (53,700 MT), Mexico (49,300 MT), Canada (24,600 MT), Colombia (23,900 MT), and El Salvador (6,600 MT).  


Soybean Oil:  Net sales of 2,800 MT for 2019/2020 were primarily for Colombia (2,000 MT) and unknown destinations (800 MT).  Exports of 23,700 MT were down 55 percent from
the previous week and 30 percent from the prior 4-week average.  The destinations were primarily to Guatemala (11,500 MT), Colombia (8,000 MT), Jamaica (3,000 MT), Mexico (700 MT), and Canada (500 MT). 


Cotton:  Net sales of 67,300 RB for 2019/2020 were down 35 percent from the previous week and 54 percent from the prior 4-week average.  Increases primarily for Vietnam
(50,200 RB, including 1,800 RB switched from China and 500 RB switched from South Korea), China (15,700 RB, including decreases of 26,500 RB), Bangladesh (4,100 RB, including decreases of 100 RB), Indonesia (3,300 RB, including 300 RB switched from Japan),
and Taiwan (1,000 RB), were offset by reductions primarily for Pakistan (5,100 RB), South Korea (500 RB), Mexico (500 RB), Japan (400 RB), and Thailand (400 RB).  For 2020/2021, net sales of 246,200 RB reported for China (246,500 RB) and Japan (100 RB), were
offset by reductions for Mexico (400 RB).  Exports of 277,000 RB were down 12 percent from the previous week and 7 percent from the prior 4-week average.  Exports were primarily to China (105,300 RB), Vietnam (50,600 RB), Turkey (45,000 RB), Pakistan (27,600
RB), and Bangladesh (21,200 RB).  Net sales of Pima totaling 4,700 RB were up 12 percent from the previous week and 44 percent from the prior 4-week average.  Increases were primarily for India (2,600 RB), Turkey (400 RB), Pakistan (400 RB), Honduras (300
RB), and El Salvador (300 RB).  Exports of 4,400 RB were down 54 percent from the previous week and 45 percent from the prior 4-week average.  The destinations were primarily to India (2,000 RB), Turkey (700 RB), Japan (500 RB, including 100 RB late – see
below), Thailand (400 RB), and Bangladesh (300 RB).   


Exports for Own Account:  For 2019/2020, new exports for own account totaling 5,600 RB were to Vietnam (3,700 RB), China (1,100 RB), and Bangladesh (800 RB).   The current
exports for own account outstanding balance of 24,400 RB is for China (10,400 RB), Indonesia (8,200 RB),  Vietnam (4,000 RB), and Bangladesh (1,800 RB).     


Late Reporting:  For 2019/2020, exports to Japan (100 RB) were reported late.  


Hides and Skins: Net sales of 398,500 pieces for 2020 were down 34 percent from the previous week and 24 percent from the prior 4-week average.  Increases reported for
China (355,900 whole cattle hides, including decreases of 16,800 pieces), South Korea (19,300 whole cattle hides, including decreases of 400 pieces), Mexico (4,000 whole cattle hides, including decreases of 100 pieces), and Vietnam (1,100 whole cattle hides,
including decreases of 800 pieces), were offset by reductions for Thailand (2,400 MT) and Indonesia (100 MT).  Additionally, net sales of 20,600 kip skins resulting in increases for Belgium (20,800 kip skins, including decreases of 1,600 kip skins), were offset
by reductions for Canada (200 kip skins).   Exports of 405,800 pieces reported for 2020 were up 15 percent from the previous week, but down 5 percent from the prior 4-week average.  Whole cattle hides exports were primarily to China (335,800 pieces), South
Korea (20,100 pieces), Mexico (16,200 pieces), Thailand (12,400 pieces), and El Salvador (6,000 pieces).  In addition, exports of 3,900 kip skins were to Belgium (2,700 kip skins) and Canada (1,200 kip skins).


Net sales of 55,500 wet blues for 2020 were down 6 percent from the previous week and 22 percent from the prior 4-week average.  Increases were reported for Italy (19,200
unsplit and 12,100 grain splits), Thailand (19,700 unsplit, including decreases of 300 unsplit), Vietnam (5,700 unsplit), and Taiwan (4,000 unsplit), were offset by reductions for the Dominican Republic (4,800 unsplit), China (300 unsplit), and Brazil (100
grain splits).  Exports of 77,900 wet blues for 2020 were up 6 percent from the previous week and 1 percent from the prior 4-week average.  The destinations were to China (37,500 unsplit), Italy (25,000 unsplit), Thailand (10,100 unsplit), Vietnam (3,800 unsplit),
and Taiwan (1,600 unsplit).  Net sales of 25,300 splits were for Vietnam.  Exports of 199,800 pounds were to Vietnam.


Beef: Net sales of 12,300 MT reported for 2020 were down 49 percent from the previous week and 36 percent from the prior 4-week average.  Increases were primarily for Japan
(3,800 MT, including decreases of 500 MT), South Korea (2,900 MT, including decreases of 600 MT), Taiwan (1,700 MT, including decreases of 100 MT), Mexico (900 MT), and Canada (900 MT, including decreases of 100 MT).  Exports of 14,600 MT were down 21 percent
from the previous week, but up 23 percent from the prior 4-week average.  The destinations were primarily to Japan (5,000 MT), South Korea (4,800 MT), Canada (1,200 MT), Hong Kong (1,000 MT), and Taiwan (900 MT).


Pork:  Net sales of 39,200 MT reported for 2020 were up 63 percent from the previous week and 61 percent from the prior 4-week average.  Increases were primarily for China
(21,600 MT, including decreases of 900 MT), Mexico (8,400 MT, including decreases of 4,300 MT), Japan (2,200 MT, including decreases of 300 MT), Canada (2,100 MT, including decreases of 500 MT), and the Philippines (900 MT, including decreases of 300 MT). 
Exports of 31,000 MT were up 5 percent from the previous week, but down 2 percent from the prior 4-week average.  The destinations were primarily to China (11,800 MT), Mexico (9,200 MT), Japan (3,200 MT), Canada (2,400 MT), and South Korea (2,000 MT).  


U.S. EXPORT SALES FOR WEEK ENDING 6/25/2020                        


CURRENT MARKETING YEAR

NEXT MARKETING YEAR

COMMODITY

NET SALES

OUTSTANDING SALES

WEEKLY EXPORTS

ACCUMULATED EXPORTS

NET SALES

OUTSTANDING SALES

CURRENT YEAR

YEAR
AGO

CURRENT YEAR

YEAR
AGO


THOUSAND METRIC TONS

WHEAT


   HRW    

181.0

1,932.9

1,825.4

236.0

838.6

1,071.1

0.0

0.0

   SRW    

-32.6

510.8

853.3

57.3

100.5

161.2

75.0

75.0

   HRS     

122.7

1,621.1

1,387.2

145.0

464.2

385.3

0.0

0.0

   WHITE   

141.7

1,098.8

1,018.8

70.4

389.3

271.9

0.0

0.0

   DURUM  

1.5

225.0

173.9

0.0

85.0

54.5

0.0

0.0

     TOTAL

414.3

5,388.7

5,258.7

508.6

1,877.6

1,944.0

75.0

75.0

BARLEY

1.0

40.3

48.5

0.8

1.3

2.8

0.0

0.0

CORN

361.1

8,430.9

6,025.9

1,439.9

33,882.6

42,889.7

262.7

3,892.9

SORGHUM

144.4

843.4

245.6

131.3

3,313.1

1,309.1

68.0

456.0

SOYBEANS

241.7

7,745.1

10,620.1

389.0

37,297.5

37,780.0

841.7

6,936.8

SOY MEAL

143.0

2,092.9

2,369.2

192.4

8,970.3

8,904.2

13.0

368.9

SOY OIL

2.8

212.9

170.7

23.7

976.4

634.3

0.0

11.0

RICE


   L G RGH

19.8

81.7

200.2

37.7

1,317.4

1,230.4

0.0

57.0

   M S RGH

0.0

24.0

21.5

0.2

72.5

81.8

0.0

5.7

   L G BRN

0.2

11.4

2.9

0.5

56.8

38.6

0.0

0.0

   M&S BR

0.0

31.6

0.1

3.0

87.4

147.0

0.0

0.0

   L G MLD

2.6

58.6

203.7

3.0

830.6

791.6

0.0

0.0

   M S MLD

2.3

129.1

133.2

8.1

610.2

519.5

0.0

0.0

     TOTAL

24.9

336.4

561.6

52.5

2,974.9

2,809.0

0.0

62.7

COTTON


THOUSAND RUNNING BALES      

   UPLAND

67.3

4,441.8

3,629.4

277.0

12,551.1

11,633.2

246.2

3,490.1

   PIMA

4.7

126.0

122.3

4.4

448.4

605.9

0.0

33.9


Terry Reilly

Senior Commodity Analyst – Grain and Oilseeds

Futures International │190 S LaSalle St., Suite 410│Chicago, IL  60603

W: 312.604.1366

treilly@futures-int.com

AIM: fi_treilly

ICE IM: 
treilly1

Skype: fi.treilly


Description: Description: Description: Description: FImail


Trading of futures, options, swaps and other derivatives is risky and is not suitable for all persons.  All of these investment products are leveraged, and you can lose more than your initial deposit.  Each investment product is offered
only to and from jurisdictions where solicitation and sale are lawful, and in accordance with applicable laws and regulations in such jurisdiction.  The information provided here should not be relied upon as a substitute for independent research before making
your investment decisions.  Futures International, LLC is merely providing this information for your general information and the information does not take into account any particular individual’s investment objectives, financial situation, or needs.  All investors
should obtain advice based on their unique situation before making any investment decision.  The contents of this communication and any attachments are for informational purposes only and under no circumstances should they be construed as an offer to buy or
sell, or a solicitation to buy or sell any future, option, swap or other derivative.  The sources for the information and any opinions in this communication are believed to be reliable, but Futures International, LLC does not warrant or guarantee the accuracy
of such information or opinions.  Futures International, LLC and its principals and employees may take positions different from any positions described in this communication.  Past results are not necessarily indicative of future results.