PDF Attached


Morning
USDA
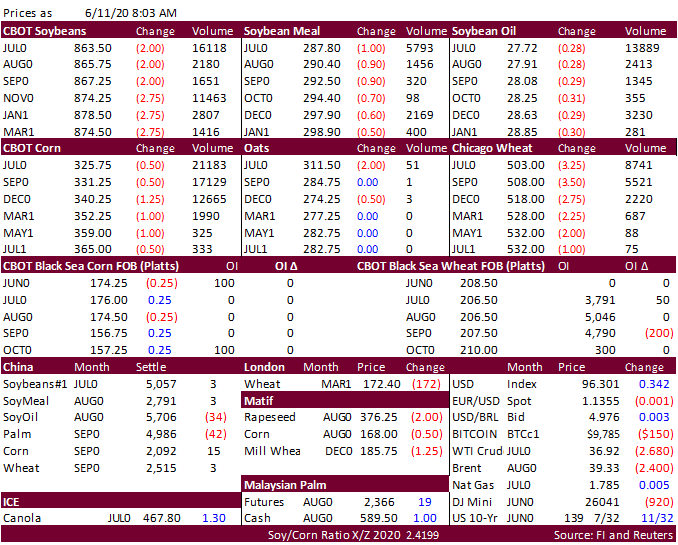
reported 720,000 tons of soybeans were sold to China. 
USDA
due out later.   China S&D’s unchanged for 2020-21.  USD is higher and WTI crude sharply lower.  US Dow futures are down nearly 900 points.  The US Fed estimates a three-year recovery in GDP. 


Weather

UNITED
STATES

  • Not
    much change occurred in the first week of the outlook overnight
    • Net
      drying is expected in most of the nation’s key crop areas from the heart of the Great Plains into the Midwest, Delta and interior southeastern states
    • Rain
      is still advertised to fall heavily from coastal areas from northeastern Florida to New Jersey with heavy rain occurring inland to include most of Virginia and North Carolina
  • Rain
    June 18-20 was shifted north into eastern Canada’s Prairies while reduced in the northern U.S. Plains and upper Midwest
    • Some
      of this change was needed
  • Rain
    was increased from the central and southwestern Plains through the heart of the Midwest June 21-23 and the wetter bias continued June 24-25 in the Midwest while also occurring in the southern Plains and a part of the interior southeastern states
    • The
      increase was overdone, although there will be an increase in rainfall during the June 21-25 period


This
morning’s model run was limited on rainfall through June 20 for most of the key U.S. crop areas and then a notable expansion of rain was suggested for June 21-25. A boost in rainfall is expected late in the second week of the outlook and it should linger into
the last week of this month. However, some of the advertised rainfall was overdone.  There will also be a chance for needed rain in a part of the southwestern Plains during the June 22-25 period, although its significance was certainly overdone today.  The
idea of weather pattern changes occurring after day ten makes good logical sense and if the change comes as advertised there would be replenishment for soil moisture in the Midwest that is lost over the coming ten days of limited rainfall and crops will remain
in good shape for most of the Midwest. Drought relief in the southwestern Plains may not be nearly as great as the GFS model implies.


EUROPE/BLACK
SEA REGION

  • No
    significant change was suggested in the first ten days of the outlook
    • Rain
      is expected to occur in most of the continent, although there will be some areas that get less than others
      • No
        area will be exceptionally dry, although Scandinavia seems to get the least amount of moisture
  • Rain
    was increased in northwestern Europe June 18-20
    • Some
      of this was overdone
  • Rain
    was reduced from northern Ukraine into Belarus and the Baltic States and increased slightly in northwestern Russia June 18-20
    • Some
      of this change was needed
  • GFS
    reduced rain from the Balkan Countries into Germany and western Poland June 21-23
    • Some
      of the reduction was needed
  • Rain
    was increased in parts of Ukraine
    • This
      change was needed
  • Central
    Europe rainfall was increased June 24-25 and reduced in northern Spain
    • Some
      of these changes were overdone


Overall,
weather in Europe will continue mostly favorable during the next two weeks with timely rain for most areas and no dominating period of warm to hot and dry conditions. June 21-25 may be a little drier than advertised this morning for parts of eastern Europe
and the western CIS and future model runs may move in that direction.


EASTERN
RUSSIA NEW LANDS

  • Not
    much change occurred in this first ten days of the outlook, although there was a subtle reduction in advertised rain for parts of the region
  • GFS
    reduced precipitation in the southern Ural Mountain region and areas southwest into the middle Volga River Valley June 21-23
    • This
      reduction was badly needed
  • Some
    reduction in rainfall was also suggested in the western and central New Lands June 24-25
    • This
      reduction in rain was needed, but the model may still be too wet for that period


Even
though there is no broad based dry and warm weather pattern in the New Lands there is some tendency for restricted rainfall in the first week of the outlook and it would not be surprising to see less rain in the second week a little later today or in Friday’s
model runs.  There might also be a warming trend showing up in the second week of the outlook over western parts of the New Lands during the second week in future model runs.  For now, the outlook remains favorable for most crops in the New Lands.


CHINA

  • No
    major changes were noted in this first week of the outlook
    • Additional
      drought relief is expected today into Saturday with a few showers briefly Monday into Tuesday
      • Henan
        and Anhui have already received rain this week, but that which occurs today into Saturday will seriously curb drought in those provinces
  • GFS
    reduced rain in areas north of the Yellow River in this first week of the outlook and the second week is still advertised to be dry
    • This
      change is consistent with World Weather, Inc.’s prediction that dryness in China would shift a little farther north in China for a while
      • Dryness
        is expected from northern Shaanxi and neighboring areas of Inner Mongolia into northern Shandong and southern Hebei over the next two weeks


The
bottom line brings includes periods of heavy rainfall in east-central and southern China over the next two weeks. Heavy rain from Sichuan to southern Jiangsu and Zhejiang results from rain that falls today into Saturday and that which occurs late Monday into
Wednesday of next week. Some flooding is expected especially from the rain that falls next week. This may harm winter wheat and rapeseed quality and delay harvesting. A weak tropical cyclone will move into western Guangdong this weekend and feeds moisture
into the Yangtze River Basin resulting in next week’s heavy rainfall and flood event. The tropical cyclone will also bring some heavy rain back to Guangxi which flooded last weekend.


SOUTH
AMERICA

  • No
    change occurred in the first week of the outlook
  • Rain
    was increased in western Buenos Aires June 21-22
    • This
      change would be good for winter wheat planting and establishment, but it may have been overdone


AUSTRALIA

  • Not
    much change of significance was noted overnight
  • Rain
    was reduced for Western Australia on the 00z GFS model run and the reduction was maintained on this 06z GFS model run
    • Rain
      still falls in Western Australia lightly today and again during mid-week next week
      • This
        rainfall is not as great as that advertised in Wednesday’s model runs, but some beneficial moisture will still impact the state’s winter crops
    • Rain
      is still expected to occur in southeastern Queensland and northeastern New South Wales Friday into Saturday
      • This
        moisture will be good for winter wheat and barley development

Source:
World Weather Inc. and FI


Source:
World Weather Inc. and FI


Source:
World Weather Inc. and FI


Bloomberg
Ag Calendar

THURSDAY,
June 11:

  • USDA’s
    monthly World Agricultural Supply and Demand (Wasde) report, noon
  • USDA
    weekly crop net-export sales for corn, soybeans, wheat, cotton, 8:30am
  • China
    CASDE monthly crop supply and demand report
  • Vietnam’s
    coffee, rice and rubber export data for May
  • Malaysian
    Palm Oil Council webinar: Palm oil in post- pandemic
  • HOLIDAY:
    Brazil

FRIDAY,
June 12:

  • ICE
    Futures Europe weekly commitments of traders report on coffee, cocoa, sugar positions
  • CFTC
    commitments of traders weekly report on positions for various U.S. futures and options, 3:30pm
  • FranceAgriMer
    weekly update on crop conditions
  • New
    Zealand food prices
  • Shanghai
    exchange’s weekly commodities inventory
  • HOLIDAY:
    Russia

Source:
Bloomberg and FI


Macros

·        
US Dow futures are sharply lower, USD higher and WTI more than $2.50 lower

·        
livesquawk US Initial Jobless Claims Jun 6: 1542K (est 1550K; prevR K; prevR 1897K; prev 1877K)

US
Continuing Claims May 30: 20929K (est 20000K; prevR K; prevR 21268K; prev 21487K)

·        
US PPI Final Demand (M/M) May: 0.4% (est 0.1%; prev -1.3%)

US
PPI Ex Food & Energy (M/M) May: -0.1% (est -0.1%; prev -0.3%)

US
PPI Ex Food, Energy, Trade (M/M) May: 0.1% (est -0.1%; prev -0.9%)

·        
US PPI Final Demand (Y/Y) May: -0.8% (est -1.2%; prev -1.2%)

US
PPI Ex Food & Energy (Y/Y) May: 0.3% (est 0.4%; prev 0.6%)

US
PPI Ex Food, Energy, Trade (Y/Y) May: -0.4% (est -0.6%; prev -0.3%)


Corn.

·        
Corn is lower on plunging US stock markets, $2.70 decline in WTI crude oil (7:53 am CT), and favorable rain over the past three days across the US Corn Belt. 

·        
USDA export sales corn of 660,700 tons old crop were within expectations. New -crop sales were a poor 25,900 tons.  China bought a cargo of sorghum.  Pork sales were 17,200 tons with Mexico and Canada as largest buyers. 

·        
China made no changes to their 2020-21 corn projections in their monthly CASDE report, but they lowered its forecast for 2019-20 corn industrial consumption by 500,000 tons to 82 million tons, down 500,000 tons from last month
on rising corn costs. 

·        
China corn futures are trading around their highest values in a month.

·        
China nearly sold all of its 4 million tons of corn offered from state reserves.   

  • China
    said they are close to making an effective vaccine for African swine fever. 

·        
Goldman Roll ends today. 


Corn
Export Developments

  • None
    reported


Soybean
complex
.

·        
China: Soybean futures highest since April

·        
China cash crush margins as of this morning, using our calculation, were 48 cents per bushel (53 previous), lowest level since early August 2019, and compares to 63 cents a week ago and 88 cents
around this time last year.

·        
Indian Vegetable Oil Producers Association (IVPA) estimated 2020 Indonesia palm oil production up 3% 46,475,000 tons from the previous year and Malaysian palm oil output down 3% to 19,211,000 tons. 
The Malaysian Palm Oil Council looks for an improvement in palm oil exports due to price discounts and smaller than average EU rapeseed crop. 

·        
Malaysia


Oilseeds
Export Developments

  • Syria
    will retender for 50,000 tons of soymeal and 50,000 tons of corn on June 24 for delivery within four months of contract.


Wheat

  • US
    wheat futures are lower on a sharply higher USD and lower outside markets.  Upward revisions to Russia’s wheat crop and export prospects are also weighing on prices. 
  • USDA
    all wheat export sales were 270,400 tons, high end of expectations. 
  • China’s
    Ministry of Agriculture and Rural Affairs reported wheat harvest progress at around 11.3 million hectares as of June 5, or 50 percent of the planned area. Progress is about three days ahead last year.
  • Argentina’s
    Rosario grains exchange warned dryness across the central agricultural region may threaten prediction that farmers will sow a record 7 million hectares of wheat in 2020-21 cycle.  7 million hectares could yield 22 million tons.
  • IKAR
    revised their Russia wheat export estimate for 2020-21 to 35 million tons, up 1 million from previous.
  • Paris
    December wheat was down 1.25 euros at 185.75 at the time this was written.

  • France’s
    Rouen Grain Exports Rose 6.9% in Week to June 10 – Bloomberg
  • Strategie
    Grains lowered their EU soft wheat crop 2 million tons from last month to 130.9 million tons, 11% below last year’s output.


Export
Developments.


Rice/Other

  • CBOT
    July rice continued to weaken against the September contract.
  • Vietnam’s
    May Rice Exports Highest Since 2009 After Limits End – Bloomberg
    • Jan-May
      exports were 3.09MMT, up 12.2% from last year.  May alone was up 87% yoy. 
  • South Korea’s Agro-Fisheries
    and Food Corp seeks 80,605 tons of non-glutinous rice for October 2020 and March 2021 shipment.

    TONNES(M/T)   
GRAIN TYPE    ORIGIN    ARRIVAL/PORT

           
90     Milled Long   Thailand  Oct 31,2020/Busan

        
1,410     Milled Long   Thailand  Oct 31,2020/Busan

       
20,000     Brown Short   China     Jan 31,2021/Gunsan

       
20,000     Brown Short   China     Jan 31,2021/Ulsan

       
20,000     Brown Short   China     March 31,2021/Donghae

       
19,105     Brown Short   China     March 31,2021/Mokpo


  U.S. EXPORT SALES FOR WEEK ENDING 6/4/2020                               


CURRENT MARKETING YEAR

NEXT MARKETING YEAR

COMMODITY

NET SALES

OUTSTANDING SALES

WEEKLY EXPORTS

ACCUMULATED EXPORTS

NET SALES

OUTSTANDING SALES

CURRENT YEAR

YEAR
AGO

CURRENT YEAR

YEAR
AGO

WHEAT

THOUSAND METRIC TONS      

   HRW    

106.8

1,976.3

2,429.7

121.8

121.8

191.3

0.0

0.0

   SRW     

0.1

529.5

853.8

2.1

2.1

30.0

0.0

0.0

   HRS     

114.1

1,751.9

1,347.4

18.0

18.0

78.2

0.0

0.0

   WHITE   

47.9

1,136.5

948.0

9.0

9.0

57.5

0.0

0.0

   DURUM  

1.4

261.9

189.1

21.4

21.4

23.1

0.0

0.0

     TOTAL

270.4

5,656.1

5,768.0

172.4

172.4

380.1

0.0

0.0

BARLEY

0.0

40.2

50.0

0.5

0.5

0.5

0.0

0.0

CORN

660.7

10,880.7

7,147.6

1,241.2

30,252.2

41,259.1

25.9

3,438.4

SORGHUM

69.7

1,160.3

415.6

230.3

2,856.1

1,144.4

83.0

278.0

SOYBEANS

1,003.7

7,442.4

11,266.1

292.6

36,218.6

35,652.7

1,212.5

4,152.3

SOY MEAL

207.9

2,446.1

2,687.8

181.8

8,280.0

8,430.6

-19.0

285.9

SOY OIL

9.5

260.8

151.0

6.4

898.8

610.7

0.0

11.0

RICE


   L G RGH

-57.5

187.2

203.6

6.5

1,216.7

1,143.3

57.0

57.0

   M S RGH

5.7

36.9

15.9

1.4

65.3

81.2

0.0

0.0

   L G BRN

0.1

12.6

3.4

0.1

55.2

37.7

0.0

0.0

   M&S BR

0.0

41.4

2.7

1.2

77.4

144.2

0.0

0.0

   L G MLD

21.3

46.3

181.0

21.3

819.4

752.2

0.0

0.0

   M S MLD

12.9

163.1

144.7

18.8

564.1

494.3

0.0

0.0

     TOTAL

-17.5

487.5

551.3

49.4

2,798.0

2,652.9

57.0

57.0

COTTON


THOUSAND RUNNING BALES      


   UPLAND

399.6

5,115.6

4,519.4

294.3

11,609.7

10,649.0

193.4

3,027.7

   PIMA

3.4

132.2

163.2

14.7

428.5

553.3

0.1

33.9


Export Sales Highlights 

This
summary is based on reports from exporters for the period May 29-June 4, 2020.


  • Wheat:  Net
    sales for the 2020/2021 marketing year, which began June 1, totaled 270,400 MT metric tons, resulting increases for Guatemala (96,000 MT), the Philippines (71,500 MT), Indonesia (66,200 MT, including 12,200 MT switched from unknown destinations and decreases
    of 1,000 MT), China (63,000 MT, including 60,000 MT switched from unknown destinations), and Colombia (29,800 MT, including 27,200 RB switched from unknown destinations.  Reductions were for unknown destinations (160,400 MT) and South Africa (40,000 MT). 
    A total of 2,088,000 MT in sales were carried over from the 2019/2020 marketing year, which ended May 31.  Exports for the period ending May 31, of 334,900 MT brought accumulated exports to 24,812,200 MT, up 2 percent from the prior year’s total of 24,231,600
    MT.  The primary destinations were primarily the Philippines (76,100 MT), Nigeria (48,700 MT), South Africa (44,000 MT), Guatemala (40,300 MT), and Indonesia (33,100 MT).  Exports for June 1- 4, totaled 172,400 MT, with China (63,000 MT), Colombia (29,500
    MT), Italy (21,400 MT), Vietnam (20,600 MT), and Mexico (13,500 MT) being the primary destinations.
  • Corn: 
    Net sales of 660,700 MT for 2019/2020 were up 4 percent from the previous week, but down 12 percent from the prior 4-week average.  Increases primarily for Japan (266,900 MT, including 95,300 MT switched from unknown destinations and decreases of 5,100 MT),
    Colombia (128,700 MT, including 25,000 MT switched from unknown destinations and decreases of 900 MT), South Korea (114,800 MT, including decreases of 7,000 MT), Mexico (90,200 MT, including decreases of 132,300 MT), and Saudi Arabia (59,500 MT, including
    63,000 MT switched from unknown destinations and decreases of 3,500 MT), were offset by reductions primarily for unknown destinations (163,000 MT).  For 2020/2021, net sales of 25,900 MT reported for Peru (40,100 MT), Jamaica (5,000 MT), and Honduras (2,600
    MT), were offset by reductions primarily for Mexico (14,600 MT) and Colombia (7,000 MT).  Exports of 1,241,200 MT were down 8 percent from the previous week, but unchanged from the prior 4-week average.  The destinations were primarily to Mexico (293,700 MT),
    South Korea (237,300 MT), Japan (208,000 MT), Peru (129,800 MT), and Israel (61,900 MT).  
    Optional Origin Sales:  For 2019/2020, new optional origin sales of 65,000 MT were reported for Vietnam.  Options were exercised to export 54,000 MT to South Korea from the United States.  Decreases totaling 195,000 MT were reported for Vietnam.  The
    current outstanding balance of 459,000 MT is for South Korea (329,000 MT), Vietnam (65,000 MT), and Taiwan (65,000 MT).  For 2020/2021, new optional origin sales of 195,000 MT were reported for Vietnam. The current outstanding balance of 195,000 MT is for
    Vietnam.  Export Adjustments: Accumulated exports of corn to Guatemala were adjusted down 3,469 MT for week ending May 28th. These exports were reported in error.
  • Barley: 
    No net sales were reported for the 2020/2021 marketing year, which began June 1.  A total of 9,200 MT in sales were carried over from the 2019/2020 marketing year, which ended May 31.  Accumulated exports were 41,100 MT, down 3 percent from the prior year’s
    total of 42,500 MT.  Exports for the period ending May 31 totaled 500 MT, with Japan being the destination. There were no exports for the period ending June 1.
  • Sorghum: 
    Net sales of 69,700 MT for 2019/2020 were down 25 percent from the previous week and 19 percent from the prior 4-week average.  Increases reported for China (66,700 MT) and Eritrea (33,000 MT, switched from unknown destinations), were offset by reductions
    for unknown destinations (30,000 MT).  For 2020/2021, total net sales of 83,000 MT were for unknown destinations.  Exports of 230,300 MT were up noticeably from the previous week and up 83 percent from the prior 4-week average.  The destinations were to China
    (197,300 MT) and Eritrea (33,000 MT, late – see below).    Late Reporting:  For 2019/2020, exports totaling 33,000 MT were reported late.  The destination was Eritrea.
  • Rice: 
    Net sales reductions of 17,500 MT for 2019/2020–a marketing-year low–were down noticeably from the previous week and from the prior 4-week average.  Increases primarily for Haiti (11,600 MT, including decreases of 100 MT), Mexico (9,600 MT), Jordan (6,000
    MT), Saudi Arabia (5,500 MT), and Canada (3,100 MT, including decreases of 100 MT), were more than offset by reductions primarily for Nicaragua (57,000 MT).  For 2020/2021, total net sales of 57,000 MT were for Nicaragua.  Exports of 49,400 MT were down 35
    percent from the previous week and 19 percent from the prior 4-week average.  The destinations were primarily to Japan (15,300 MT), Haiti (15,200 MT), El Salvador (6,000 MT), Saudi Arabia (3,300 MT), and Canada (3,100 MT).   
    Exports for Own Account: 
    For 2019/2020, the current exports for own account outstanding balance is 100 MT, all Canada. 
    Export Adjustments: Accumulated exports of long grain rough rice to Mexico were adjusted down 30,000 MT and exports of long grain milled rice to Mexico were adjusted down 25,250 MT for week ending May 14th. These exports were reported in error.
  • Soybeans: 
    Net sales of 1,003,700 MT for 2019/2020 were up noticeably from the previous week and up 36 percent from the prior 4-week average.  Increases were primarily for China (337,000 MT), unknown destinations (213,200 MT), Mexico (85,000 MT), Japan (72,400 MT, including
    56,800 MT switched from unknown destinations and decreases of 1,500 MT), and Taiwan (70,300 MT, including decreases of 100 MT).  For 2020/2021, net sales of 1,212,500 MT were primarily for unknown destinations (644,000 MT), China (517,000 MT), and Taiwan (46,000
    MT).  Exports of 292,600 MT–a marketing-year low–were down 39 percent from the previous week and 33 percent from the prior 4-week average.  The destinations were primarily to Japan (61,200 MT), Bangladesh (58,300 MT), Mexico (48,900 MT), Egypt (48,300 MT),
    and Indonesia (26,100 MT).    Exports for Own Account:  For 2019/2020, the current exports for own account outstanding balance is 2,100 MT, all Canada.
      
    Late Reporting: For 2019/2020, exports totaling 4,100 MT were reported late. The destination was Cuba.
  • Soybean
    Cake and Meal

    Net sales of 207,900 MT for 2019/2020 were down 63 percent from the previous week and 15 percent from the prior 4-week average.  Increases primarily for El Salvador (37,200 MT, including 11,000 MT switched from Guatemala, 5,000 MT switched from Honduras, 1,000
    MT switched from Nicaragua, and decreases of 100 MT), the Philippines (32,200 MT, including decreases of 900 MT), Mexico (29,600 MT), Peru (25,200 MT), and Canada (23,700 MT, including decreases of 1,400 MT), were offset by reductions for Guatemala (10,000
    MT), Honduras (4,400 MT), Qatar (1,600 MT), Nicaragua (1,000 MT), and Taiwan (500 MT).  For 2020/2021, net sales reductions of 19,000 MT resulting in increases for Canada (300 MT), were more than offset by reductions for Colombia (19,300 MT). 
    Exports
    of 181,800 MT were down 37 percent from the previous week and 19 percent from the prior 4-week average.  The destinations were primarily to Morocco (32,300 MT), Mexico (28,800 MT), Colombia (26,600 MT), Canada (26,000 MT), and El Salvador (19,900 MT).  
    Export Adjustments: Accumulated exports of soybean cake and meal to New Zealand were adjusted down 5,000 MT for week ending May 28th.  The correct destination is Australia and is included in this week’s report.
  • Soybean
    Oil: 
    Net
    sales of 9,500 MT for 2019/2020 primarily for Colombia (2,700 MT, including decreases of 300 MT), South Korea (2,600 MT), the Dominican Republic (2,100 MT), El Salvador (2,000 MT), and Mexico (500 MT), were offset by reductions for Canada (500 MT).  Exports
    of 6,400 MT were down 92 percent from the previous week and 86 percent from the prior 4-week average.  The destinations were to Colombia (2,500 MT), Mexico (1,300 MT), El Salvador (1,100 MT), Nicaragua (800 MT), and Canada (400 MT).
  • Cotton: 
    Net sales of 399,600 RB for 2019/2020 were down noticeably from the previous week, but up noticeably from the prior 4-week average.  Increases for China (209,500 RB, including 2,200 RB switched from Vietnam and decreases of 28,700 RB), Vietnam (176,200 RB,
    including 2,000 RB switched from South Korea), Pakistan (13,200 RB), Turkey (11,100 RB), and Thailand (100 RB, including decreases of 900 RB), were offset by reductions primarily for Malaysia (5,300 RB), Bangladesh (2,800 RB), and South Korea (2,000 RB). 
    For 2020/2021, net sales of 193,400 RB were primarily for China (161,700 RB), Vietnam (22,000 RB), Malaysia (5,300 RB), and Bangladesh (3,500 RB).  Exports of 294,300 RB were up 24 percent from the previous week and 18 percent from the prior 4-week average. 
    Exports were primarily to China (86,400 RB), Vietnam (67,400 RB), Turkey (56,500 RB), Pakistan (32,400 RB), and Bangladesh (15,800 RB).  Net sales of Pima totaling 3,400 RB were up noticeably from the previous week and up 27 percent from the prior 4-week average. 
    Increases were for China (900 RB), India (500 RB), Pakistan (400 RB), Bangladesh (400 RB), and Turkey (400 RB).  For 2020/2021, total net sales of 100 RB were reported for China.  Exports of 14,700 RB were up noticeably from the previous week and from the
    prior 4-week average.  The destinations were primarily to China (8,300 RB), Pakistan (2,400 RB), India (1,300 RB), Bangladesh (900 RB), and Egypt (700 RB). 
    Exports for Own Account:  For 2019/2020, exports for own account totaling 8,200 RB to Vietnam (6,000 RB) and China (2,200 RB) were applied to new or outstanding sales.  The current exports for own account outstanding balance of 23,500 RB is for China
    (8,500 RB), Indonesia (8,200 RB), Vietnam (5,800 RB), and Bangladesh (1,000 RB)

·        
Hides and Skins:

Net sales of 757,800 pieces for 2020 were up 93 percent from the previous week and up noticeably from the prior 4-week average.  Increases primarily for China (709,400 whole cattle hides, including decreases of 10,900 pieces), South Korea (22,600 whole cattle
hides, including decreases of 400 pieces), Mexico (10,200 whole cattle hides, including decreases of 400 pieces), Thailand (7,900 whole cattle hides, including decreases of 24,900 pieces), and Taiwan (4,700 whole cattle hides), were offset by reductions for
Indonesia (100 whole cattle hides).
 
Additionally, net sales reductions were reported for Canada (100 kip skins).
Exports of 430,100 pieces reported for 2020 were up 4 percent from the previous week and 3 percent from the prior 4-week average.  Whole cattle hides exports were primarily to China (370,100 pieces), South Korea (25,900 pieces), Mexico (9,700 pieces), Vietnam
(6,400 pieces), and Thailand (5,700 pieces).  In addition, there were exports to Italy (1,300 kip skins) and Canada (1,300 kip skins).

·        
Net sales of 135,200 wet blues

for 2020 were up noticeably from the previous week and from the prior 4-week average.  Increases were primarily for China (93,700 unsplit and 1,100 grain splits), Mexico (16,000 grain splits, 800 unsplit, and decreases of 100 unsplit), Italy (14,000 unsplit,
including decreases of 800 unsplit), the Dominican Republic (7,200 unsplit), and South Korea (2,000 grain splits).  Exports of 92,300 wet blues for 2020 were up 42 percent from the previous week and 27 percent from the prior 4-week average.  The destinations
were to Italy (80,200 unsplit), Thailand (4,000 unsplit and 1,600 grain splits), Brazil (2,200 grain splits), Vietnam (2,100 unsplit), and the Dominican Republic (800 unsplit).  Net sales reductions of 2,500 splits for China (including decreases of 4,000 splits). 
Exports of 218,400 pounds were to Vietnam (120,000 pounds) and China (98,400 pounds).

·        
Beef:

Net sales of 20,400 MT
reported for 2020 were up 66 percent from the previous week and up noticeably from the prior 4-week average.  Increases were primarily for South Korea (7,200 MT, including decreases of 300 MT), Japan (5,500 MT, including decreases of 600 MT), Mexico (2,300
MT), Canada (2,200 MT, including decreases of 100 MT), and Taiwan (1,900 MT, including decreases of 100 MT).  Exports of 10,900 MT were up 14 percent from the previous week, but down 1 percent from the prior 4-week average.  The destinations were primarily
to Japan (4,000 MT), South Korea (3,200 MT), Hong Kong (1,100 MT), Taiwan (1,000 MT), and Canada (300 MT).  

·        
Pork:
Net sales of 17,200 MT reported for 2020 were down 1 percent from
the previous week, but up 60 percent from the prior 4-week average.  Increases were primarily for Mexico (5,100 MT, including decreases of 100 MT), Canada (4,700 MT, including decreases of 300 MT), China (2,600 MT, including decreases of 2,600 MT), Japan (1,800
MT, including decreases of 700 MT and late 100 MT – see below), and Honduras (1,400 MT).  Exports of 31,700 MT were up 1 percent from the previous week, but down 8 percent from the prior 4-week average.  The destinations were primarily to China (12,700 MT),
Mexico (8,200 MT), Japan (4,300 MT, late 100 MT – see below), South Korea (1,800 MT), and Canada (1,600 MT). 
Late Reporting: For 2020, net sales totaling 100 MT were reported late. These sales were reported for Japan.  For 2020, exports totaling 100 MT were reported late. The destination was Japan.


                                                                                                SUMMARY OF EXPORT TRANSACTIONS
                                                                                 REPORTED UNDER THE DAILY SALES REPORTING SYSTEM
                                                                                                FOR PERIOD ENDING JUNE 4, 2020
 

COMMODITY                                            
DESTINATION                                            QUANITY (MT) 
                          MARKETING YEAR

SOYBEANS                                                 CHINA                                                         132,000 MT 1/                                2019/2020

SOYBEANS                                                 UNKNOWN                                                 382,000 MT 1/                                2019/2020

SOYBEANS                                                 UNKNOWN                                                 512,000 MT 1/                                2020/2021


1/ Export sales. 


Terry Reilly

Senior Commodity Analyst – Grain and Oilseeds

Futures International │190 S LaSalle St., Suite 410│Chicago, IL  60603

W: 312.604.1366

treilly@futures-int.com

AIM: fi_treilly

ICE IM: 
treilly1

Skype: fi.treilly


Description: Description: Description: Description: FImail


Trading of futures, options, swaps and other derivatives is risky and is not suitable for all persons.  All of these investment products are leveraged, and you can lose more than your initial deposit.  Each investment product is offered
only to and from jurisdictions where solicitation and sale are lawful, and in accordance with applicable laws and regulations in such jurisdiction.  The information provided here should not be relied upon as a substitute for independent research before making
your investment decisions.  Futures International, LLC is merely providing this information for your general information and the information does not take into account any particular individual’s investment objectives, financial situation, or needs.  All investors
should obtain advice based on their unique situation before making any investment decision.  The contents of this communication and any attachments are for informational purposes only and under no circumstances should they be construed as an offer to buy or
sell, or a solicitation to buy or sell any future, option, swap or other derivative.  The sources for the information and any opinions in this communication are believed to be reliable, but Futures International, LLC does not warrant or guarantee the accuracy
of such information or opinions.  Futures International, LLC and its principals and employees may take positions different from any positions described in this communication.  Past results are not necessarily indicative of future results.